US May Production Plunges 2Mb/d

A post by Ovi at peakoilbarrel

All of the oil (C + C) production data for the US states comes from the EIAʼs Petroleum Supply monthly PSM. At the end of the production charts, an analysis of three different EIA monthly reports projecting future production is provided. The charts below are updated to May 2020 for the 10 largest US oil producing states.

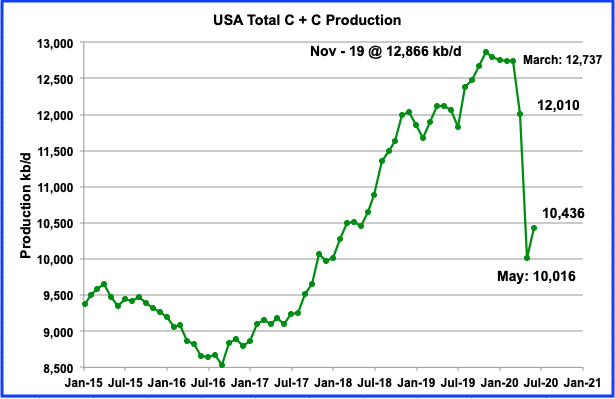
May’s production drop is just short of 2 Mb/d by 11 kb/d. Awesome. US oil fields began a slow and steady decline from November 2019 to March 2020. March brought the combination of CV-19 and oil price drop that led to the sharp production plunges in April and May. Since the current EIA data is two months delayed, May is the second month that shows the combined effects of the pandemic and low oil prices. Will June drop below 10,000 kb/d?

Read More

US GoM 2019 Summary: Part III – Production

A Guest Post by George Kaplan

Overall Annual Production

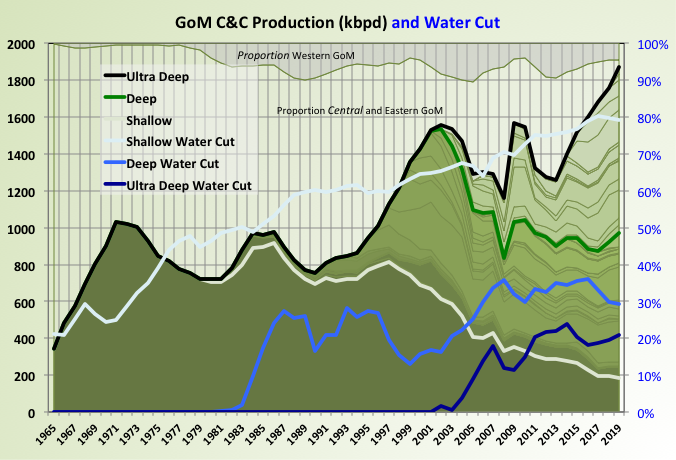
US Gulf of Mexico C&C production has had a series of peaks; firstly two from shallow oil, the middle acceleration probably caused by the mid seventies oil shock; followed by deep oil development and finally by ultra deep oil, with a dip in the middle from the Deep Horizon drilling hiatus. Most production has come from eastern and central (i.e. mainly Louisiana) with some, and falling, from the western section (Texas).

Read More

US Oil Decline Accelerates in April

A post by Ovi at peakoilbarrel.

All of the oil (C + C) production data for the US states comes from the EIAʼs Petroleum Supply monthly PSM. At the end, an analysis of three different EIA monthly reports is provided. The charts below are updated to April 2020 for the 10 largest US oil producing states.

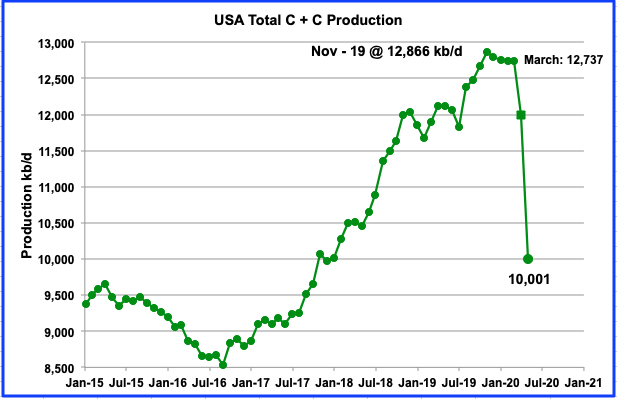
This US production chart is updated to April and tentatively extended to May and shows the continuous slow decline in oil output from US oil fields from November 2019 to March 2020 and then the sharp acceleration in April and May. Since the current EIA data is two months delayed, April is the first month that shows the combined effects of the pandemic and low oil prices.

Read More

US Oil Output Continues its Steady Decline

A post by Ovi at peakoilbarrel

All of the oil (C + C) production data for the US states comes from the EIAʼs Petroleum Supply Monthly (PSM). At the end, an analysis of three different EIA monthly reports is provided. The charts below are updated to March 2020 for the 10 largest US oil producing states, (Production > or close to 100 kb/d).

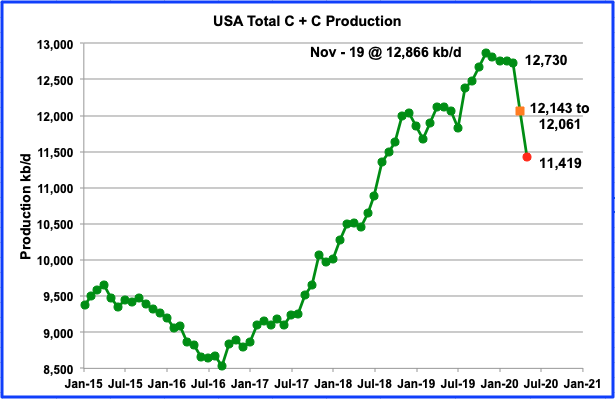
Today’s June 1 update shows the continuous slow decline in oil output from US oil fields from November 2019 to March 2020. March output was 12,716 kb/d, down by 28 kb/d from February’s 12,744 kb/d. Also it should be noted that February’s output estimate from the EIA’s earlier May report, 12,833 kb/d, has been revised to 12,744 kb/d, a downward revision of 89 kb/d. The Red dot is the projected April output from the May Monthly Energy Review.

Read More

US GoM 2019 Summary: Part II – Reserves

A Guest Post by George Kaplan

Introduction

BOEM produces an estimate of GoM reserves every year. This year’s covers estimates for then end of 2017. Nominally The figures given are 2P estimates but previous analysis has shown them to be extremely conservative, and they strictly follows SEC rules concerning reserves being bookable only if clear development plans are in place.

Backdated Reserves

These charts show reserve additions from discoveries by depth (all backdated to the original discovery year so that all adjustments due to improved extraction methods and better understanding of the reservoir etc. are included in the shoen reserve estimate), production and remaining reserves also by water depth.

The black dashes against each discovery show the original estimates of reserves. The shallow water estimates were very low and had significant upgrades, deep water not so much, and ultra-deep hardly at all. The reason for this is mainly the date of the discoveries: nominally it should be easier to apply seismic and drilling analysis from shallow water but the ultra-deep finds were made later and therefore have had better technology and seismic available when the original estimates were made; more on this later.

That said I do not know what method BOEM uses to make the estimates, it cannot be the ultra high fidelity models that the E&P companies use as they do not have the computer power, human resources or time to cover every field in the GoM.

Read More