US GoM 2019 Summary: Part II – Reserves

A Guest Post by George Kaplan

Introduction

BOEM produces an estimate of GoM reserves every year. This year’s covers estimates for then end of 2017. Nominally The figures given are 2P estimates but previous analysis has shown them to be extremely conservative, and they strictly follows SEC rules concerning reserves being bookable only if clear development plans are in place.

Backdated Reserves

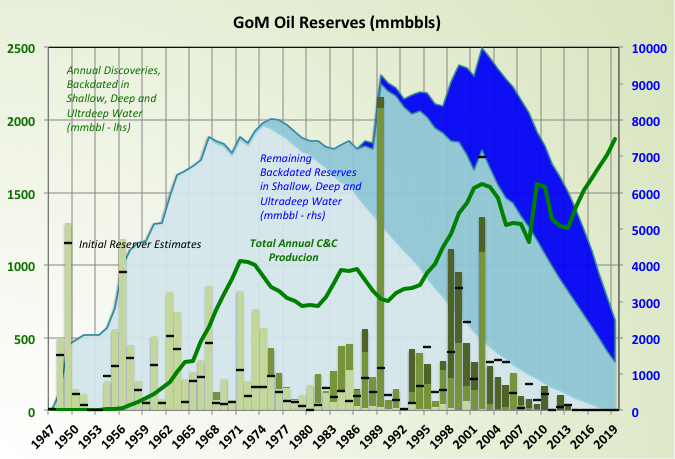
These charts show reserve additions from discoveries by depth (all backdated to the original discovery year so that all adjustments due to improved extraction methods and better understanding of the reservoir etc. are included in the shoen reserve estimate), production and remaining reserves also by water depth.

The black dashes against each discovery show the original estimates of reserves. The shallow water estimates were very low and had significant upgrades, deep water not so much, and ultra-deep hardly at all. The reason for this is mainly the date of the discoveries: nominally it should be easier to apply seismic and drilling analysis from shallow water but the ultra-deep finds were made later and therefore have had better technology and seismic available when the original estimates were made; more on this later.

That said I do not know what method BOEM uses to make the estimates, it cannot be the ultra high fidelity models that the E&P companies use as they do not have the computer power, human resources or time to cover every field in the GoM.
Read More

Is November 2019 the New US Peak Oil Date?

A post by Ovi at peakoilbarrel.

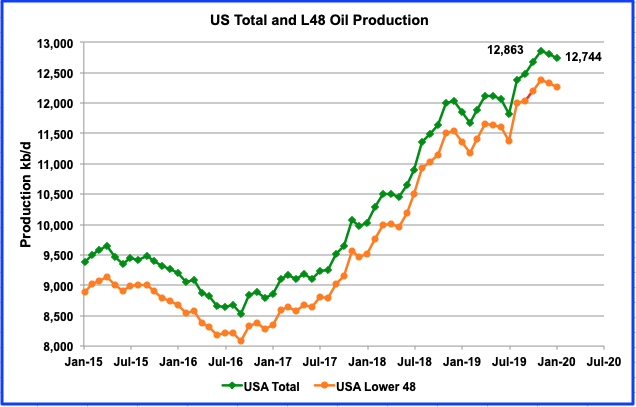
Here I am again reporting on out of date US February oil production from the EIA April report after the world oil environment has been turned on its head. Fortunately the EIA also has some forward looking reports that make use of more current data to provide projections for a few months out. Also the EIA has a guesstimate for weekly oil output which certainly provides an indication of the direction of production over the next month. Also there are reports on rig counts that indicate activity in oil basins and provide clues on where oil output is going. Down, Down, Down.

Read More

US January Production Drops Again

A post by Ovi at peakoilbarrel

Preparing this March post has been a surrealistic exercise. Here I am providing a January US production update when at a time, January, the world had no clue that it was going to be hit with a double Black Swan event in early March . There was a hint in January on the coming pandemic for those who were listening. However, there was no clue of the Shock and Awe attack that would be launched by SA after Putin and his Oily Oligarch friend Sechin made the wrong move in the world’s Oil Chess Game. Russia thought that they had SA in Check, instead Russia and the rest of world were End Played. Now, a way must be found out of this mess. Reports are circulating that Trump and Putin have been talking and that an OPEC + meeting will be convened shortly. Let’s hope adult’s come to the table.

The silver lining, if there is one, is that the world will need lower oil prices to come out of the current economic slowdown. The question is, if an agreement can be brokered between US, Russia and OPEC, “What will be the right price for oil for both the producers and the economy?

The irony here is that Trump will be holding meetings with oil company executives shortly to see how the US can help. In the meantime the NOPEC (No Oil Producing and Exporting Cartels Act) bill keeps circulating within Congress. Interesting how the world, US positions and thinking, can be flipped upside down over night.

Read More

USA December Oil Production Drops

A Post by Ovi at peakoilbarrel

All of the oil production data for the US states comes from the EIAʼs Petroleum Supply Monthly.   At the end, an analysis of a three different EIA reports is provided.

The charts below are updated to December 2019 for the 10 largest US oil producing states (Production > 100 kb/d).

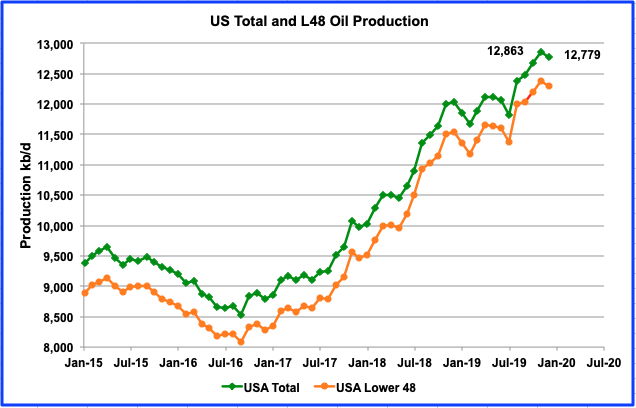
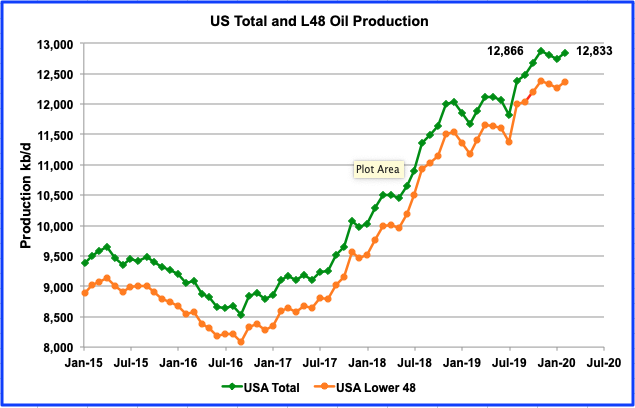
The data from the February EIA report shows that US production dropped from November by 84 kb/d (0.61 kb/d) to 12,779 kb/d in December. Since June, the US has increased output by an average of 164 kb/d/mth. Is this drop the beginnings of slowing LTO growth going into 2020? Today’s low oil prices are not providing any incentive to increase drilling activity. Maintaining current production and lowering expenses may be the new mantra.

For the lower 48 states, production decreased by 81 kb/d.

Read More

USA Oil Production by State Updated to August 2019

All data for this post is from the EIA’s Petroleum Supply Monthly

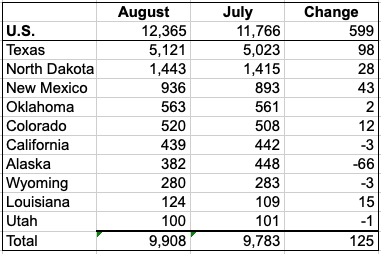
The charts below are primarily for the largest US oil producing states (>100 kb/d) and are updated to August 2019.  If you are interested in additional states, let it be known.

Ron has asked if I would take over the monthly posts for USA oil production.  I have tentatively agreed to do that.  Let us all thank Ron for his work at tracking US production and for his insights.  Ron will continue to monitor what’s happening with US production and provide his comments. He is not going away.

This is my first post on US production by state. If you spot any errors, please let me know and I will try to fix them.

Read More