GOM Drop Drops US April Oil Production

A guest post by Ovi

All of the Crude plus Condensate (C + C) production data for the US state charts comes from the EIAʼs Petroleum Supply monthly PSM which provides updated information up to April 2023.
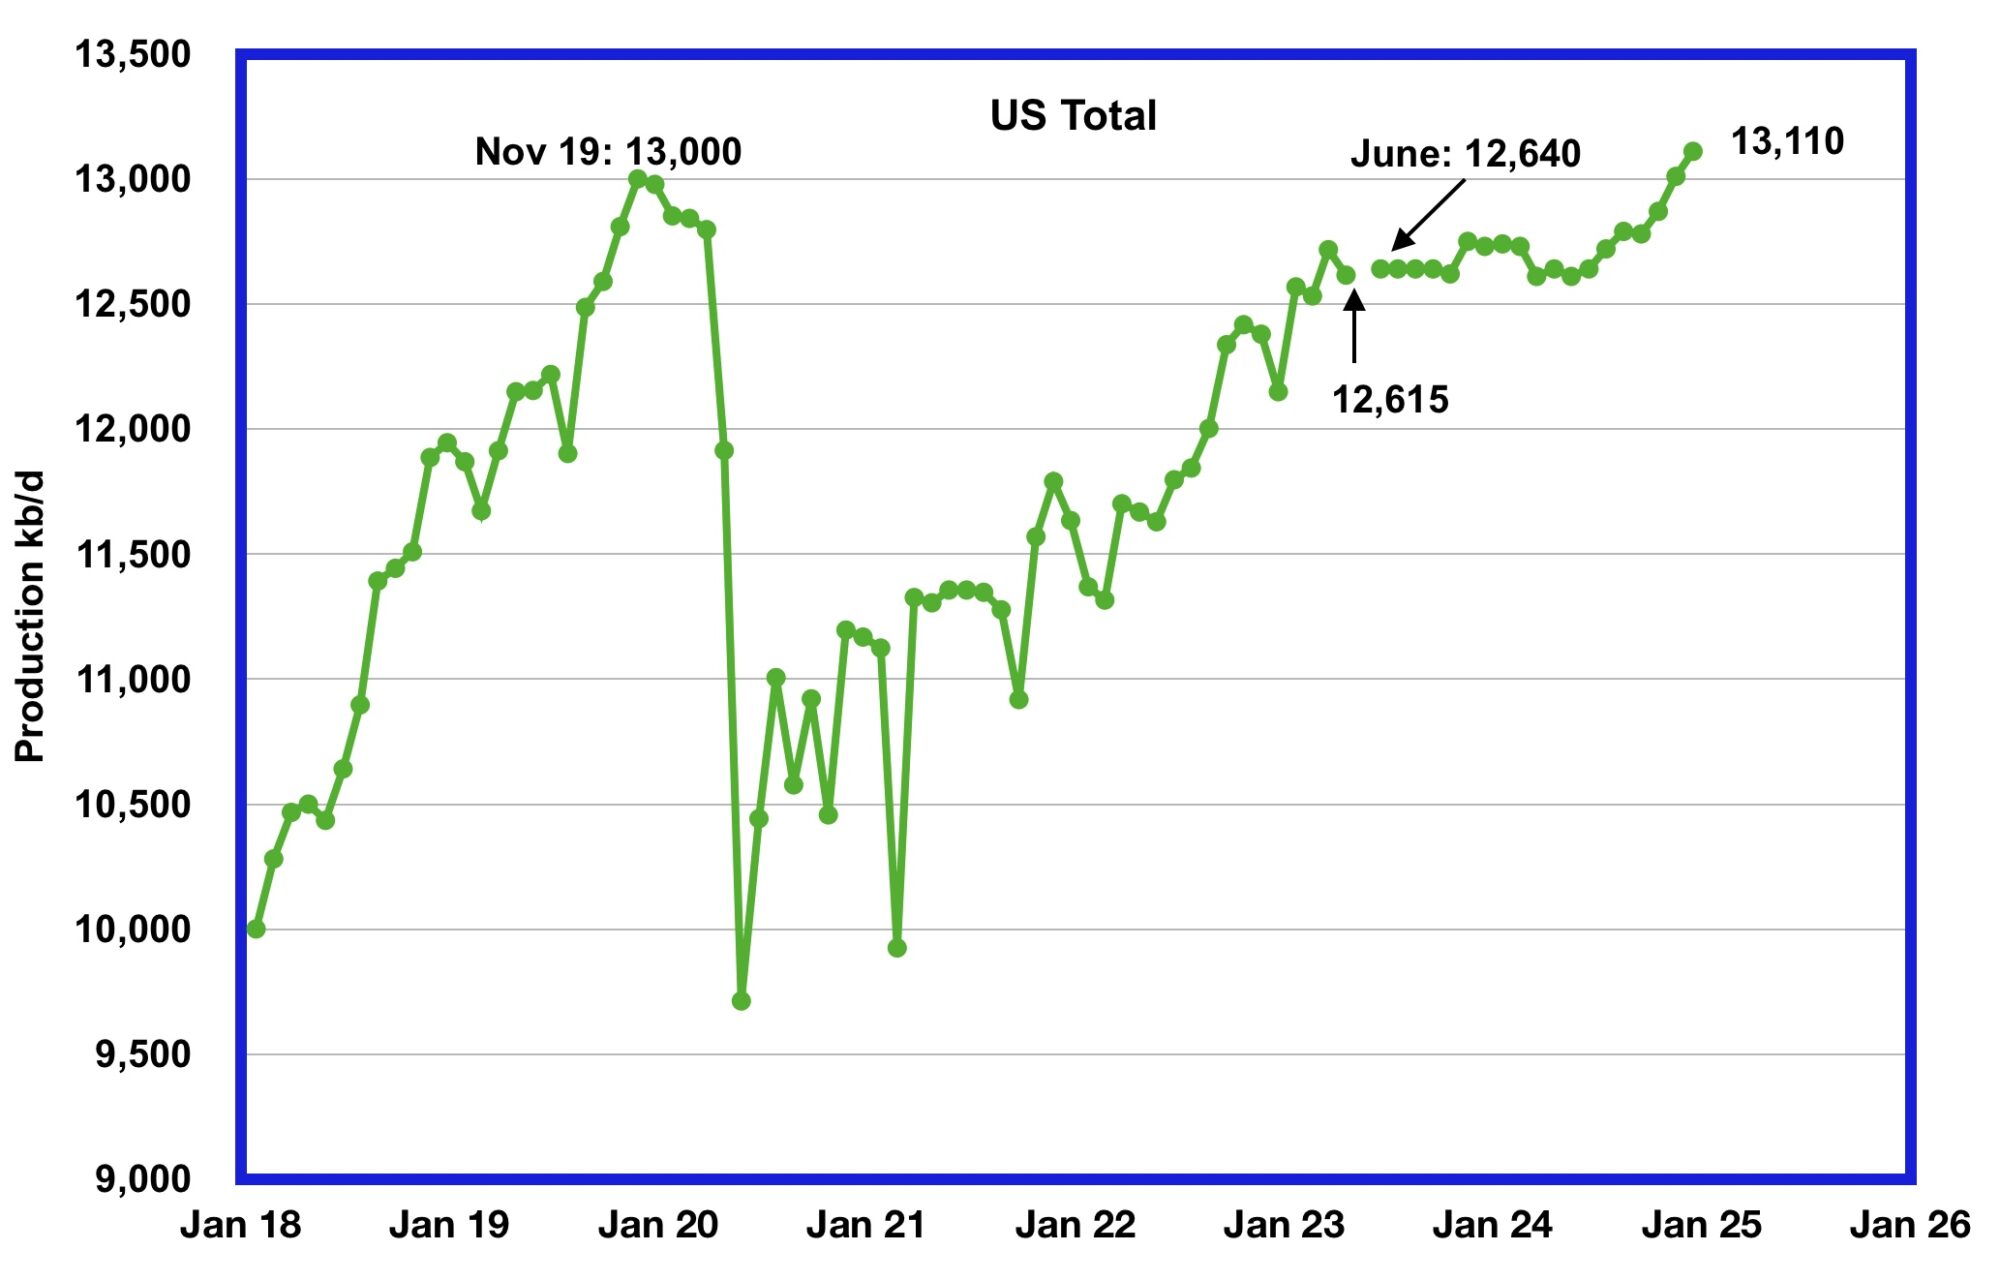
U.S. April oil production decreased by 102 kb/d to 12,615 kb/d, a drop from last month’s post pandemic high of 12,717 kb/d. Note that March’s output was revised up by 21 kb/d from 12,696 to 12,717 kb/d.

Read More
US March Oil Production at Post-Pandemic High

A guest post by Ovi

All of the Crude plus Condensate (C + C) production data for the US state charts comes from the EIAʼs Petroleum Supply monthly PSM which provides updated information up to March 2023.

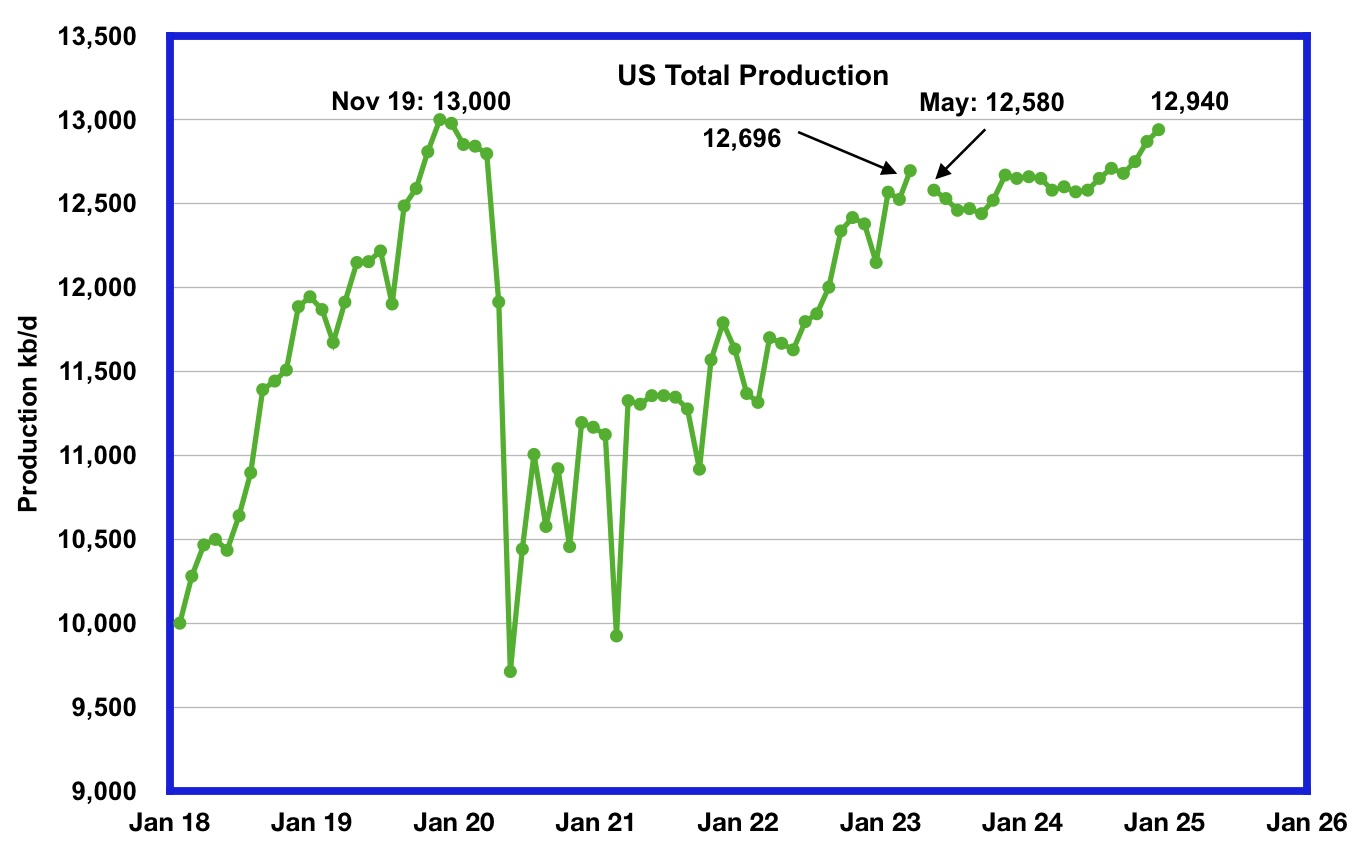
U.S. March oil production increased by 171 kb/d to 12,696 kb/d, a new post pandemic high. Note that February’s output was also revised up by 42 kb/d from 12,483 to 12,525 kb/d. So relative to the initial EIA February report, production is up by 213 kb/d.

The EIA’s forecast production drop that starts in May 2023 could be associated with the drop in completions that started in early May combined with a projected drop in GOM production.

Read More

January Non-OPEC Oil Production Drops

A guest post by Ovi

Below are a number of Crude plus Condensate (C + C) production charts, usually shortened to “oil”, for Non-OPEC countries. The charts are created from data provided by the EIA’s International Energy Statistics and are updated to January 2023. This is the latest and most detailed world oil production information available. Information from other sources such as OPEC, the STEO and country specific sites such as Russia, Brazil, Norway and China is used to provide a short term outlook for future output and direction for a few of these countries and the world. The US report has an expanded view beyond production by adding rig and frac spread charts.

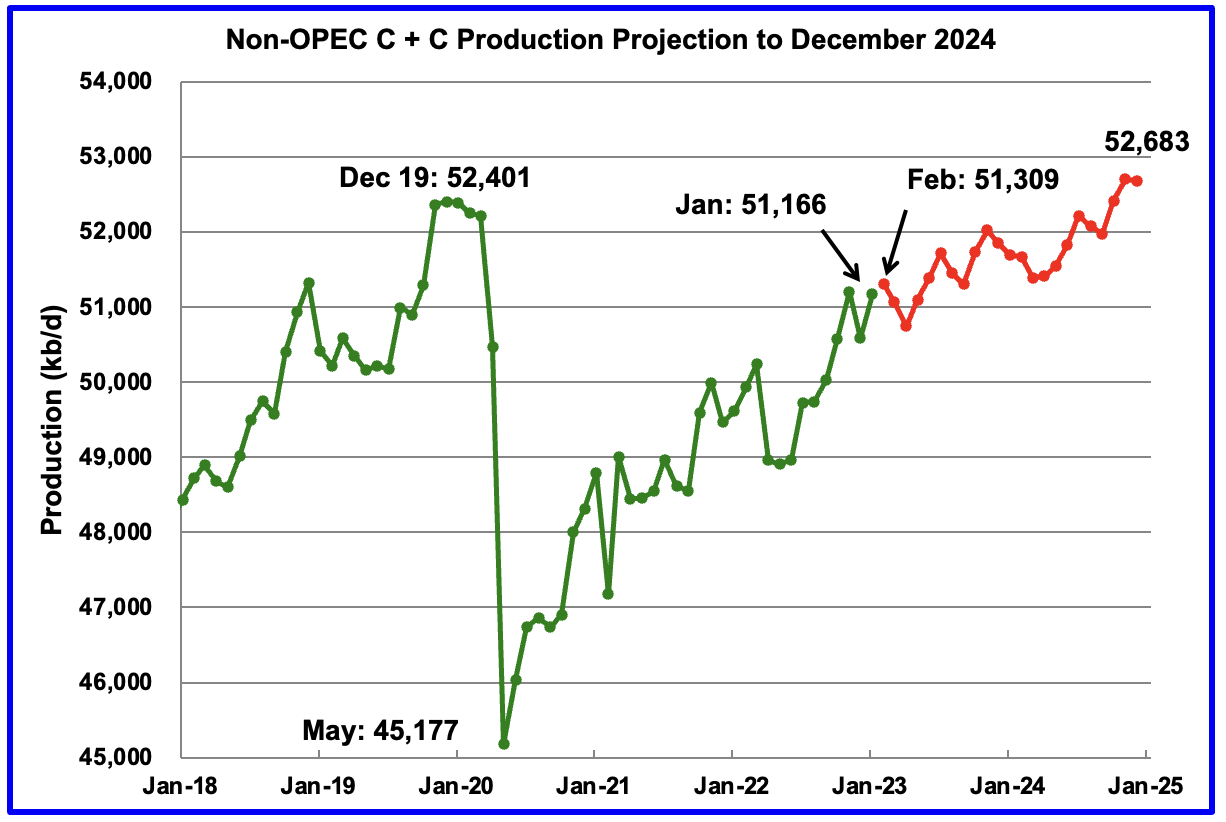
January Non-OPEC oil production increased by 583 kb/d to 51,166 kb/d. The largest increase came from the US, 347 kb/d.

Read More