May Non-OPEC and World Oil Production

By Ovi

Below are a number of Crude plus Condensate (C + C) production charts, usually shortened to “oil”, for Non-OPEC countries. The charts are created from data provided by the EIA’s International Energy Statistics and are updated to May 2023. This is the latest and most detailed world oil production information available. Information from other sources such as OPEC, the STEO and country specific sites such as Russia, Brazil, Norway and China is used to provide a short term outlook for future output and direction for a few of these countries and the world. The US report has an expanded view beyond production by adding rig and frac spread charts.

Where STEO data was used, the ratio of C + C to All Liquids was calculated. The average for the last eight months was used to project the June and July production numbers in a few cases.

World oil production and projection charts are presented at the end of this post.

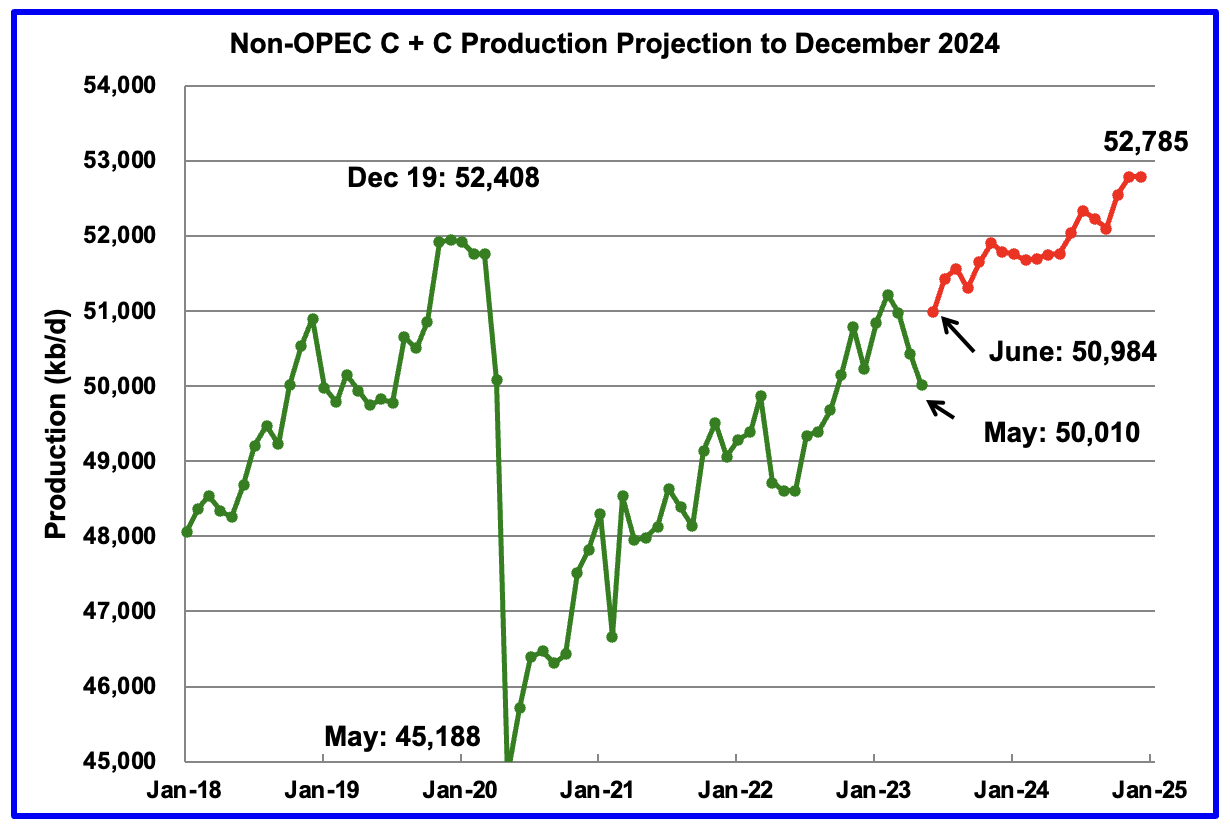
May Non-OPEC oil production dropped by 412 kb/d to 50,010 kb/d. The largest decreases came from Canada 118 kb/d and Russia 193 kb/d.

Read More

April Non-OPEC and World Oil Production Drops

By Ovi

Below are a number of Crude plus Condensate (C + C) production charts, usually shortened to “oil”, for Non-OPEC countries. The charts are created from data provided by the EIA’s International Energy Statistics and are updated to April 2023. This is the latest and most detailed world oil production information available. Information from other sources such as OPEC, the STEO and country specific sites such as Russia, Brazil, Norway and China is used to provide a short term outlook for future output and direction for a few of these countries and the world. The US report has an expanded view beyond production by adding rig and frac spread charts.

Where STEO data was used, the ratio of C + C to All Liquids was calculated. The average for the last six months was used to project the May and June production numbers in a few cases.

World oil production and projection charts are presented at the end of this post.

April Non-OPEC oil production dropped by 407 kb/d to 51,049 kb/d. The largest decreases came from Canada, US and Russia.

Using data from the August 2023 STEO, a projection for Non-OPEC oil output was made for the period May 2023 to December 2024. (Red graph).  Output is expected to reach 53,195 kb/d in December 2024, which is 787 kb/d higher than the December 2019 peak of 52,408 kb/d.

Read More