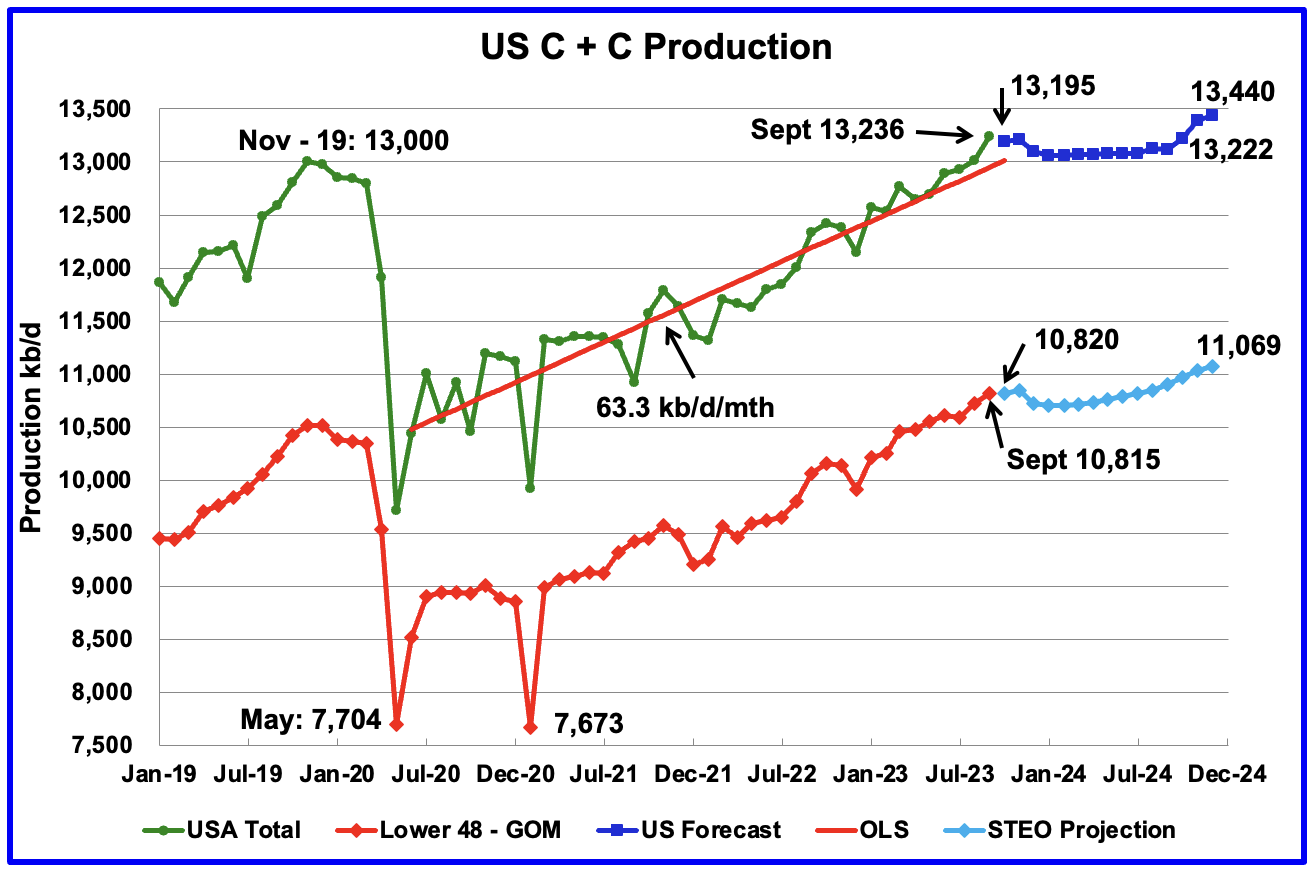
All of the Crude plus Condensate (C + C) production data for the US state charts comes from the EIAʼs Petroleum Supply monthly PSM which provides updated information up to September 2023.
U.S. September oil production increased by 224 kb/d to 13,236kb/d, a new record high by 236 kb/d over November 2019. The increase was primarily due to increases in the GOM and North Dakota. Note that August production was revised down from 13,053 kb/d to 13,012 kb/d, which accounts for 41 kb/d of the 224 kb/d September increase.
The EIA continues to have problems with updating its World oil production website. Consequently, this month’s report is again a shorter version of previous posts because the EIA’s International Energy Statistics update for June and July is not available. Information from other sources such as OPEC, the STEO and country specific sites such as Brazil, Norway and China are used to provide a short term outlook for future output and direction for a few of these countries and the world.
Where STEO data was used, the ratio of C + C to All Liquids was calculated. The average for the last six months up to May was used to project June and July production and in a few cases August production.
World oil production and projection charts are presented at the end of this post.
The current May International Energy Statistics has been updated to correct for the missing condensate production in the previous Russian file and is used for this report.
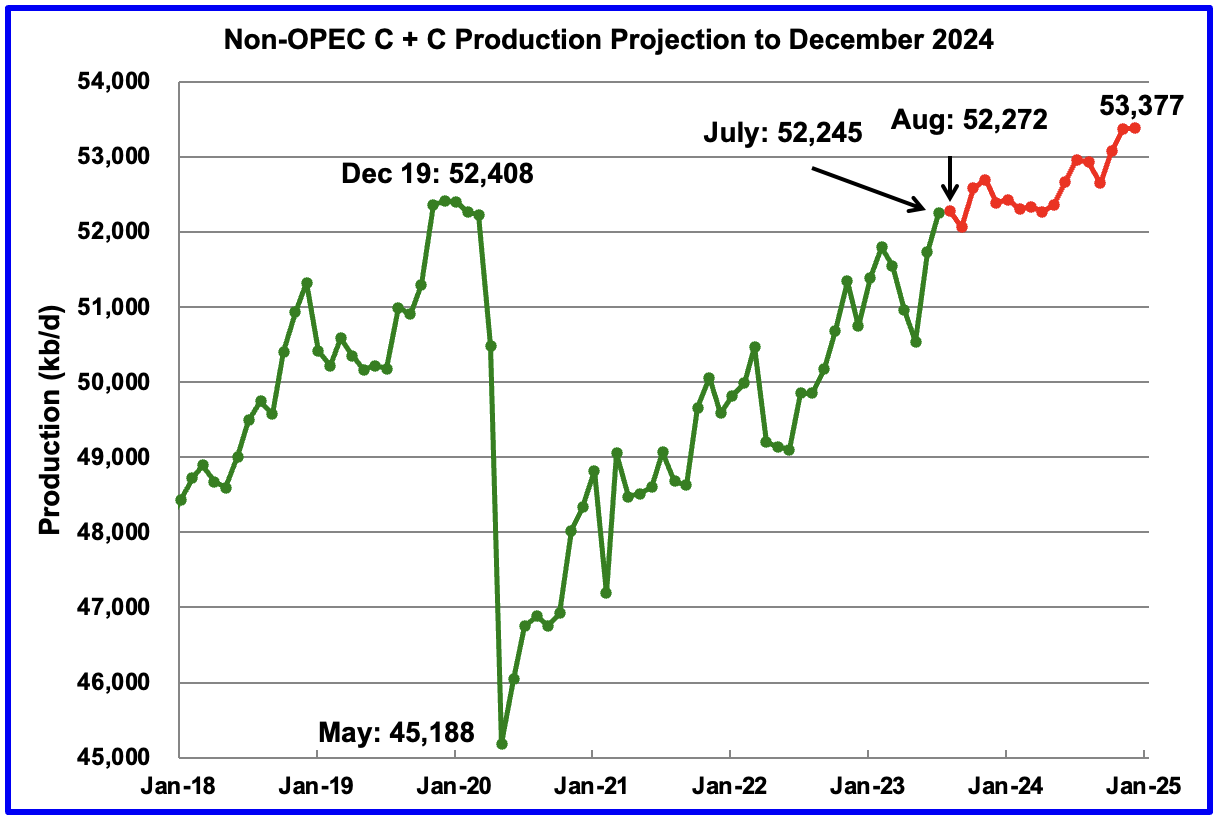
July Non-OPEC oil production increased by 520 kb/d to 52,245 kb/d and is up 1,706 kb/d from May. Close to 500 kb/d of the June increase is related to the EIA’s condensate correction for Russia in the EIA’s updated May International Energy Statistics. In the previous EIA May report, Russian condensate was not included in Russian production.
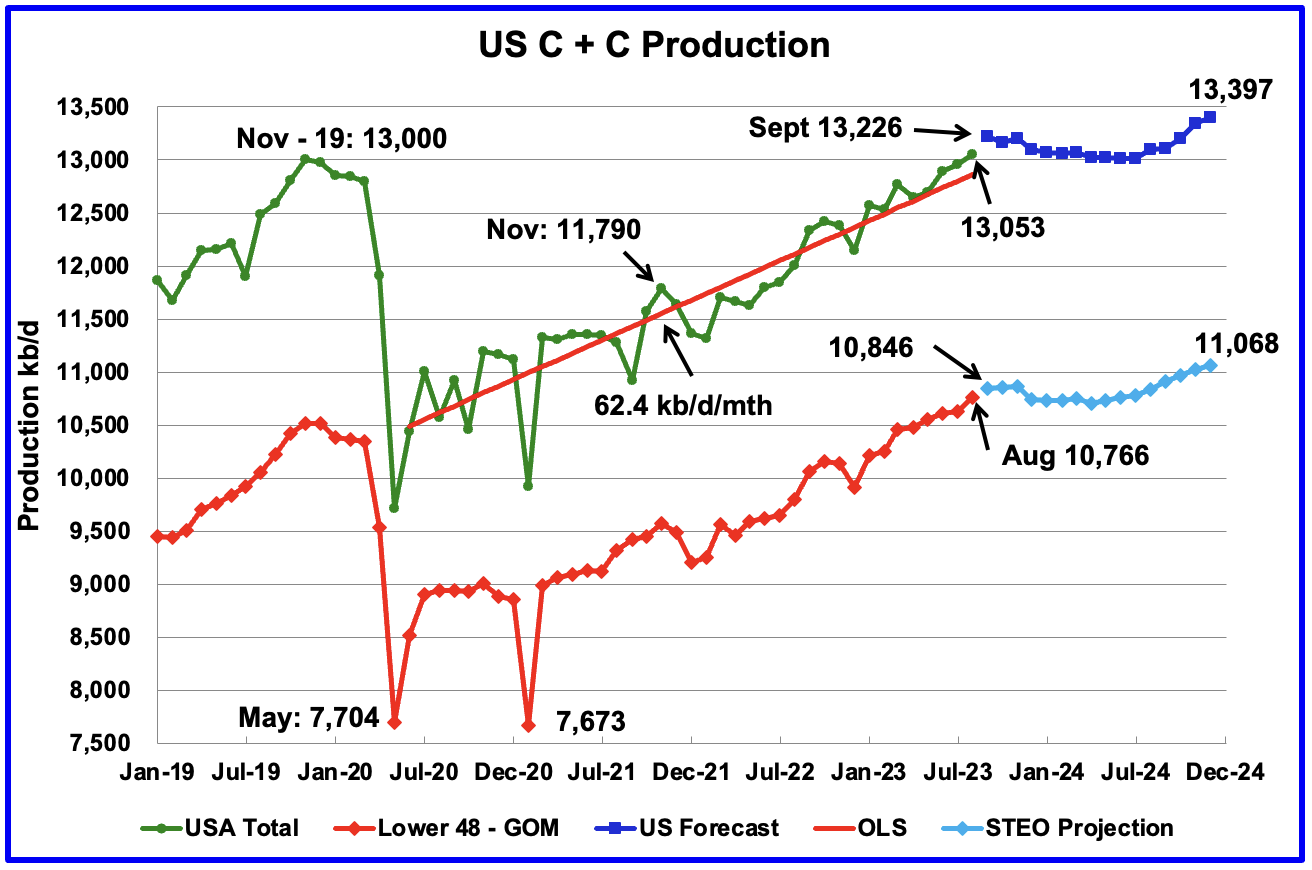
All of the Crude plus Condensate (C + C) production data for the US state charts comes from the EIAʼs Petroleum Supply monthly PSM which provides updated information up to August 2023.
U.S. August oil production increased by 94 kb/d to 13,053kb/d, a new record high by 53 kb/d over November 2019. The increase was primarily due to increases in Texas, New Mexico and North Dakota. Note that July production was revised down from 12,991 kb/d to 12,959 kb/d, which accounts for 32 kb/d of the 94 kb/d August increase.