Recent Production: Colombia, Mexico and Brazil

A Guest Post by George Kaplan

Colombia

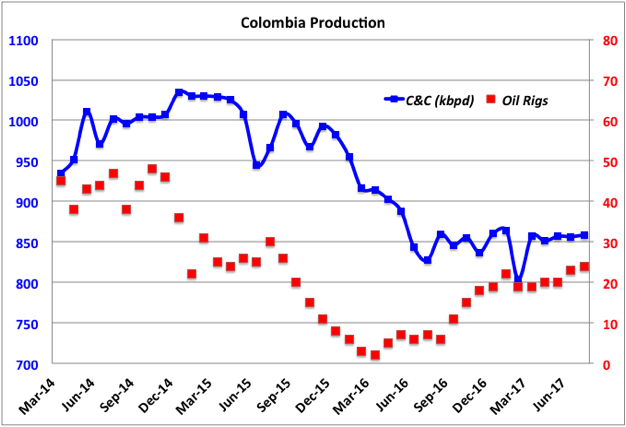
Colombia production is holding a plateau over the past year after a large decline in the last part of 2015 and first half of 2016. August value was 858 kbpd (down 0.04% y-o-y).
chart/

Colombia oil reserves at the end of 2016 were 1.66 Gb (down 16.8% from 2 Gb in 2015 which followed a drop from 2.31 Gb in 2014). At the average 2016 production rate of 885 kbpd this gave an R/P of 5.1 years, the lowest for any significant producing country. Most of their production is heavy oil. Ecoptrol, which accounts for more than three quarters of Colombia’s crude and natural gas reserves and output, estimated about 45% of their decline was due to the “pronounced fall in oil prices”. Read More
GoM June Production Update

A Guest Post by George Kaplan

Production

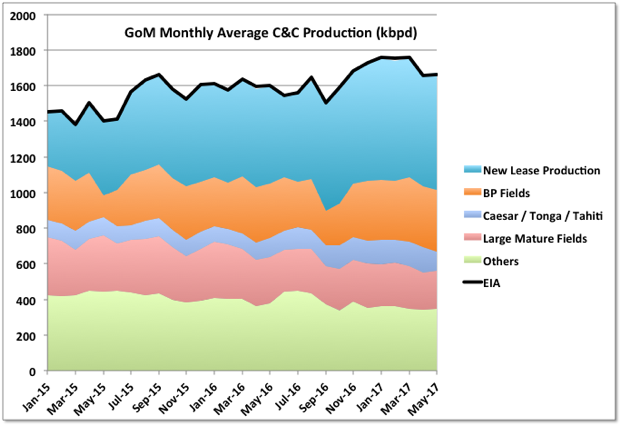
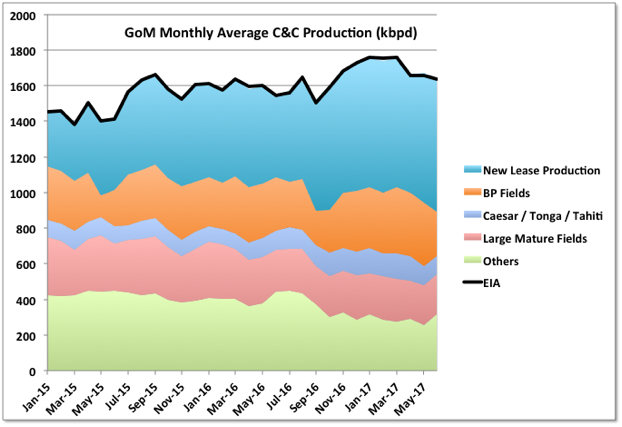
Production for June by BOEM was 1631 kbpd and by EIA 1636, compared with 1673 and 1659 kbpd, respectively, in May. The decline was mostly from Thunder Horse going offline and Constitution staying offline. Hurricane Cindy didn’t seem to have much of an impact, things will be different for the impact of Harvey on August figures.

Even with the two offline facilities coming back July numbers will struggle to beat those for March, and after that the depletion declines and hurricane disruptions take over. Note that the “others” area includes any assumptions BOEM has made to allow for missing data, which is quite a lot this month.

chart/

Read More

Norway Oil and Gas: Reserves, Production and Future Projection

A guest post by George Kaplan

Norwegian oil production peaked in 2000 to 2001; gas production may be peaking about now. Oil hit a low in 2013 and then recovered towards a new local peak, probably concurrent with the gas.

Drilling and Development

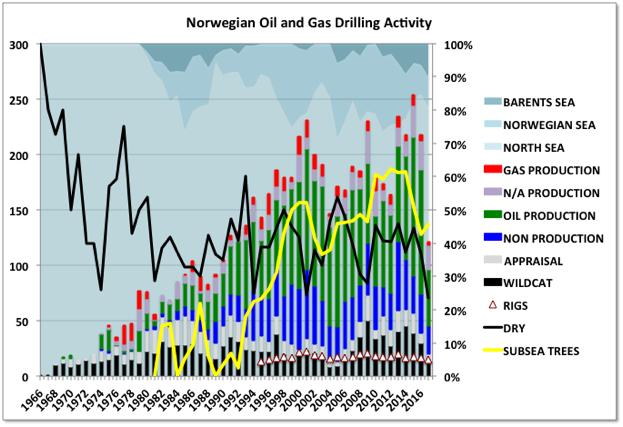
The most surprising thing I find with their industry is that the drop in oil price made almost no difference the drilling activity shown here (all data here and below taken from the NPD – Norwegian Petroleum Directorate – which provides more data than just about any other such organisation).

chart/

The chart shows numbers of wells drilled, as stacked bars, and number of operating rigs (unstacked) against the left hand axis, other curves are ratios of total against the right axis. Read More

UK Oil Production, Reserves and Future Projection

A Guest Post by George Kaplan

Production History and Reserves

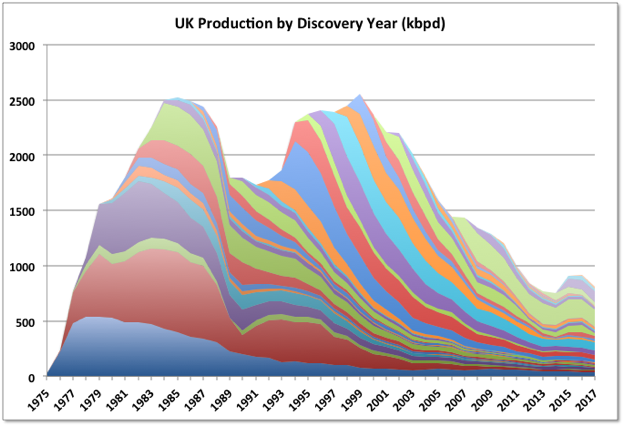
UK oil production peaked in 1999. The peak was probably pushed out a couple of years because of the major production interruptions following the Piper Alpha disaster. Production declined quickly until around 2011, then the high oil price allowed more brownfield and then greenfield developments that created a third local peak in 2016. Production is declining again this year but there are several large projects due that will create another peak in 2018 or 2019 (nearly equal to the 2016 one). After that terminal decline is likely. The chart below shows C&C production split according to the year of first production of the field.

chart/

Like all such all diagrams, this shows that the largest fields were developed first and declined the slowest. Read More