GoM Reserves and Production Update, 1H2018

A Guest Post by George Kaplan

Crude and Condensate Reserves
chart/

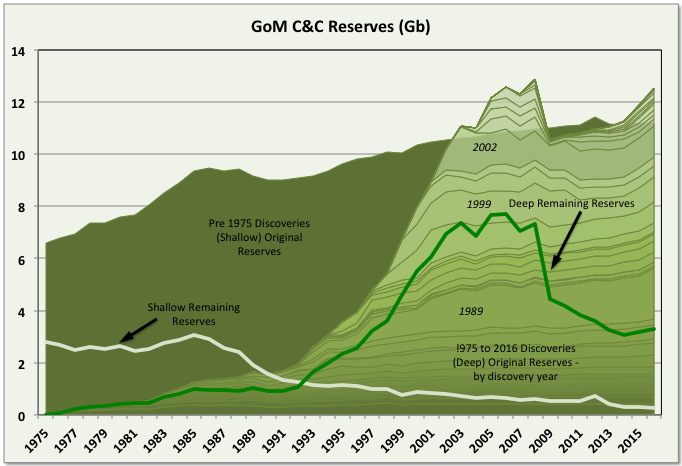
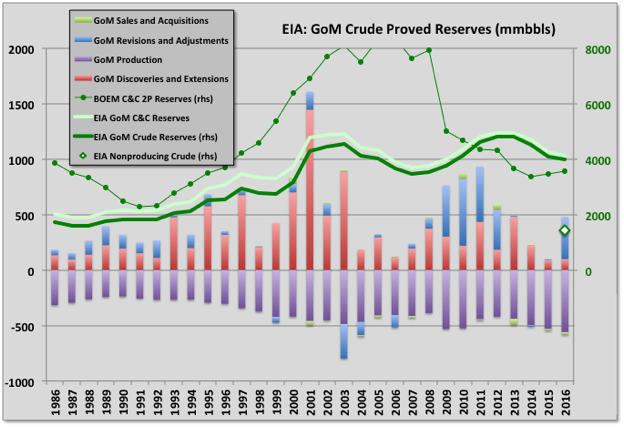
BOEM remaining C&C reserve estimates for GoM increased by 649 mmbbls for 2016 (i.e. to 31st December 2016). This was 112% reserve replacement and followed a similar growth of 618 mmbbls (111% reserve replacement) for 2015. The BOEM reserve calculation method appears to give highly conservative estimates. The increasing reserves followed several years, from 2006, of less than 100% reserve replacement, and actually negative numbers in 2006 and 2008. Current total original reserves (i.e. ultimate recovery) are a new high beating 2006 values, though deep water numbers are still below that year with the main growth appearing to be coming from: 1) older fields that were downgraded because of changes in SPE rules in 2007 (i.e. that reserves could only be booked if there were clear plans for their development within five years); and 2) newer discoveries, mostly smaller fields that are developed through tie-backs to existing hubs. These newer fields often do not get shown as new discoveries because BOEM records production and reserves against leases and each lease is recorded against a single field, even if there are deposits of different depth, age, geology and significant spacial separation within in it.

Current oil reserves are 3.569 Gb, which is 15% of the estimated original reserve (aka ultimate recovery). BOEM give the reserves as 2P (i.e. proven and probable) but they look very conservative and are actually lower than the EIA numbers, shown below, given for proven only and based on the operators own numbers, although the two are converging. The historical reserve histories look closer to how 1P (proven) numbers often appear, for example with some fields maintaining near constant R/P numbers, some showing large early drops that then come back over time, and some numbers being suspiciously low on fields obviously not near run out production rates (e.g. Mad Dog and Son of Bluto 2). I think the reserve calculations methods are fairly basic, given the amount of work required they couldn’t be much else, and use volumetric methods (i.e. reservoir area, depth, porosity, recovery factor) and previous decline data (I don’t now if the operators give them additional data such as well pressures).
chart/

Reserve Evolution History

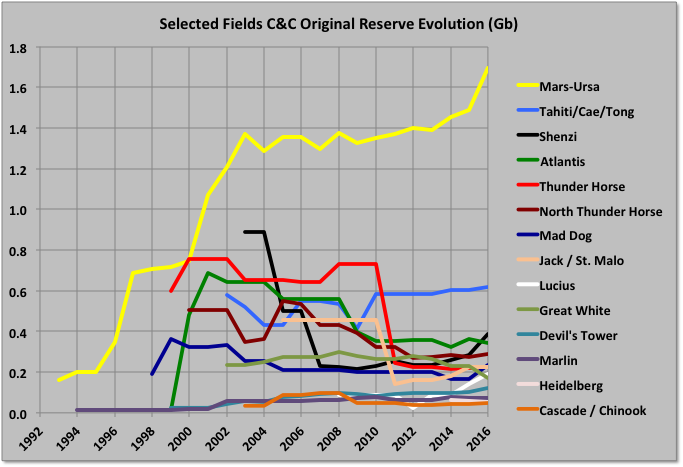
The Mars-Ursa fields have big original reserves, which have shown continuous growth. Other, large deep-water fields have mostly shown negative revisions from original reserve estimates, some quite large, though some of that is due to development timing (e.g. Mad Dog II reserves, when added, will likely recover all the earlier drop, and more). Shenzi has grown recently, and Atlantis will next year, both from new near field discoveries.
chart/
Read More

Mexico Production and Reserves, 1H2018

A Guest Post by George Kaplan

Mexico C&C Production

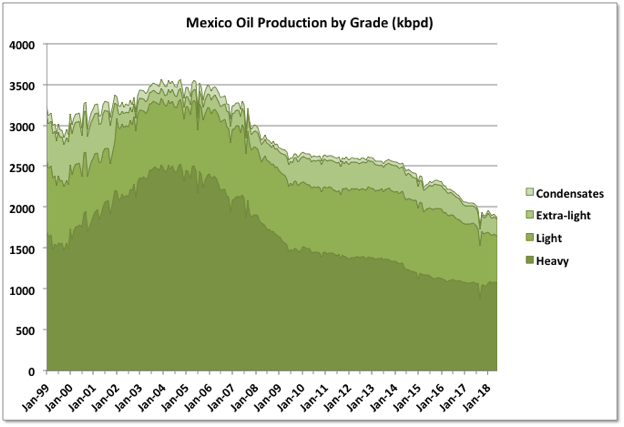
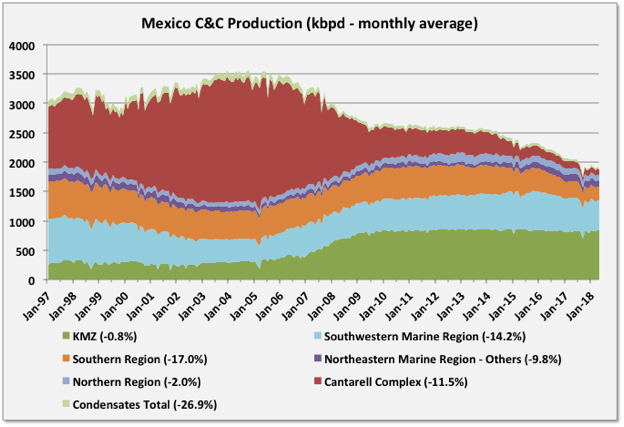
Mexico oil production is in decline though, at the moment, not as steep as it was expected to be (at least by me – IEA predictions are closer).

Data is through June and comes from Pemex and National Hydrocarbons Information Center (CNIH) (both sites are pretty good).

For June C&C was 1870 kbpd, down 25 kbpd from May and 170 kbpd y-o-y. Yearly decline rates for each region are shown in the chart below. Production peaked in 2004/2005 at just over 3500 kbpd, so overall decline is approaching 50%.

chart/

Most of the decline has been in light oil and condensate, with heavy oil holding fairly level.

chart/
Read More

UK Offshore Production: Summary for First Quarter 2018

A Guest Post by George Kaplan

UK C&C

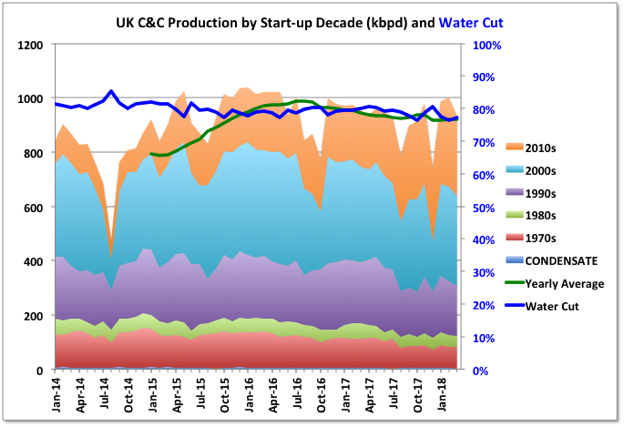
It was expected by many, me included but more importantly UKOGA and a couple of the bigger oil and gas consultancies, that UK offshore oil production would increase significantly from 2017 to exceed 1000 kbpd for the yearly average in 2018. So far this is proving a bit of a challenge. March production was 934 kbpd, down 7% m-o-m and 2% y-o-y (but up 0.8% for the first quarter compared with 2017). It’s possible that some fields have not reported but those showing zero for the month are not big producers. The biggest single field drop came from Clair but most fields saw declines, even the newer ones. Jodi data indicates there will be a rise shown for April to slightly above 1000 kbpd and then a fall back to around March numbers in May (note edit based on July Jodi data); there is usually a summer dip because of maintenance shutdowns (plus this year some strikes at Total platforms will impact).

chart/

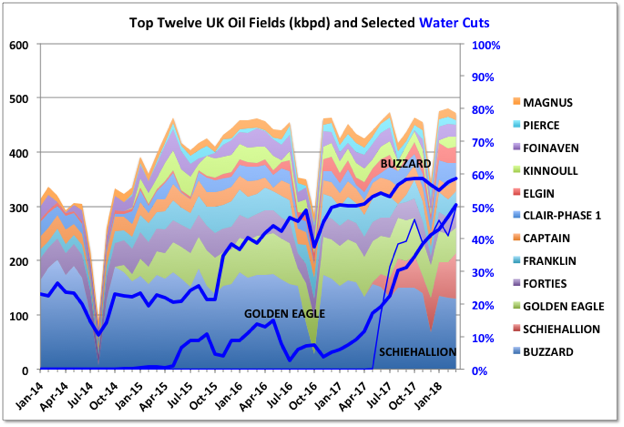
Two of the largest oil producers, Buzzard and the Golden Eagle Area Development, both operated by Nexen, have started accelerated decline following increasing water breakthrough (especially noticeable in GEAD over the past year). The newest large field is Scheihallion. This is a redevelopment with its neighbouring field, Loyal, through the Glen Lyon FPSO (also called the Quad 204 project), which was started last year. So far the combined decline in Buzzard and GEAD is almost matching growth in Scheihallion.

The Clair Ridge platforms, which will also exploit the remaining heavy oil in the Clair field, were installed last year but there have been multiple delays and production is not now expected until later this year. Once it is ramped up, which could take three or four years despite it having some predrilled wells, the project will be the largest producer at 100 to 120 mmbpd and has an eight year plateau, while Scheihallion/Loyal will plateau and decline quickly.

chart/
Read More

GoM: First Quarter 2018, Production Summary

A Guest Post by George Kaplan

Crude and Condensate

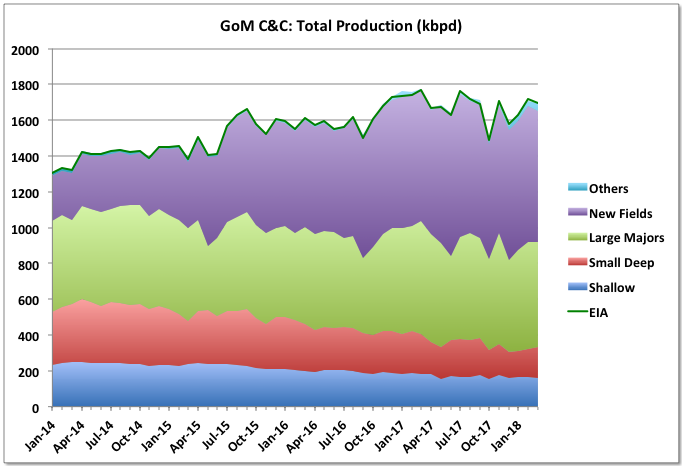
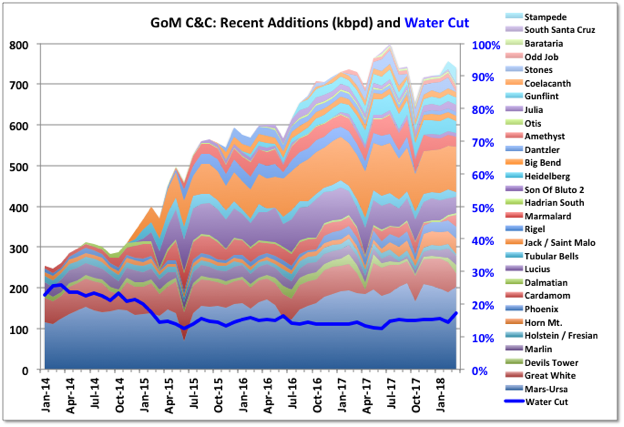
BOEM has March 2018 production at 1696 kbpd, which is down 1% month-on-month and 4% year-on-year (March 2017 was the peak production month for GoM so far). EIA numbers were very similar, although last month’s were higher and haven’t been revised yet – typically EIA numbers end up almost exactly corresponding to the BOEM reported total qualified lease production, whereas BOEM can be a little higher, maybe including test wells or non-qualified leases.

chart/

The major new project, Stampede, started in January, has no reported production numbers yet. BOEM and EIA estimate non-reported values and then retrospectively adjust their reports when actual numbers are available. I don’t know how they estimate new production but Stampede could produce around 60 kbpd with current plans, though likely a lot less initially as only one of two leases has been ramping up. I’ve assumed 20 and 40 kbpd for February and March respectively, which still might be high. Even allowing for that, and assuming other late numbers are the same as the previous month, since December EIA and BOEM both have estimates about 30 to 40 kbpd higher than the reported lease and well production numbers (which always match closely) would suggest. Usually the difference is no more than ten. It is unlikely that the other late numbers, of which there are few, and none for all four months, will show such large, sudden and unexplained increases so either I’m missing something (maybe a lease not yet included in the numbers, but also not reported as starting up) or there could be some future downward adjustments.

Rigel and Otis are still off-line following the failure at a subsea manifold last October and are taking out about 22 kbpd plus some gas (Otis is a small gas field). Great White, Stones (for the full month) and Caesar/Tonga all had noticeable downtime in March taking about 90 kbpd off-stream.

chart/
Read More

Norway Production, 2017 Summary and Projections

A Guest Post by George Kaplan

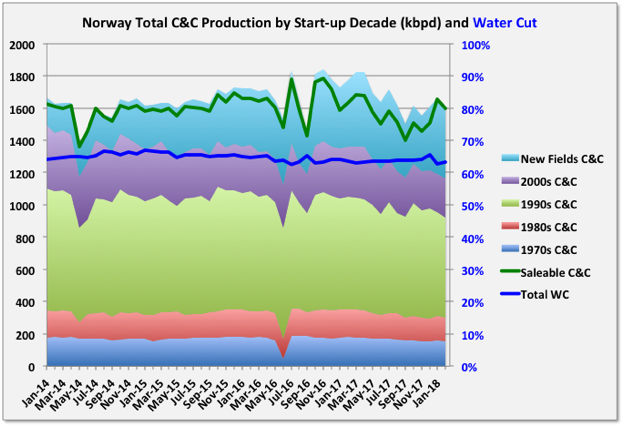
Average annual Norwegian wellhead C&C production dropped 1.5% in 2017, from 1709 kbpd (625 mmbbls total) to 1682 kbpd (614 mmbbls total). Wellhead gas (which includes fuel gas, flaring and gas injection) rose 2.6% from 2805 kboed to 2878 kboed. Exit rates were down 9% for oil andt 4% for gas, some of which was due to the Forties pipeline failure in December, but the decline appears to have continued in the first quarter of 2018.

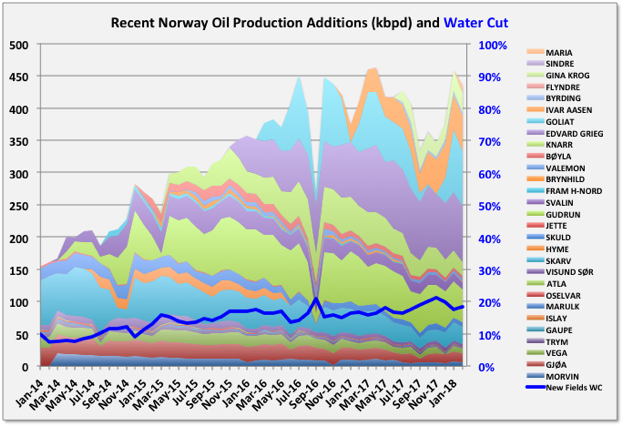
Three small projects, Flyndre, Sindre and Birding, and two larger ones Gina Krog and Maria, came online. Sindre appears already to be exhausted. Flyndre is shared with UK and is declining fast. Gina Krog, discovered in 1974, is a tie back via a wellhead platform to Sleipner with nominal nameplate capacity of 60 kboed (split about evenly between oil and gas), and Maria is an oil tie-back to the Kristin semi-sub, but with water injection supplied from Heidrun, with 40 kbpd nameplate and is still ramping up after first production in December.

Norway C&C

The data shown in the charts is through February, but the NPD figures for this year have not been as complete or unequivocal as usual, so should be considered accordingly. A number of fields have no reported wellhead figures for January or February, though they do have sales reported (to fill the gaps I have prorated from these numbers based on previous complete monthly data). Additionally it looks for some reason that the sales figures for 2017 have all been doubled and the numbers for NGL are being switched from reporting in Te/d to m3/d, so there’s a bit of uncertainty.

chart/

Troll

Troll, started in 1990, is by far the largest gas producer but also, currently, the largest oil producer, at around 150 kbpd, which has been kept steady for several years. The oil comes from a thin oil rim, produced from long, horizontal wells that are being continually drilled. The oil has to be produced before the gas cap can be blown down. R/P for the oil is about two and a half years, and the contract for Troll Phase 3, the gas reserves over the oil rim, was awarded this January with production expected in the second half of 2021. This would suggest the oil production will be kept high, and then start to drop quickly through 2020. Troll gas current reserves are almost half depleted and with an R/P of over twenty years, but the approved production rate has recently been increased to make up for declines in other fields, and this may continue.

The original development plan by Shell for Troll was to ignore the oil as they did not think it could be developed economically, mainly because it would have required hundreds of vertical wells; this was rejected by the Norwegian Petroleum Directorate. Short horizontal wells had previously been drilled in USSR (actually in the 1930s), Australia and Alaska but in the late 1980s extensive, and expensive, development for long reach, accurately placed horizontals, drilled from offshore floating rigs, was conducted by Norsk Hydro with NPD input. In the early 90s I remember Norwegian news outlets complaining that they perceived this as a waste of tax-payers money, but the effort has certainly paid off since. A similar large oil rim resource, Frigg, was not produced in an earlier gas development and was lost; by contrast Troll Oil will produce almost two billion barrels.

Statfjord

Statfjord, started in 1979, is still a large producer, at about 25 kbpd, many years after its original decommissioning date, although there are signs now of decline, which is likely to be terminal. It straddles the UK-Norway border and about 15% is owned by the UK through the local Statoil subsidiary. Interestingly at one time, by maritime law, the UK could have claimed all of the Norwegian Trench, which includes Statfjord and several other of the largest Norwegian fields, but instead agreed to a border based on the meridian line between the two countries. I think the UK oil and gas authority had been reporting UK Statfjord production as total rather than the UK share, maybe by wishful thinking, which has skewed some numbers and has only been corrected in the last few months.

chart/

The irregularity in Goliat production shows up in the curves for recent additions, but there is a clear trend for quite early and rapid decline, even among the larger developments.
Read More