By Ovi
All of the Crude plus Condensate (C + C) production data, oil, for the US state charts comes from the EIAʼs Petroleum Supply monthly PSM which provides updated information up to April 2023.
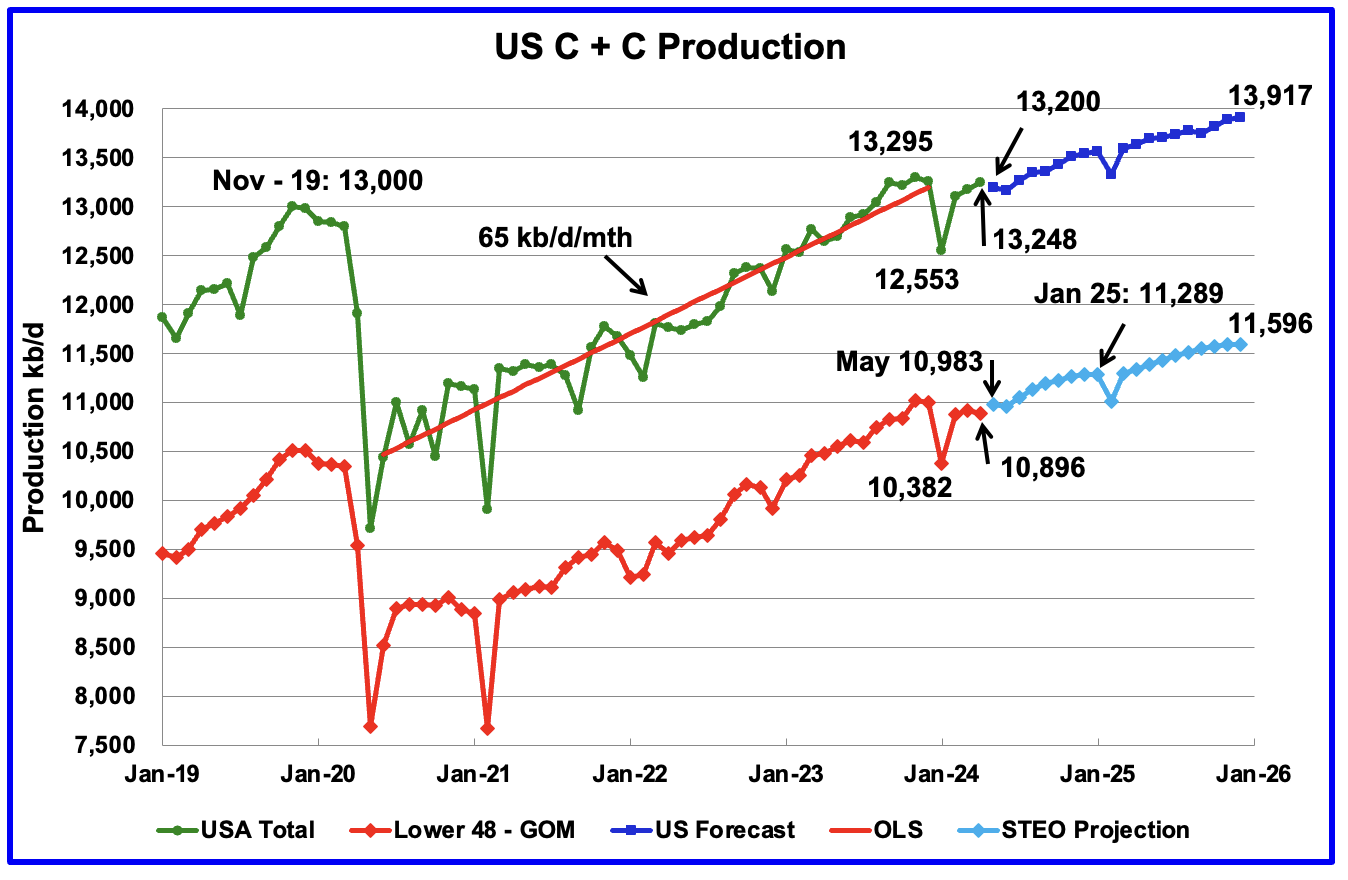
U.S. April oil production rose by 72 kb/d to 13,248 kb/d. The largest increases came from Texas, 53 kb/d while New Mexico dropped by 24 kb/d.
US production has been flat since September 2023.
The dark blue graph, taken from the May 2023 STEO, is the forecast for U.S. oil production from April 2024 to December 2025. Output for December 2025 is expected to reach 13,917 kb/d and is an increase of 8 kb/d from the previous STEO report.
From April 2024 to December 2025 production is expected to grow by 669 kb/d or at an average rate of 33.5 kb/d/mth. This rate is still a high growth rate and is not consistent with many articles predicting a near term peak in US oil production.
The red OLS line from June 2020 to December 2023 indicates a monthly production growth rate of 65 kb/d/mth or 780 kb/d/yr. Production going forward is increasing at a slower rate.
The light blue graph is the STEO’s projection for output to December 2025 for the Onshore L48. From April 2024 to December 2025, production is expected to increase by 700 kb/d to 11,596 kb/d which is 47 kb/d higher than reported in the previous STEO.
Is the slow rollover in production shown in the last four months of 2025 in the Onshore L48 pointing to peak US production occurring in late 2025?
US Oil Production Ranked by State
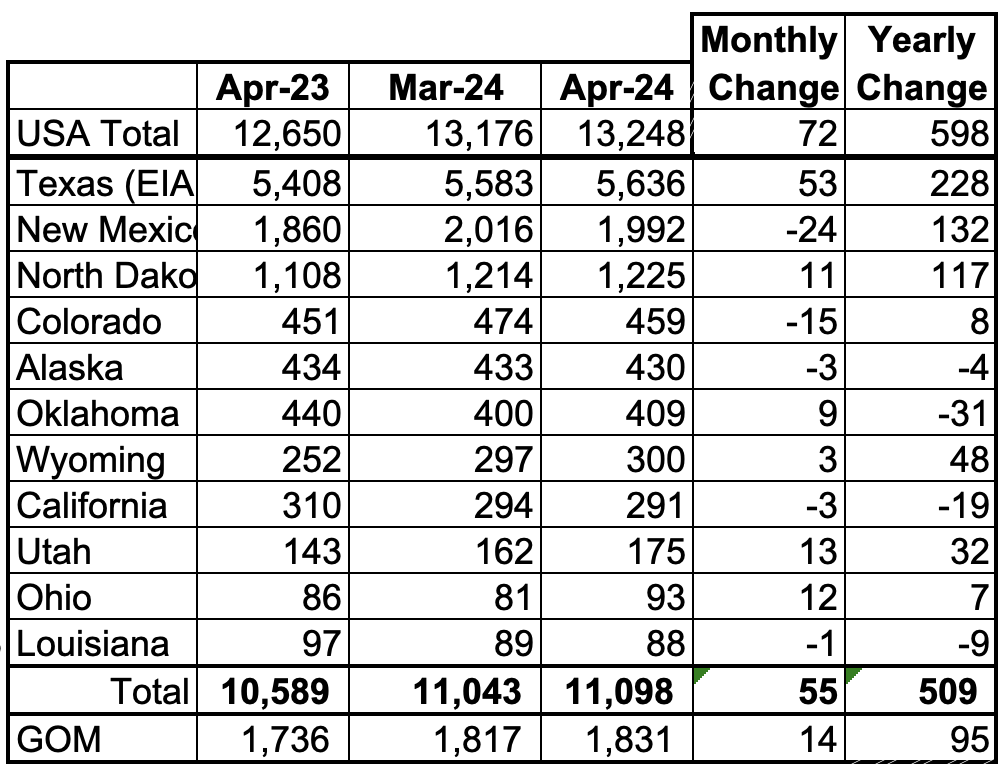
Listed above are the 11 US states with the largest oil production along with the Gulf of Mexico. Ohio has been added to this table since its production approached 100 kb/d in January and exceeded Louisiana’s production. These 11 states accounted for 83.8% of all U.S. oil production out of a total production of 13,248 kb/d in April 2024.
On a YoY basis, US production increased by 598 kb/d. GOM production rose by 14 kb/d MoM while YoY it rose by 95 kb/d.
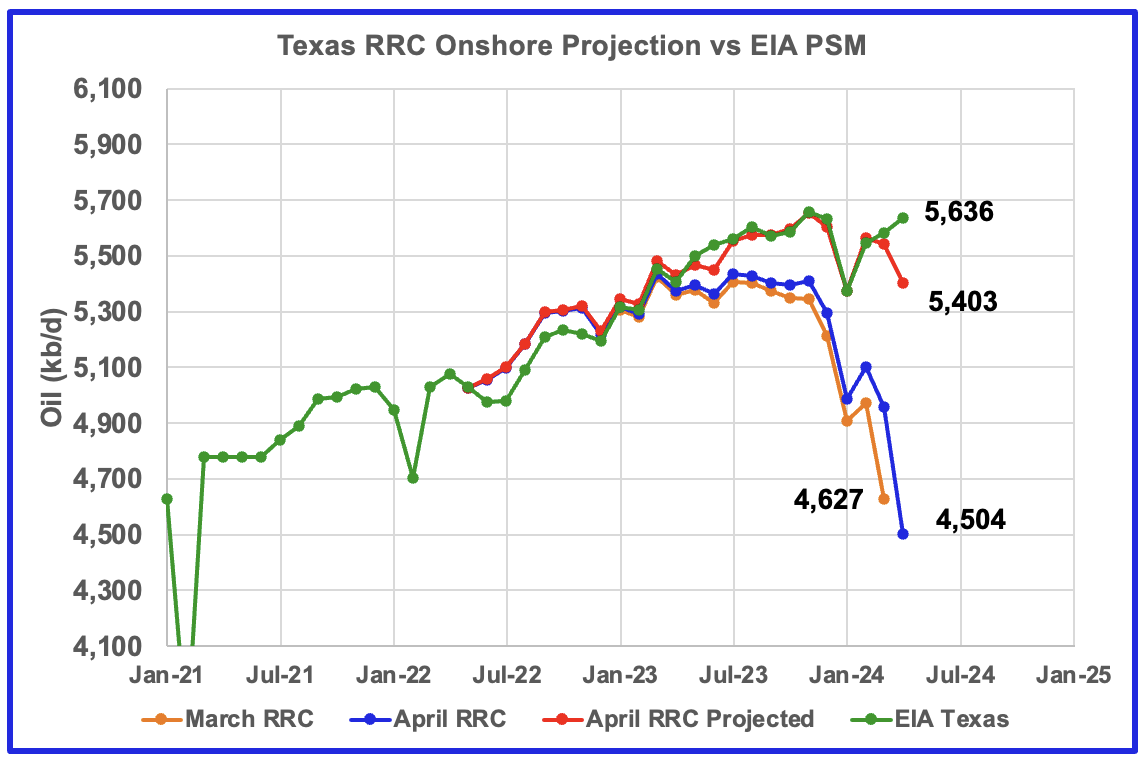
Texas production increased by 53 kb/d in April to 5,636 kb/d. YoY production is up by 228 kb/d.
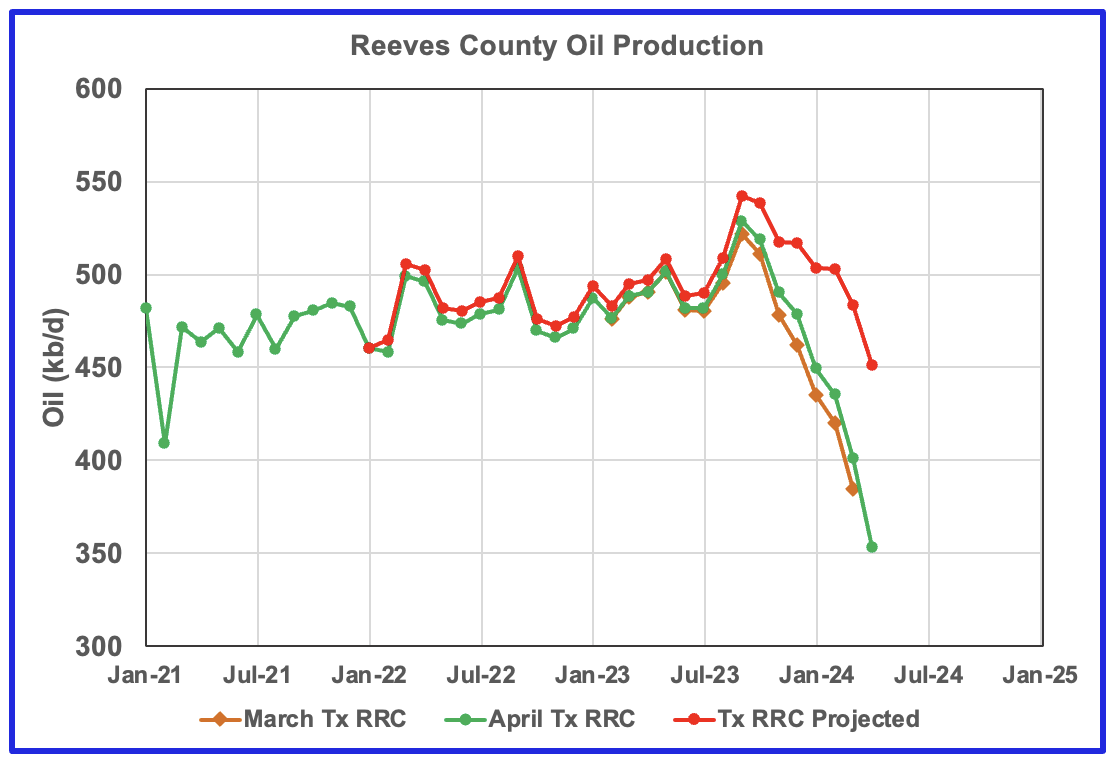
The red graph is a production projection for Texas using the Texas RRC reported March production, orange graph and April production, blue graph. The projection uses the cumulative difference between the April and March preliminary production data provided by the Texas RRC. The projection provides a reasonable estimate for Texas March production of 5,542 kb/d vs the EIA’s official 5,583 kb/d.
The issue with the April projection is: How can the March production estimate be so close, within <1%, and the April estimate be so far off at the same time? The orange and blue graphs show the production reported by the Texas RRC for March and April. Note that the last month in the April production graph is lower than the last month in the March production graph. This is an indication that a county or district may be in a declining phase if the same pattern repeats itself over a few months.
So the methodology used to project April production should be lower than March, which it is. So we are left with wondering how can the March projection be so close and April be so far off.
Given that the RRC April production was lower than March, how can the EIA end up with April production being higher than March? I am assuming that the EIA is using the RRC data. Maybe not.
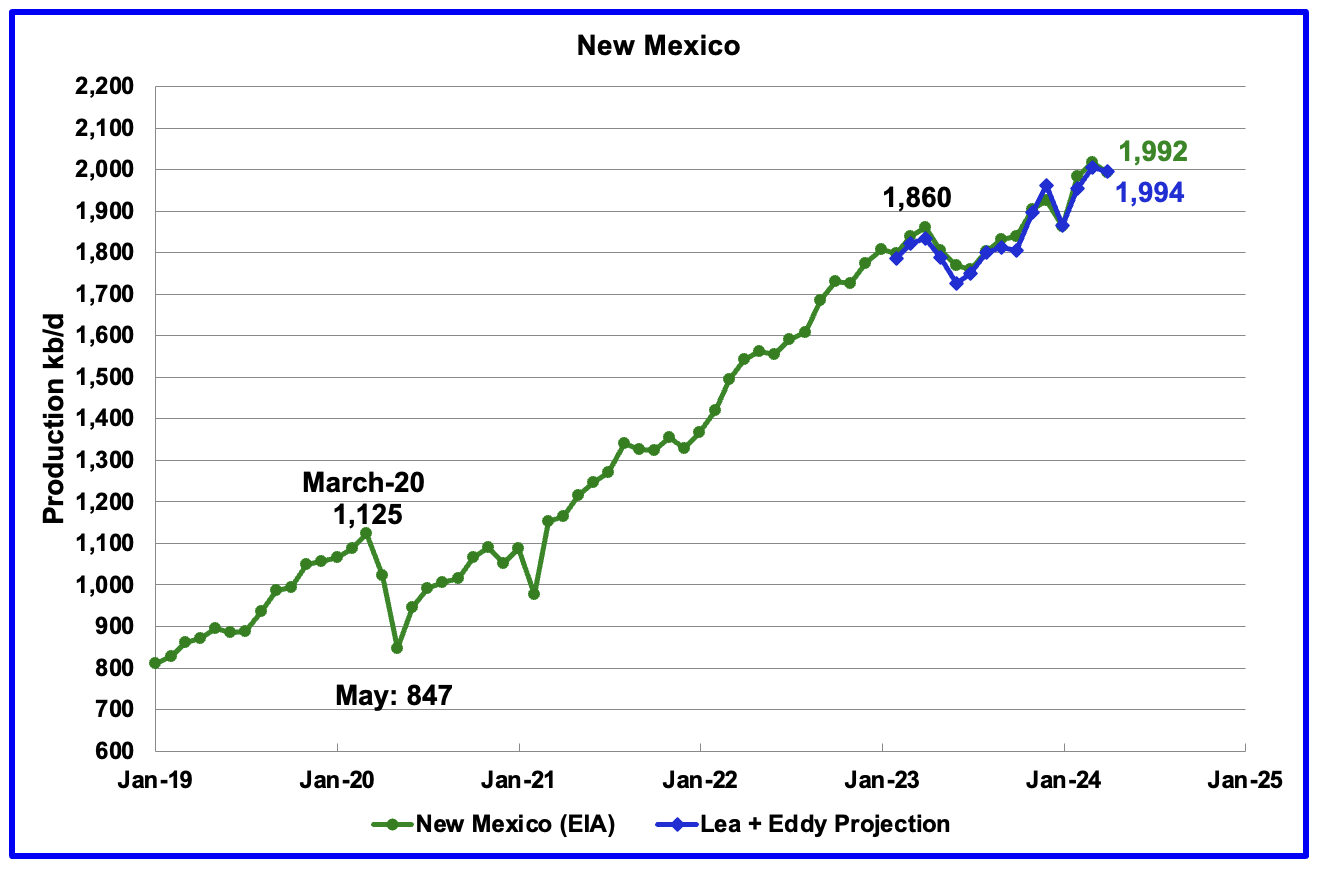
According to the EIA, New Mexico’s April production dropped by 24 kb/d to 1,992 kb/d.
The blue graph is a production projection for Lea plus Eddy counties. These two counties account for close to 99% of New Mexico’s oil production. The projection used the difference between March and April preliminary production data provided by the New Mexico Oil Conservation Division. The projection provides a reasonable estimate for New Mexico’s April production. A 1% correction was added to the Lea plus Eddy projection to account for their fraction of New Mexico’s oil production.
Note the methodology used to project New Mexico’s production is the same as that used for Texas above.
More oil production information for these two counties and Texas counties is reviewed in the special Permian section further down.
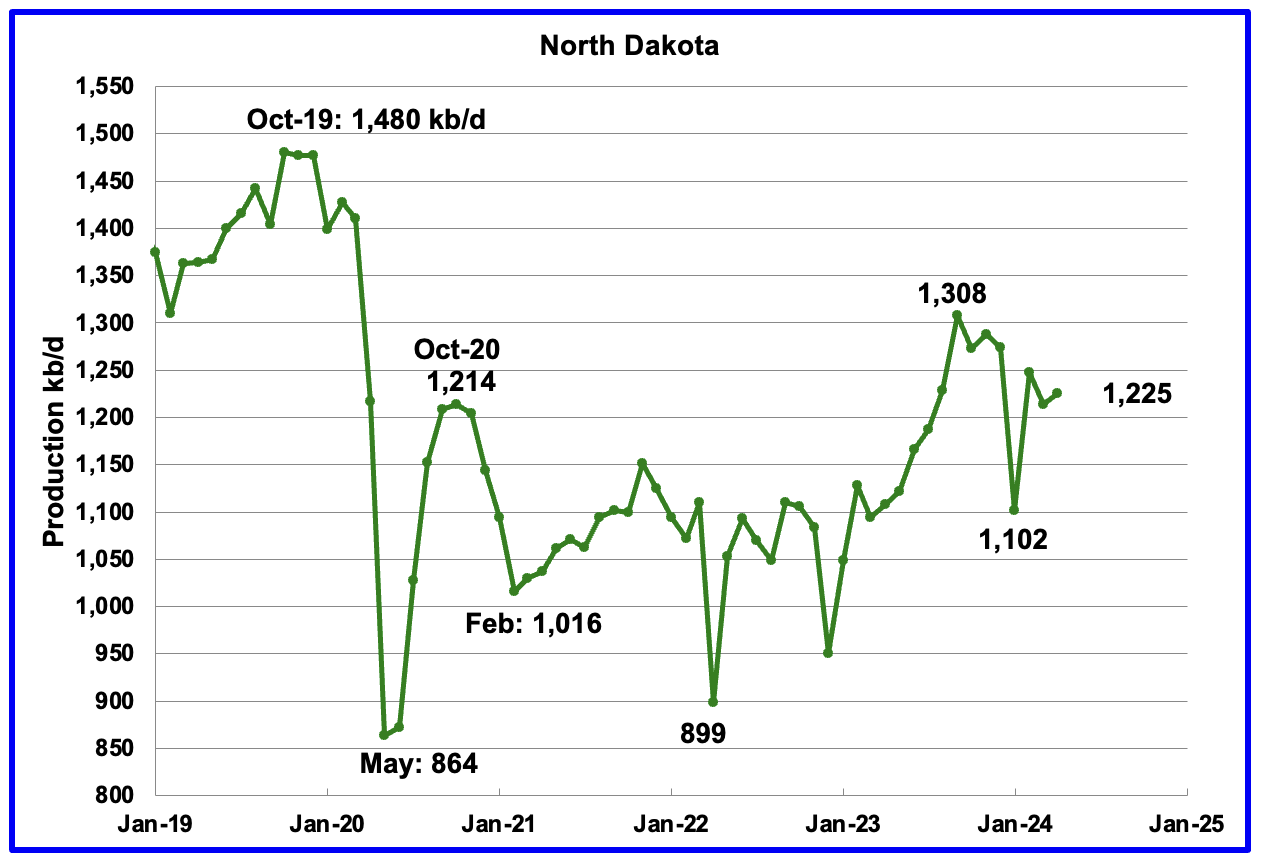
April’s output increased by 11 kb/d to 1,225 kb/d. YoY production increased by 117 kb/d.
According to this article the drillers are getting more efficient at drilling two mile laterals and April’s increase was weak because North Dakota was working its way out of winter.
“There are 38 active drilling rigs as of Friday. Helms said companies are improving the time it takes to drill two-mile laterals into the ground.
“That means they have gone from eight or nine days to seven or eight days… That cycle time continues to accelerate. The rigs are bigger, stronger and faster. We’re going to have to step up in order to keep up with that,” said Helms.”
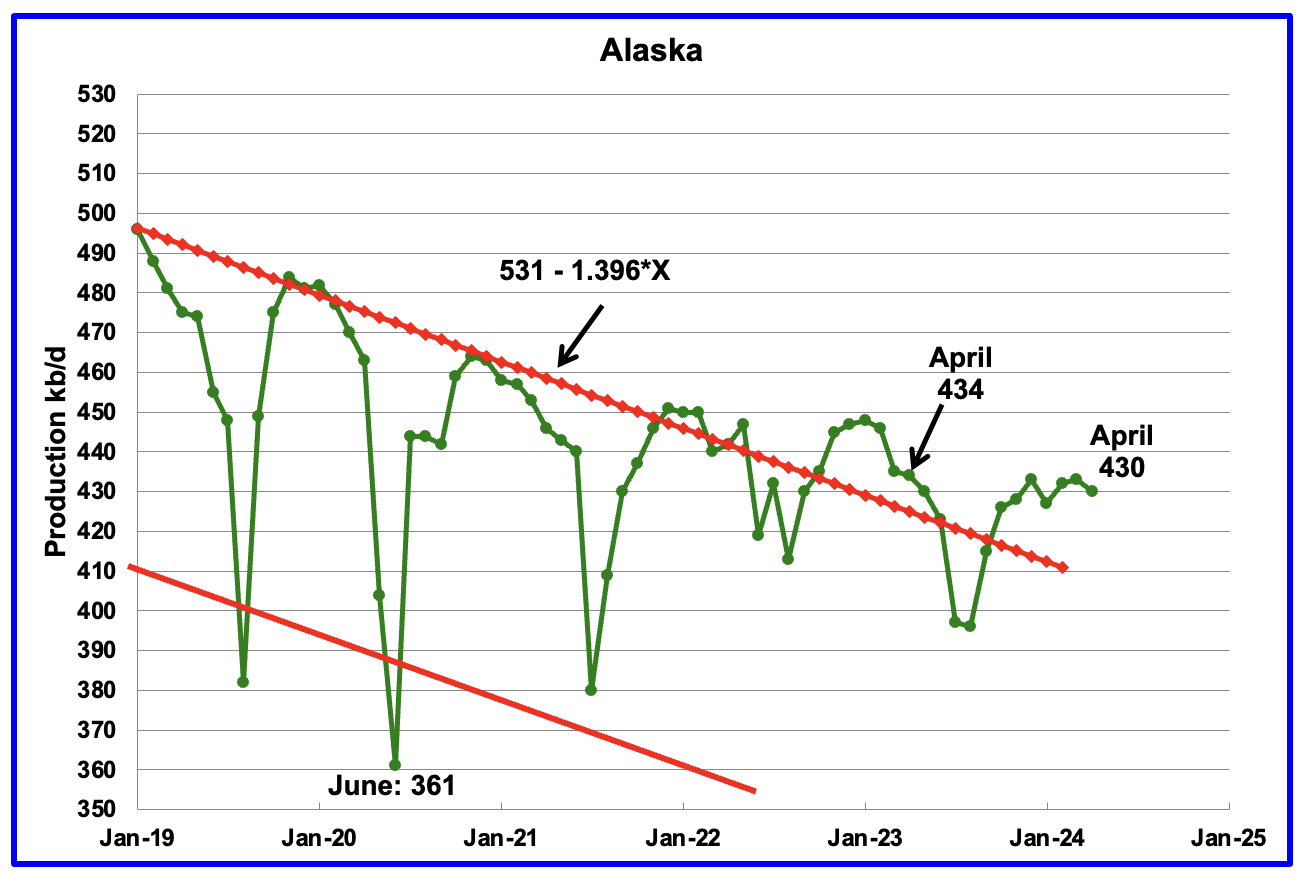
Alaskaʼs April output dropped by 3 kb/d to 430 kb/d. Production YoY is down by 4 kb/d. The EIA’s weekly petroleum report continues to show Alaska’s oil production is dropping with June production closer to 415 kb/d.
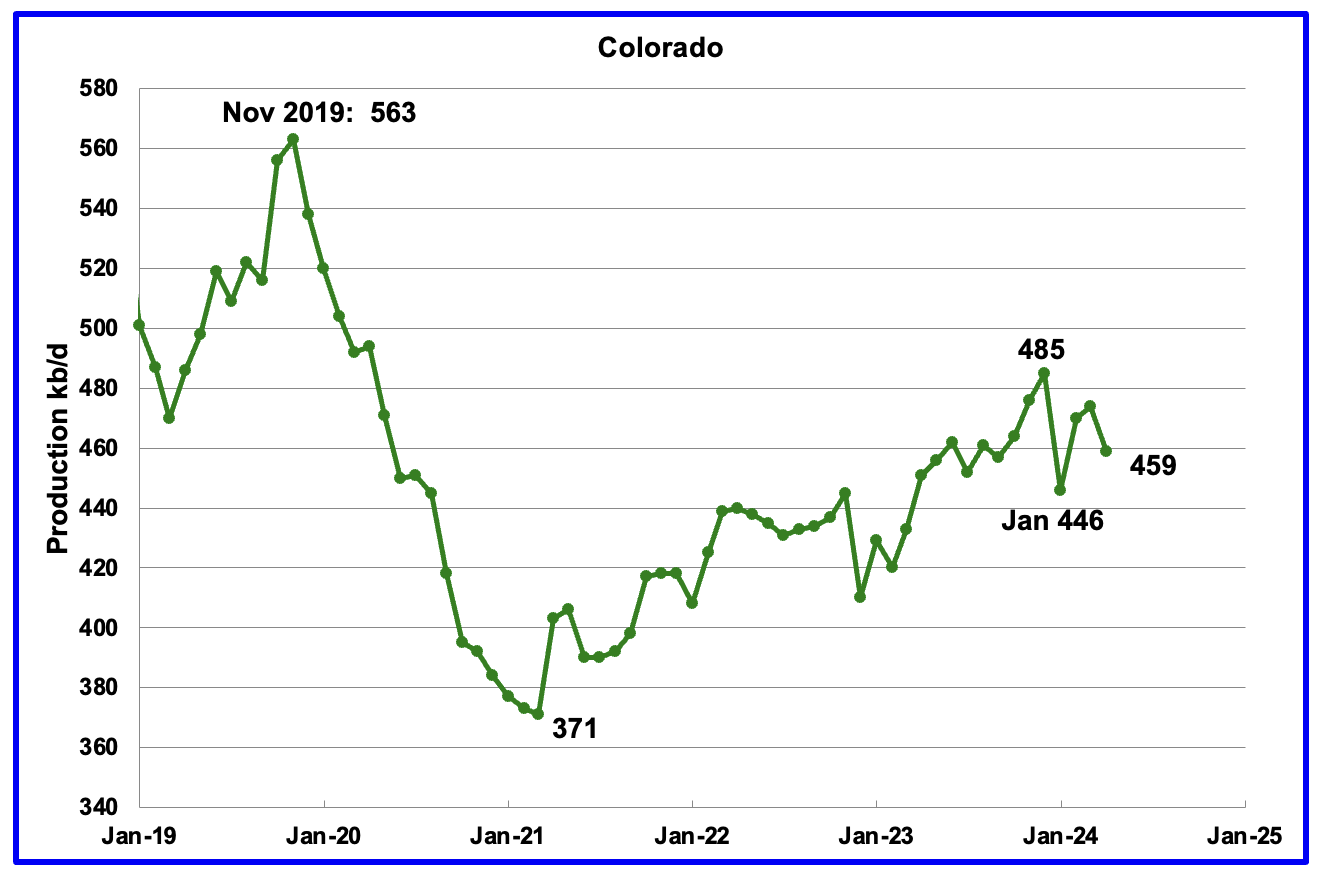
Coloradoʼs April production decreased by 15 kb/d to 459 kb/d. Colorado has moved ahead of Alaska to become the 4th largest US oil producing state. Colorado began the year with 12 rigs but has now dropped to 10 during June, a 1 rig increase over May.
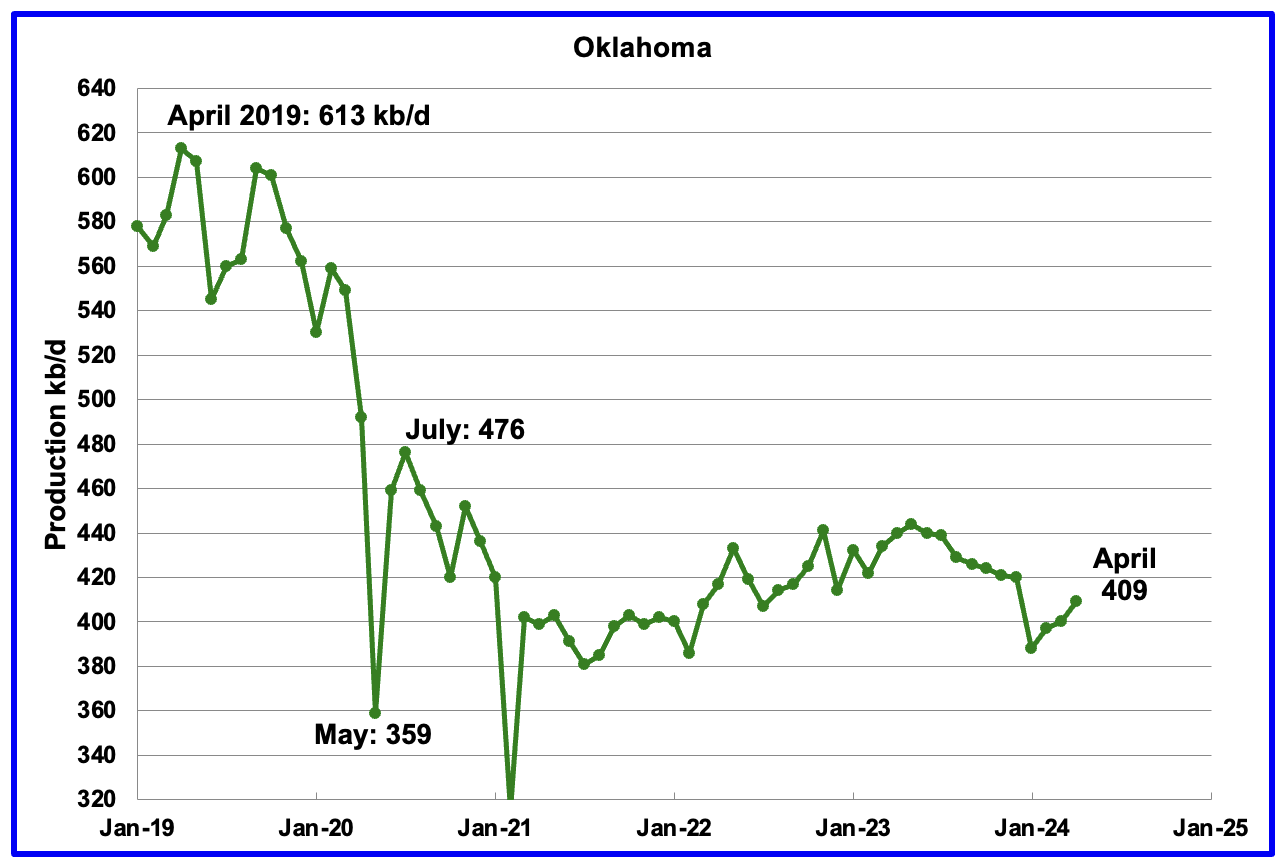
Oklahoma’s output in April rose by 9 kb/d to 409 kb/d. Production remains below the post pandemic July 2020 high of 476 kb/d. Output appears to have entered a slow declining/plateau phase. Note that January production dropped by 32 kb/d while February only rose 9 kb/d.
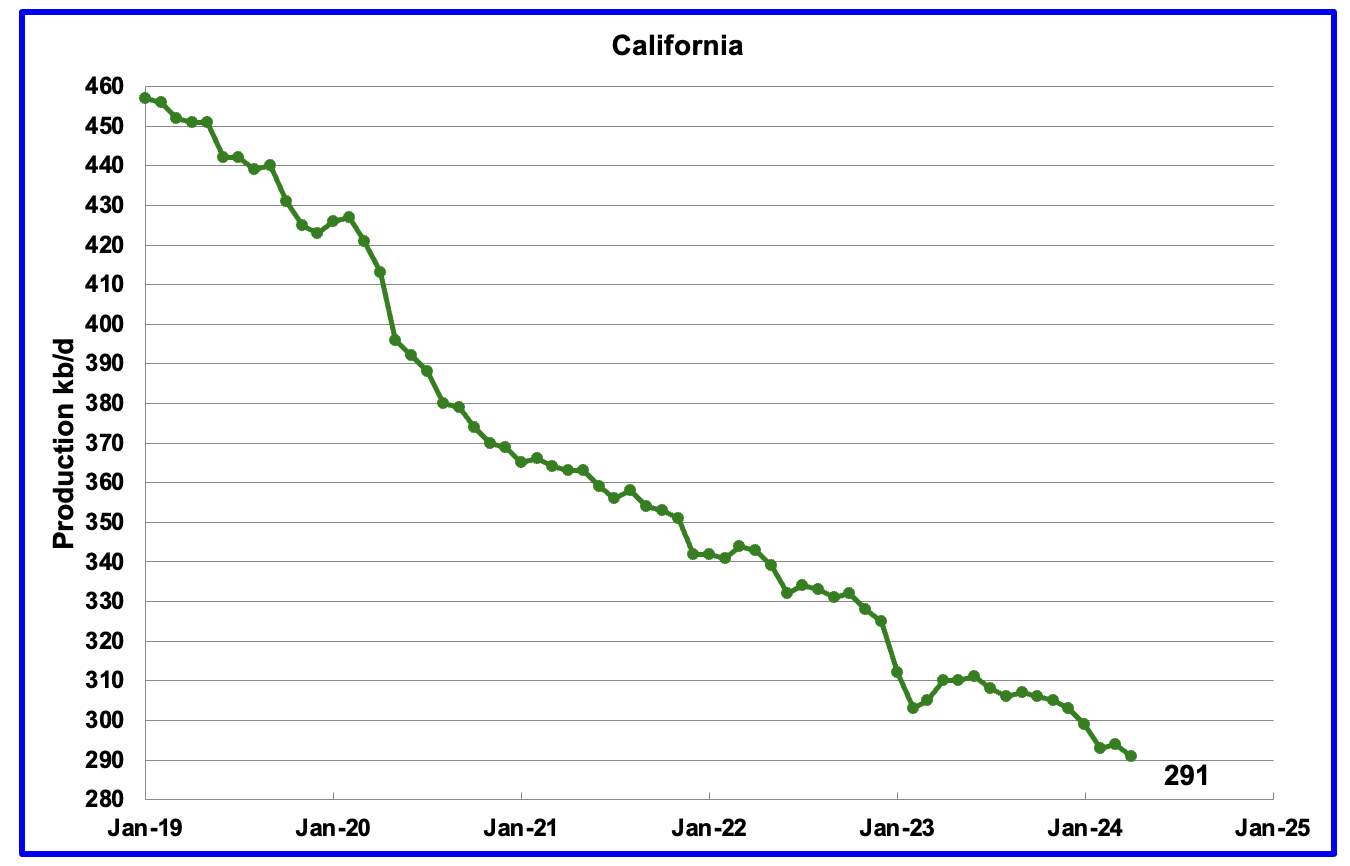
California’s declining production trend continues. Californiaʼs April production dropped by 3 kb/d to 291 kb/d. From April 2021 to April 2024, production dropped by 72 kb/d or 2 kb/d/mth.
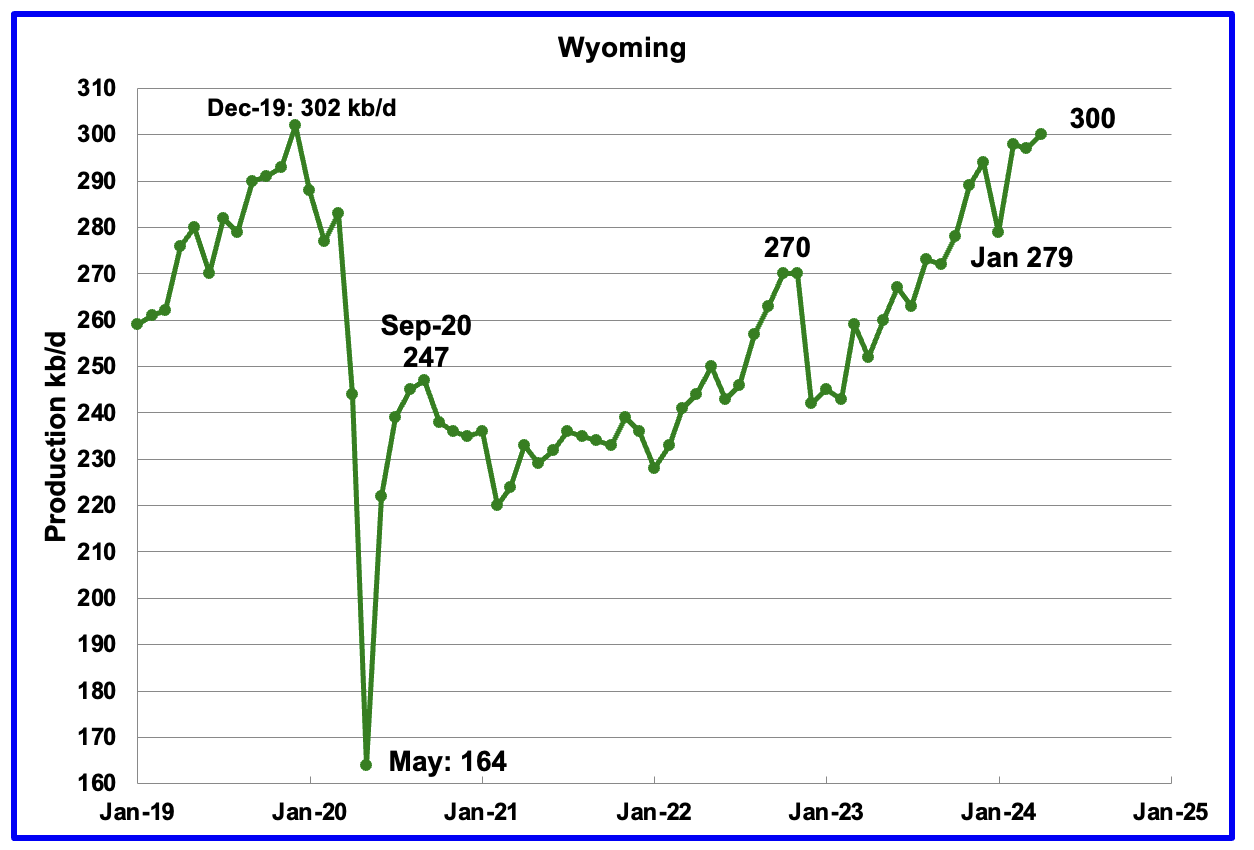
Wyoming’s oil production has been rebounding since March 2023. However the rebound was impacted by the January 2023 storm. April production rose by 3 kb/d to a new post pandemic high of 300 kb/d.
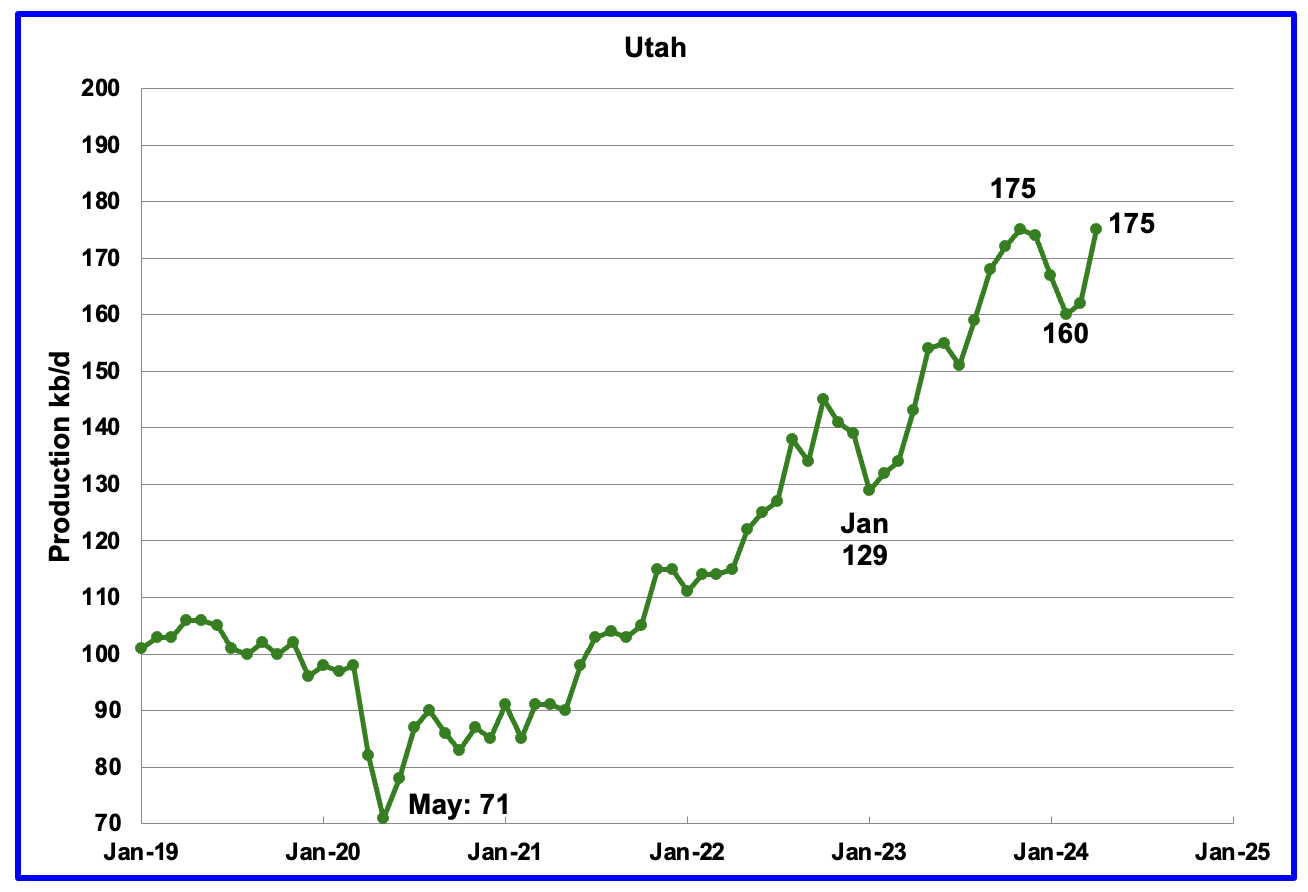
April’s production increased by 13 kb/d to 175 kb/d. For the first 5 months of 2024, Utah had 9 oil rigs in operation. It is not clear why production dropped in January and February.
According to this article, the Supreme court will review the 88-mile Uinta Basin Railway that would connect the remote, oil-rich eastern Utah to the broader rail network.
“If built, the railroad could increase waxy crude oil production in the basin nearly five-fold, from 90,000 barrels per day to 440,000 barrels per day, according to a 2021 environmental review.“
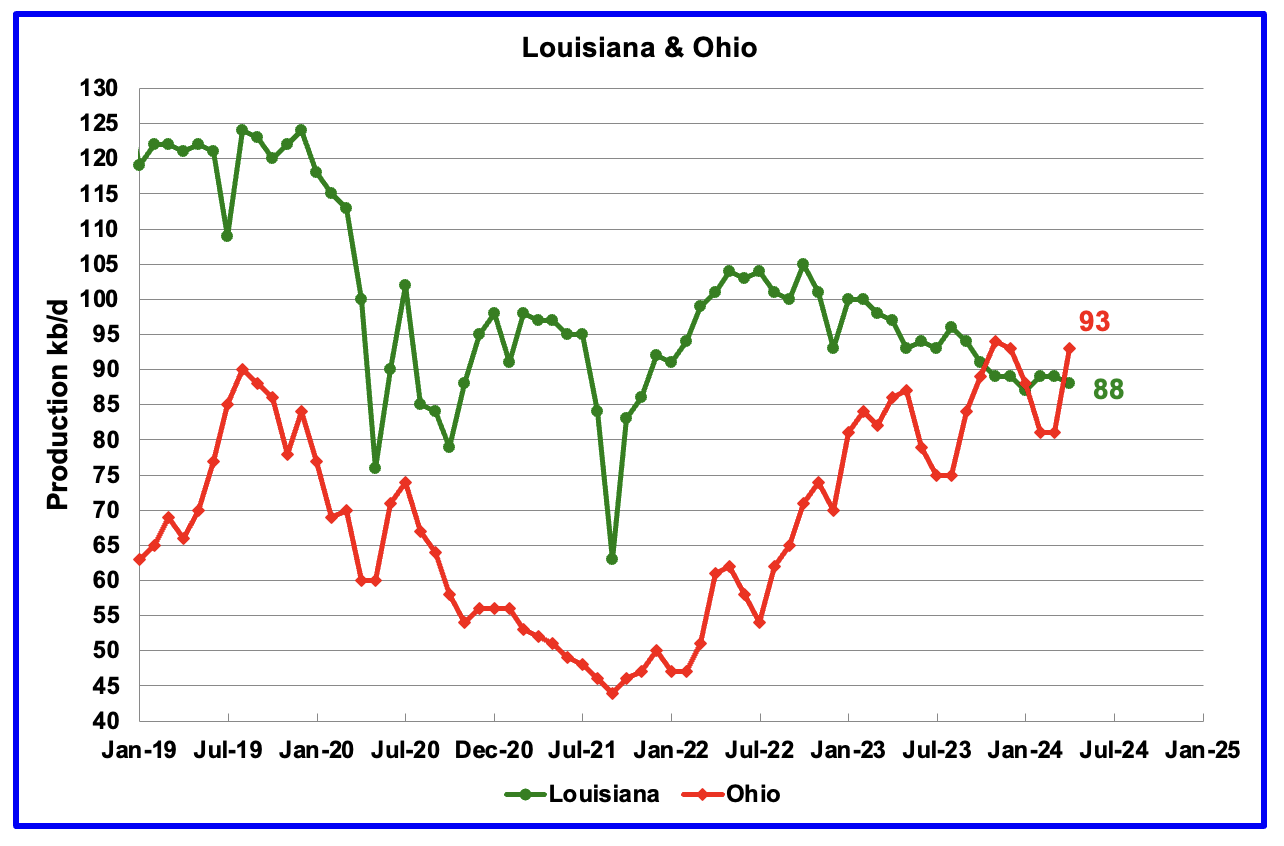
Ohio has been added to the Louisiana chart because Ohio’s production has been slowly increasing since October 2021 and passed Louisiana in November 2023.
Louisiana’s output entered a slow decline phase in October 2022. April’s production dropped by 1 kb/d to 88 kb/d. Ohio’s oil production rose by 12 kb/d to 94 kb/d, just 1 kb/d lower than its previous high of 94 kb/d. The most recent Baker Hughes rig report now shows two horizontal oil rigs operating in Ohio in June.
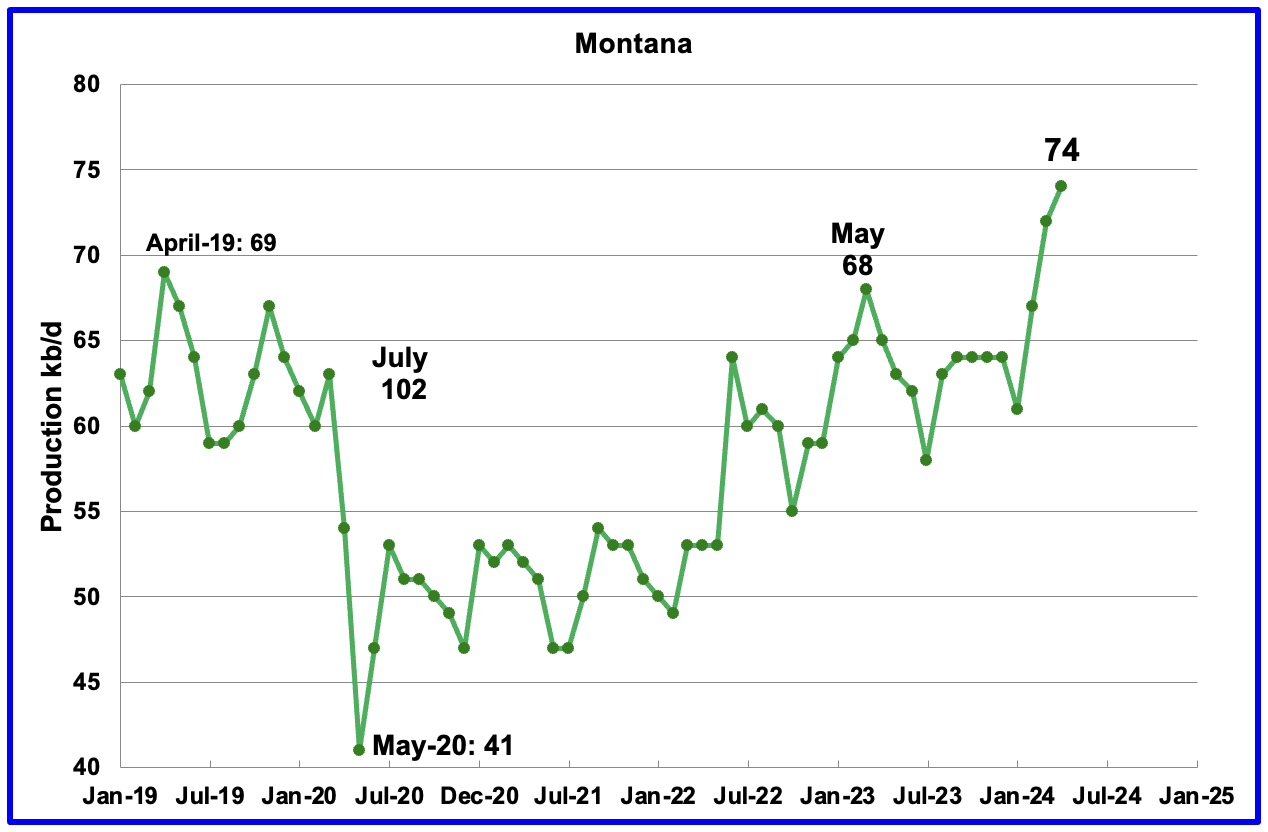
A Bonus State. It was pointed out that Montana has been increasing production since June 2022. At the end of January 2024 Montana added 1 rig to the one operating for a total of 2. Two have been operating up to the middle of June when it dropped back to one. Montana’s oil production rose by 2 kb/d in April to 74 kb/d.
According to the EIA, “Most of Montana’s crude oil production comes from the Bakken Formation in the northeastern corner of the state along the border with North Dakota. Montana’s Elm Coulee field, which began producing oil in 2001, was initially the most prolific oil field in the Williston Basin, a geologic basin that spreads from eastern Montana into North Dakota and Canada. However, the state’s oil production declined from its 2006 peak of nearly 100,000 barrels per day as drilling activity moved to North Dakota, where the Bakken Shale formation is thicker, covers a larger area, and holds more oil.“
According to this article, a Texas company is going to sequester CO2 in Montana oil fields that would increase oil production in Montana. The pipeline was completed in April 2022, according to this article.
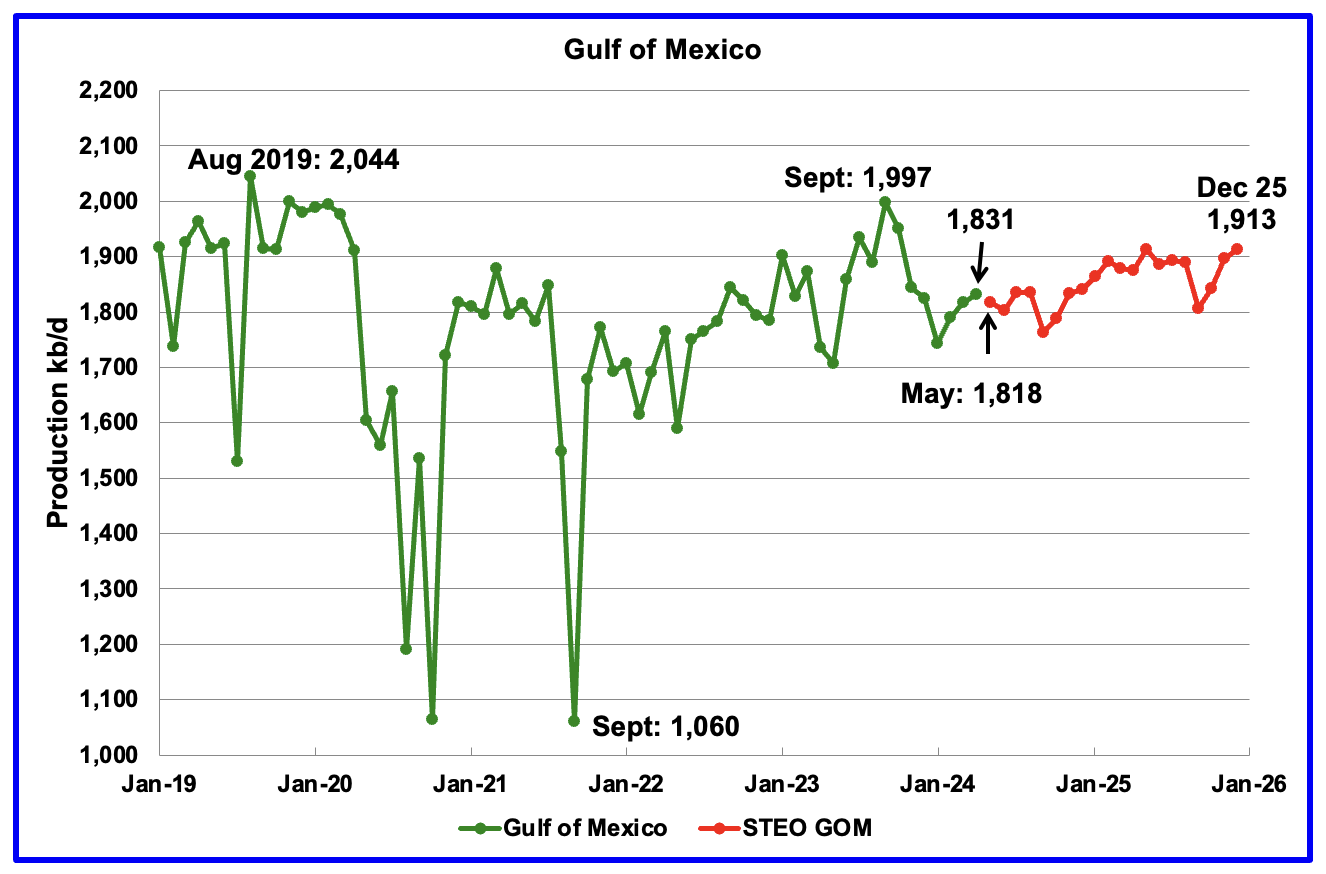
GOM production rose by 14 kb/d in April to 1,831 kb/d but is expected to drop in May by 13 kb/d to 1,818 kb/d.
The June 2024 STEO projection for the GOM output has been added to this chart. It projects production from May 2024 to December 2025 will increase by 95 kb/d to 1,913 kb/d, 39 kb/d lower than reported in the previous STEO and 99 kb/d lower than reported in the February report, two months ago.
A Different Perspective on US Oil Production
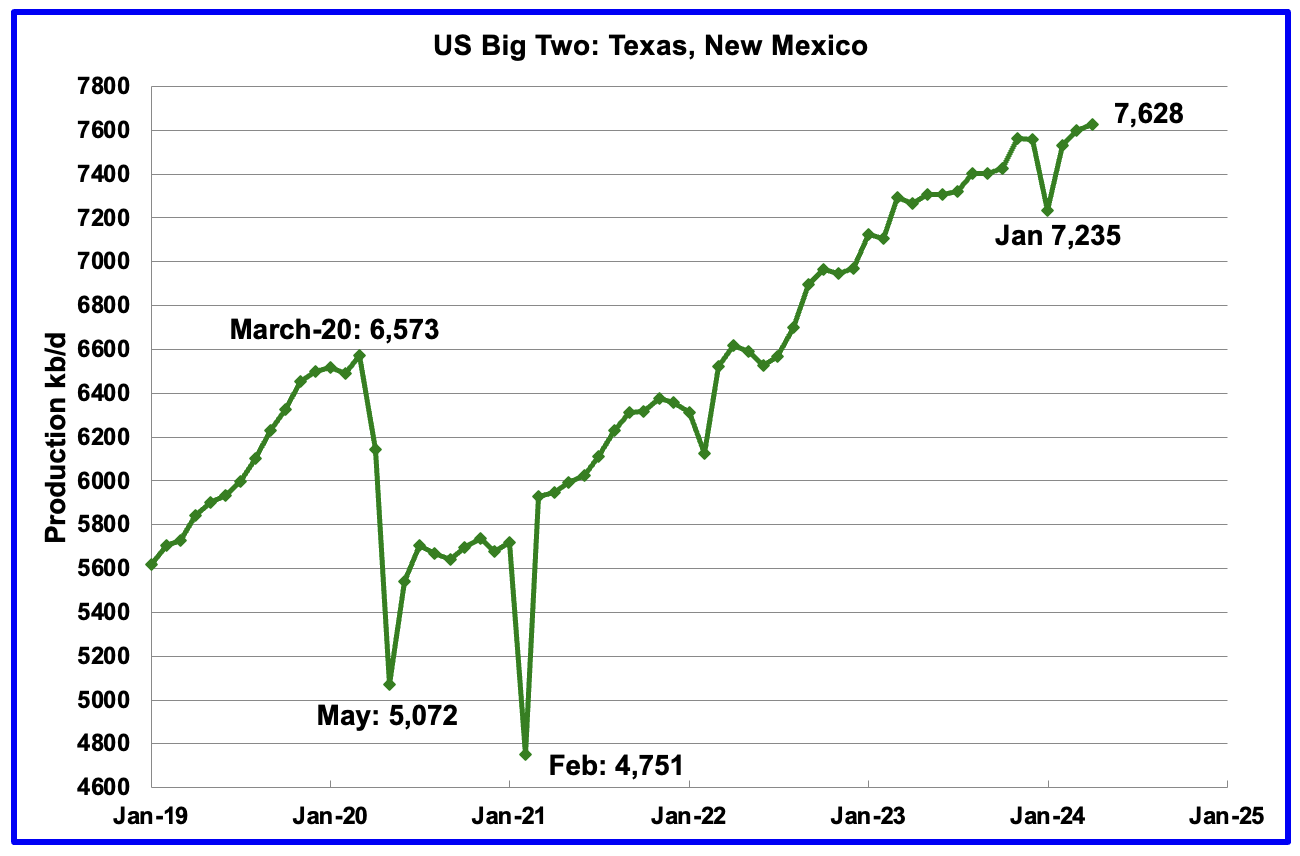
The Big Two states’ combined oil output for Texas and New Mexico.
April’s production in the Big Two states increased by a combined 29 kb/d to 7,598 kb/d with Texas adding 53 kb/d while New Mexico dropped 24 kb/d.
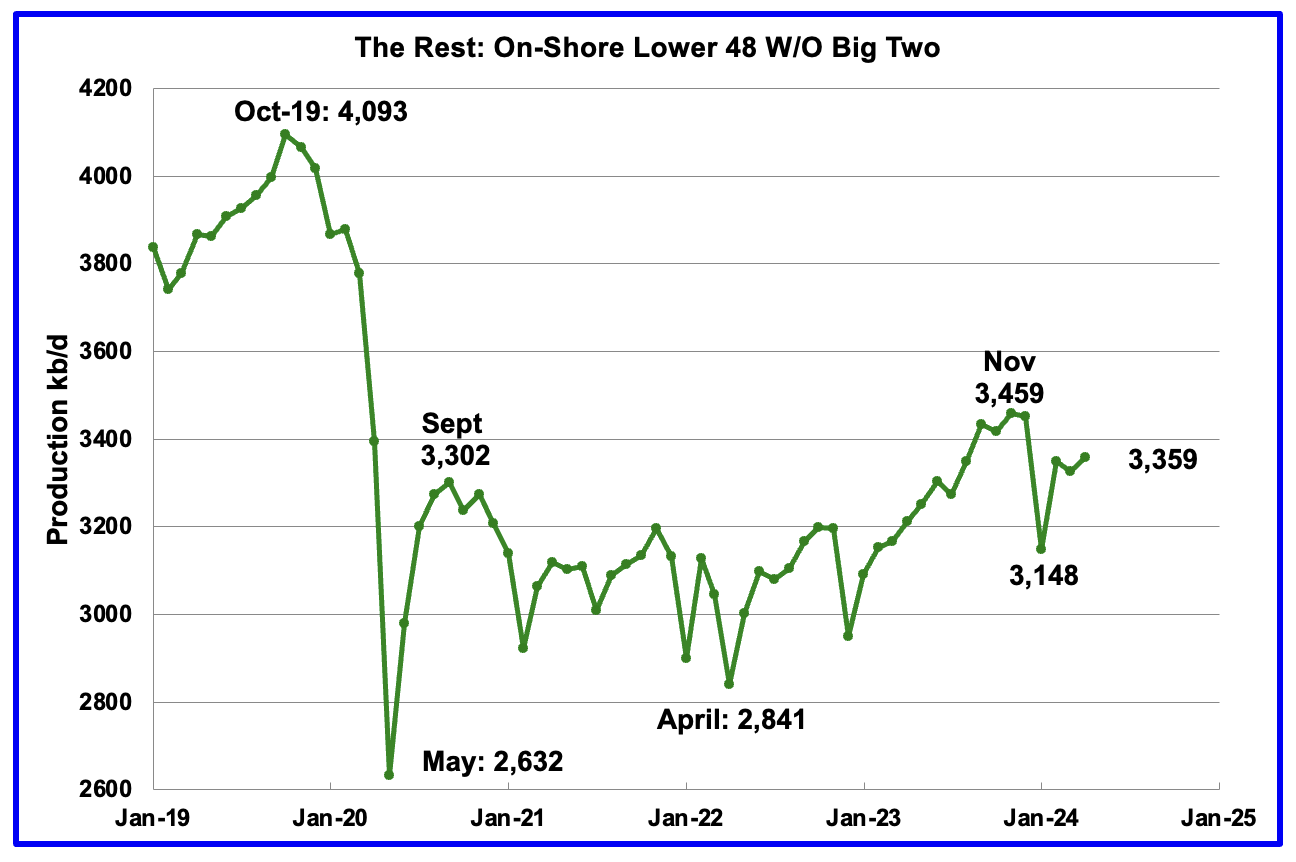
Oil production by The Rest
April’s oil production in The Rest increased by 32 kb/d to 3,359 kb/d and is 100 kb/d lower than November 2023.
The main takeaway from The Rest chart is that current production is below the high of October 2019 and is a significant loss that occurred during the Covid shut down and will not be readily recovered.
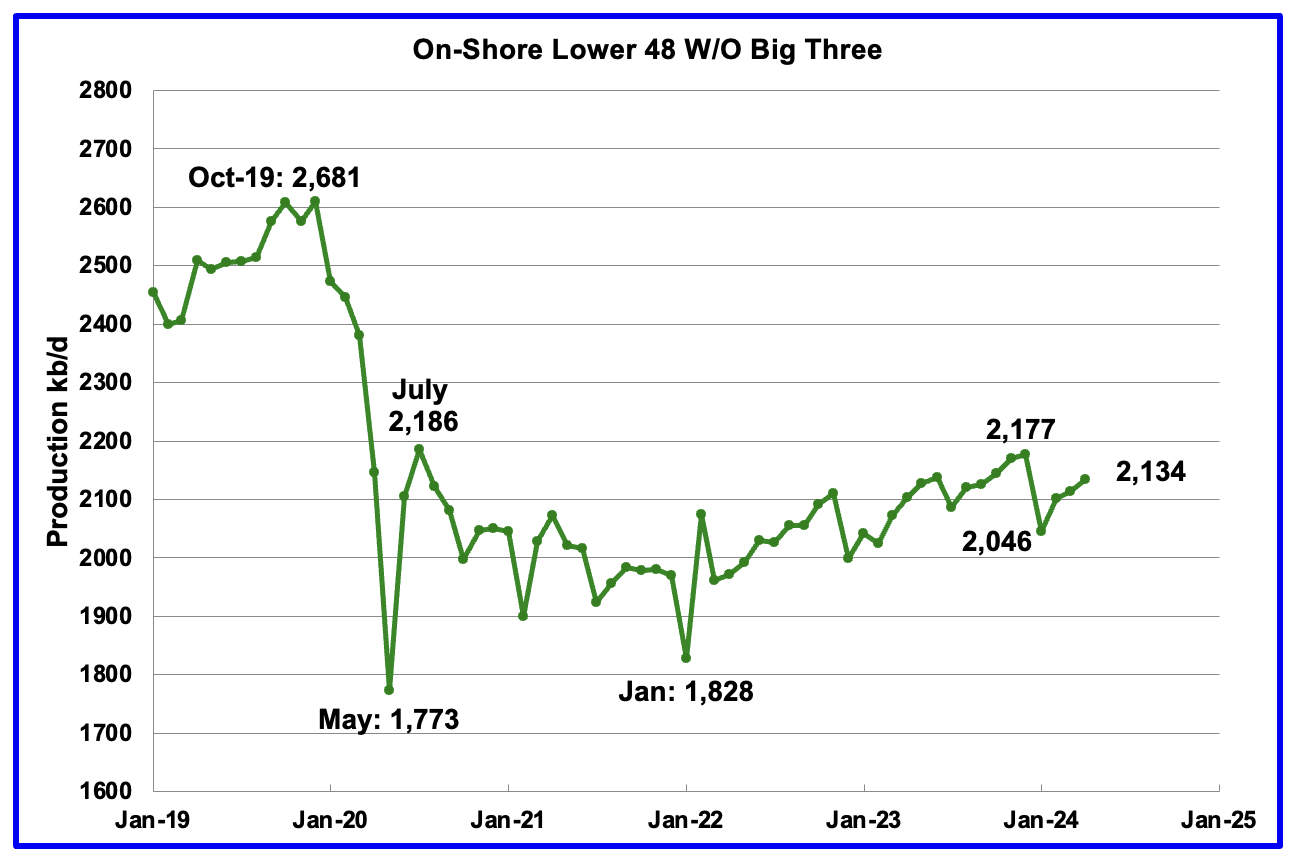
The On-Shore lower 48 W/O the big three, Texas, New Mexico and North Dakota, shows a slow rising production trend from the low of January 2022 to December 2023. April’s production increased by 21 kb/d to 2,134 kb/d. Two of the bigger contributors were Utah 13 kb/d and Ohio 12 kb/d.
Permian Basin Report by Main Counties and Districts
This special monthly Permian section was recently added to the US report because of a range of views on whether Permian production will continue to grow or will peak over the next year or two. The issue was brought into focus recently by the Goehring and Rozencwajg Report which indicated that a few of the biggest Permian oil producing counties were close to peaking or past peak. Also comments by posters on this site have similar beliefs from hands on experience.
This section will focus on the four largest oil producing counties in the Permian, Lea, Eddy, Midland and Martin. It will track the oil and natural gas production and the associated Gas Oil Ratio (GOR) on a monthly basis. The data is taken from the state’s government agencies for Texas and New Mexico. Typically the data for the latest two or three months is not complete and is revised upward as companies submit their updated information. Note the natural gas production shown in the charts that is used to calculate the GOR is the gas coming from both the gas and oil wells.
Of particular interest will be the charts which plot oil production vs GOR for a county to see if a particular characteristic develops that indicates the field is close to entering the bubble point phase. While the GOR metric is best suited for characterizing individual wells, counties with closely spaced horizontal wells may display a behaviour similar to individual wells due to pressure cross talking . For further information on the bubble point and GOR, there are a few good thoughts on the intricacies of the GOR in an earlier POB comment. Also check this EIA topic on GOR.
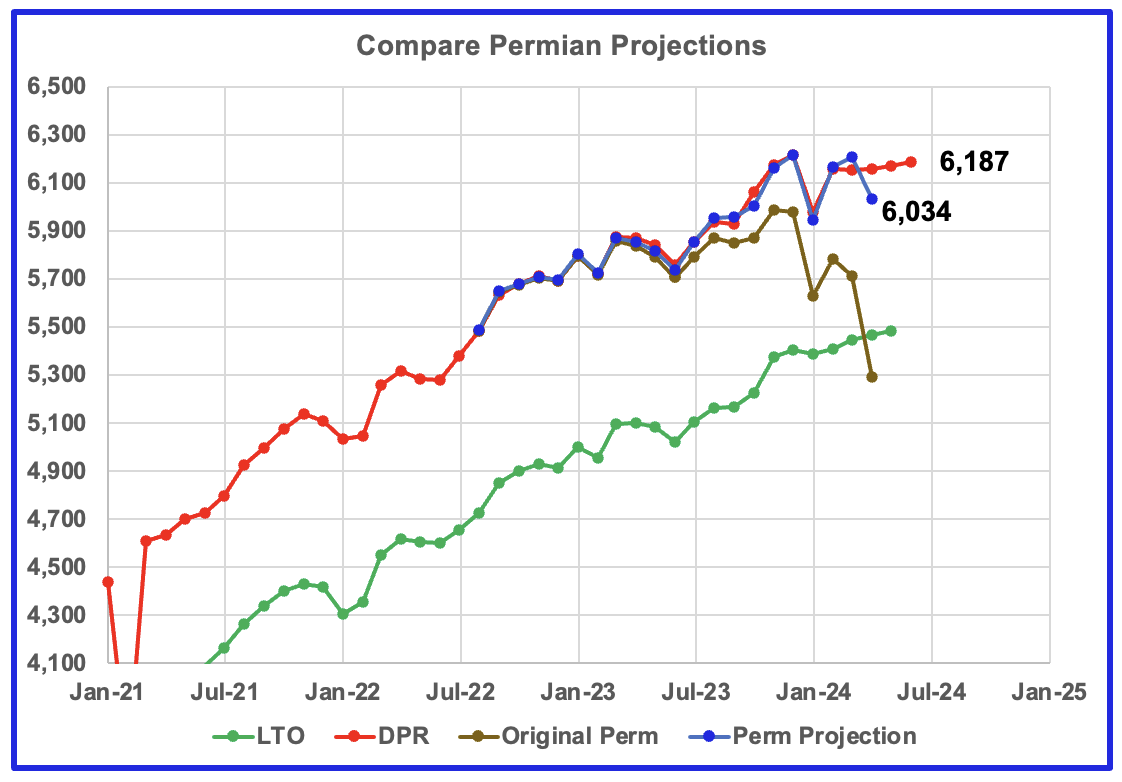
This chart shows four oil production graphs for the Permian basin updated to April and to June for the DPR. The gap between the DPR and LTO projections is there because the DPR projection includes both LTO oil along with oil from conventional wells in the basins that it covers.
The red and green graphs show oil production as published by the EIA’s June STEO. Comparing the two, it appears that both the LTO and DPR offices believe Permian LTO production is currently in a plateauing phase with a bias towards a slow rise. The blue graph is a projection for Permian oil production. The brown chart is the sum of preliminary Permian production data as taken from the Texas RRC and the New Mexico Oil Conservation Division (OCD). The big January drop is due to severe weather in the central US.
The blue Permian projection graph uses two months of preliminary production data, March and April, from the New Mexico OCD and the Texas RRC to make its April projection. The Permian projection is showing an extra 36 kb/d over the DPR production estimate for March and is in good agreement with the previous months. However there is a major difference with April. The projection is estimating that Permian production dropped by 171 kb/d in April. This divergence is similar to the one discussed under Texas.
The initial attempt to project the combined Texas and Permian results using the same methodology as used to project New Mexico production has been successful up the March. However April is showing major divergence.
A modification has been introduced for projecting Texas results and limited back testing was undertaken. It will take a few more months of Texas data to see if the modification gives reasonable results.
New Mexico Permian
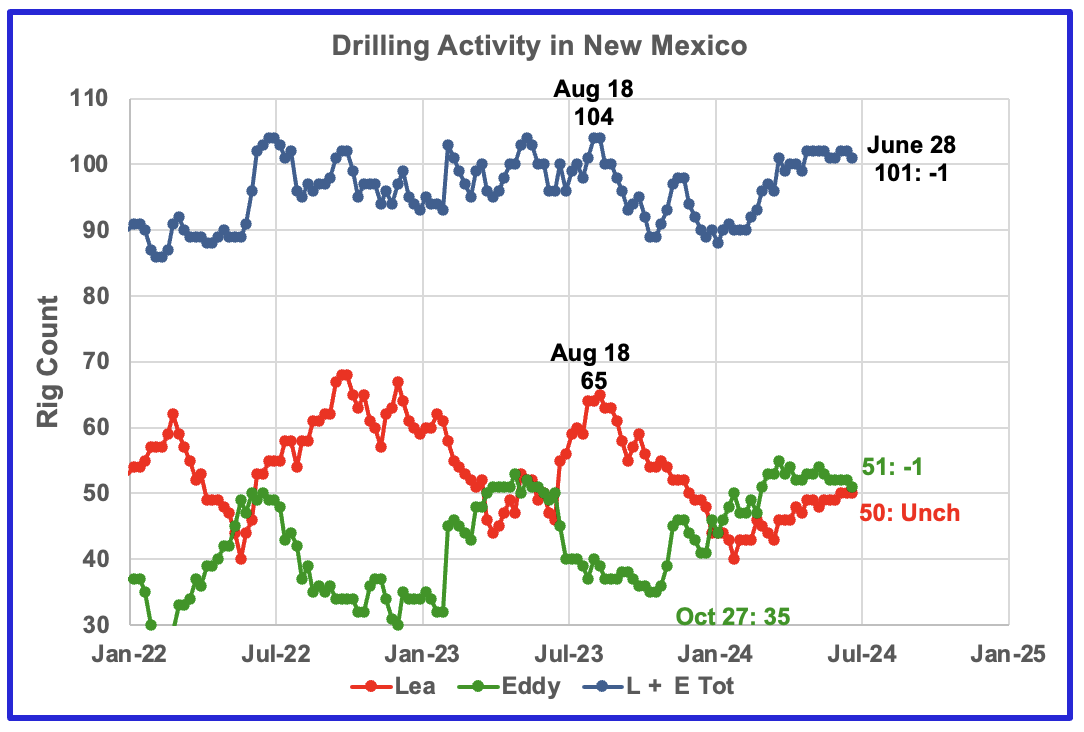
Since the middle of August 2023, the Lea county rig count has dropped from 65 rigs to 40 rigs in late January 2024. The rig count has slowly risen since then by 10 to 50 rigs at the end of June. At the same time production has increased to 1,197 kb/d over the period January 2023 to April 2024. See next chart.
From a low of 35 rigs in late October 2023, 20 rigs were transferred into Eddy county between October and March 2024. At its peak in late March 2024, Eddy county had 55 rigs operating. Currently 51 rigs are operating and are in a slow decline. Something is happening in Eddy county which is starting to show up in the production chart further down.
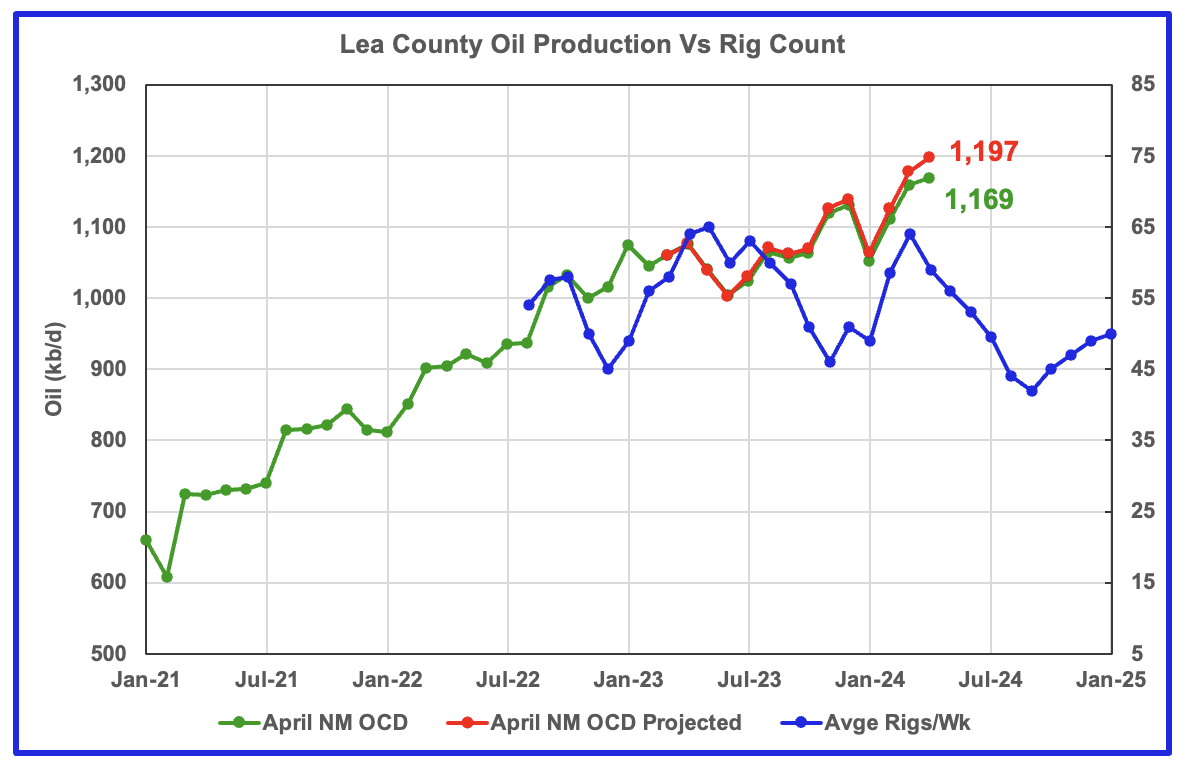
Lea County has peaked. May production will be flat or slightly down.
Preliminary April data indicates Lea County’s oil production increased by 10 kb/d to a new record high of 1,169 kb/d. A projection for April’s final production estimates it will be closer to 1,197 kb/d, an increase of 20 kb/d over March.
The blue graph shows the average number of weekly rigs operating during a given month as taken from the weekly rig chart. The rig graph has been shifted forward by 7 months. So the 64 Rigs/wk operating in August 2023 have been time shifted forward to March 2024 to show the possible correlation and time delay between rig count and oil production. If the oil production were to follow the rig count going forward, oil production in Lea County should begin to drop in May.
The recent monthly production increments for February, March and April are 62 kb/d, 52 kb/d and 20 kb/d respectively. At this decreasing production rate, we should expect the May increment to be flat or negative, provided production follows the rig graph.
Note that rig counts are being used to project production as opposed to completions because very few extra DUCs are being completed at this time.
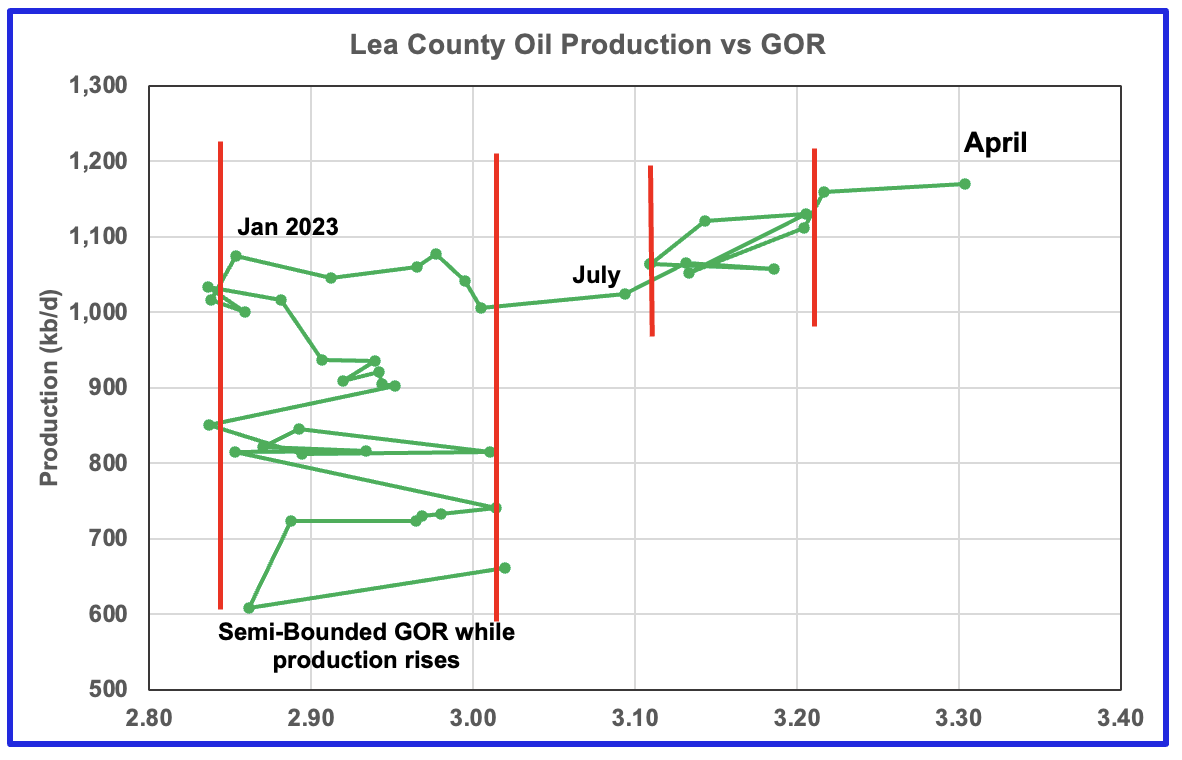
After much zigging and zagging, oil production in Lea county stabilized just above 1,000 kb/d In early 2023. Once production reached a new high in January 2023, production essentially plateaued but the GOR started to increase rapidly to the right and entered the bubble point phase in July 2023. However the Lea county GOR has continued to increase as production reached a new high in March 2024. This may indicate that the current production increase is coming from a new bench/area since the GOR’s behaviour since August 2023 to March 2024 time frame appears once again to be in a semi bounded GOR phase accompanied with rising production. However in April, the GOR moved out of the second semi bounded GOR region and production reached a new high by 10 kb/d.
This zigging and zagging GOR pattern within a semi-bounded GOR while oil production increases to some stable level and then moves out to a higher GOR to the right has shown up in a number of counties. See an additional two cases below. This is the tenth month in which Lea county has registered a GOR outside the first semi-bounded GOR range.
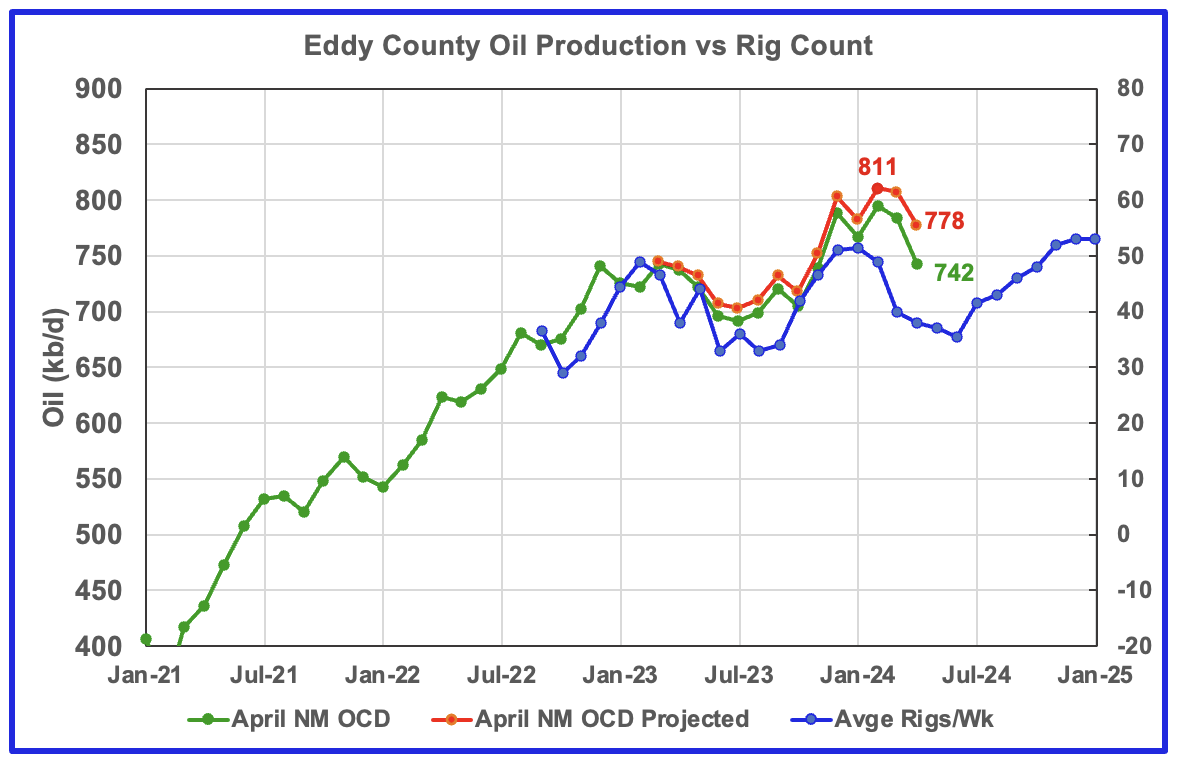
Eddy County oil production has peaked.
Eddy county oil production hit a projected high of 811 kb/d in February 2024. March and April production dropped by 4 kb/d and 29 kb/d respectively to 778 kb/d.
The blue graph shows the average number of weekly rigs operating during a given month as taken from the above weekly drilling chart. The rig graph has been shifted forward by 8 months to roughly coincide with the increase in the production graph starting in October 2023.
If production were to follow the rig count trend going forward, Eddy production should continue to drop till June before rising again starting in June/July. However that does not mean that production will exceed the February peak of 811 kb/d. It is the increasing legacy decline that will limit how much production can increase from the next low when it is reached.
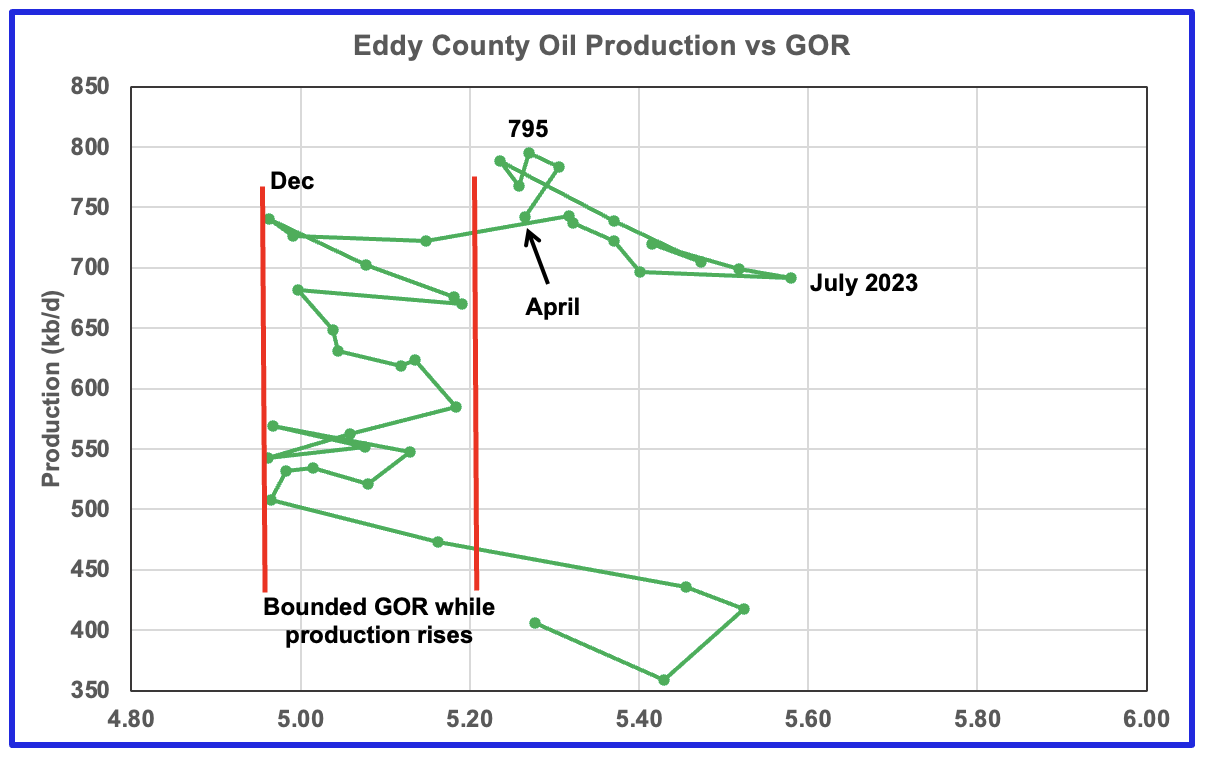
The Eddy county GOR pattern is similar to Lea county except that Eddy broke out from the semi bounded range earlier and for a longer time.
August 2023 saw a reversal in the increasing GOR trend by decreasing which then was followed by the current oil production increase which reached a new high in February 2024, 795 kb/d, an atypical pattern. Since February, production has fallen and the GOR has been essentially unchanged. For the last five months the GOR moved within a narrow range of 5.26 and 5.31.
The new November to March production highs along with a slowly changing GOR might indicate that drilling in Eddy county has punched into a new bench or some older wells are being refracted? Regardless production in Eddy county has begun to decline.
Texas Permian
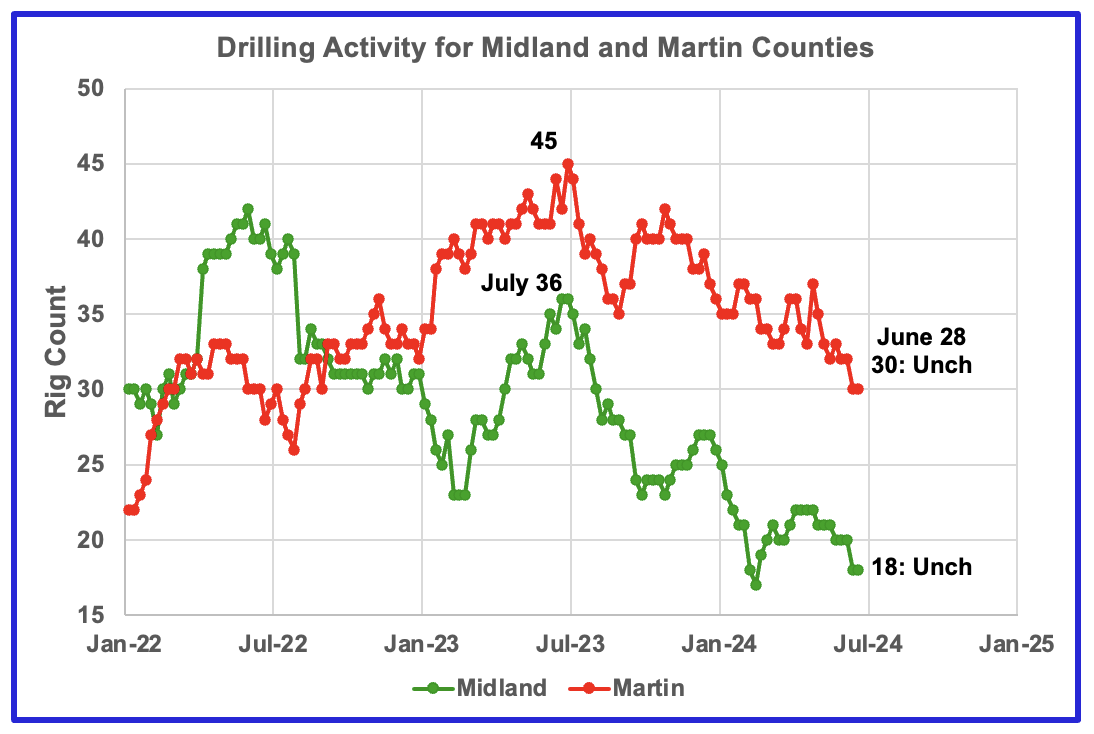
The rig count in Midland county has been dropping since July 2023. Midland county rigs continued to drop in June 2024 and are at the lows of 2024. At the end of June the rig count was 18 and is down 50% from where it was in July 2023.
Martin county rigs are in a slow decline and at the end of June the rig count totalled 30, down 7 from the beginning of May and are down 33% from the high of July 2023.
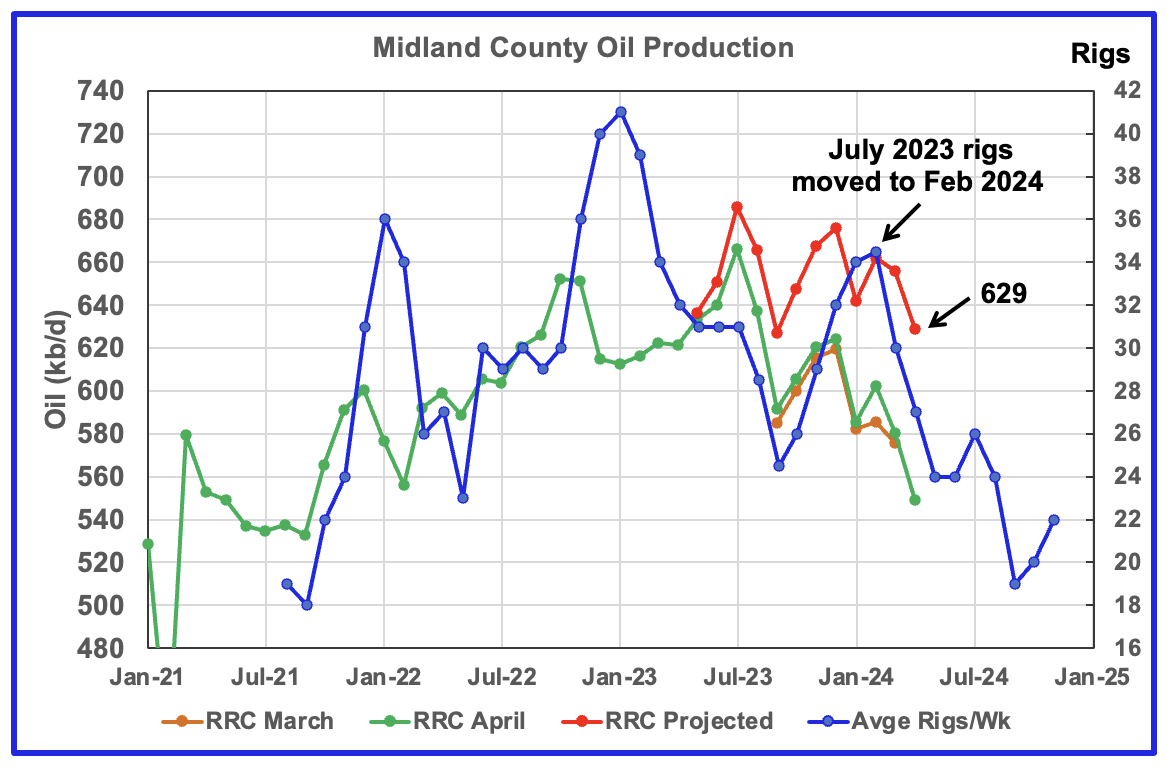
Midland County has peaked.
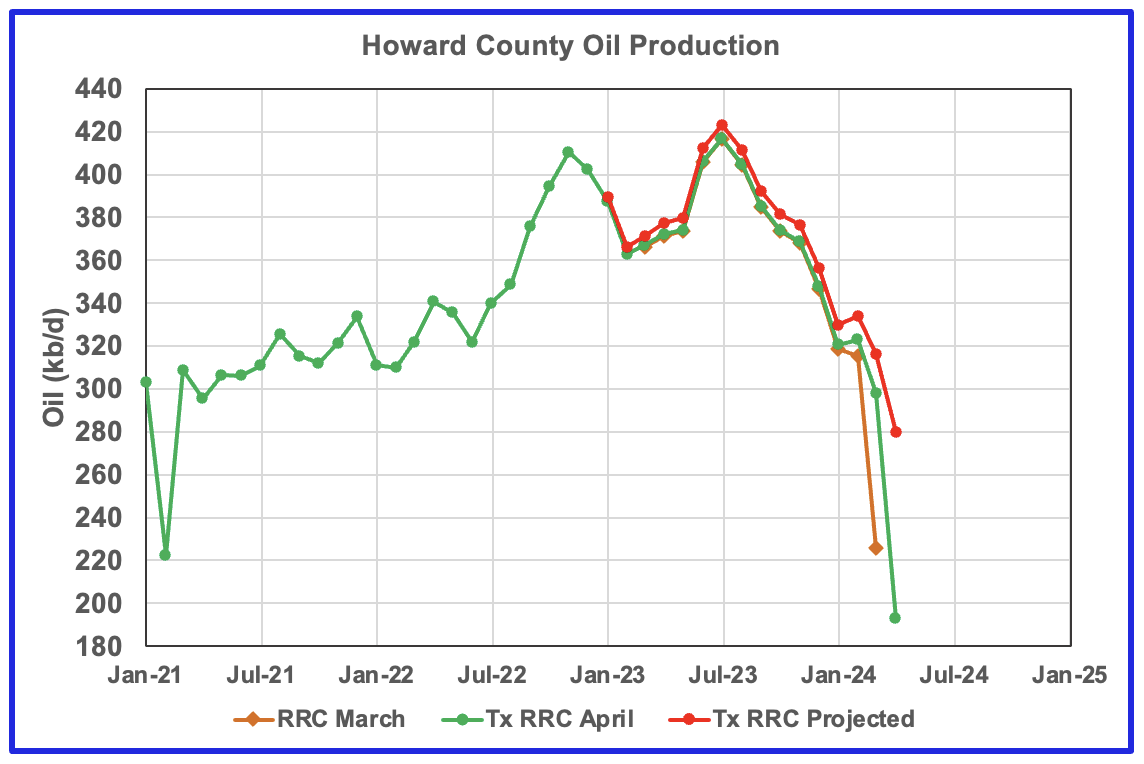
Midland County’s slow and steady declining oil production phase started in August 2023. The green graph shows April’s preliminary production as reported by the Texas RRC. The rising production starting in October 2023 is related to the rising drilling activity which started in May 2023. If correct, this implies Midland production peaked in July 2023. Midland county’s April production dropped by 27 kb/d to 629 kb/d.
The orange and green graphs show the production reported by the Texas RRC for March and April. Note that the last month in the April production graph is lower than the last month in the March production graph. This is why the projection shows April’s production is lower than March’s. Also this is an indicator that a county or district may be in a declining phase if this trend is repeated over a few months.
The blue graph shows the average number of weekly rigs operating during a given month as taken from the weekly drilling chart. The rig graph has been shifted forward by eight months. So the average 34.5 Rigs/wk operating in July 2023 have been moved forward to February 2024 to show the possible correlation and time delay between rig count and oil production. If the eight month shift in the rig count is approximately correct in that oil production can be tied to the rig count, oil production in Midland county should continue to drop for the next 5 to 6 months.
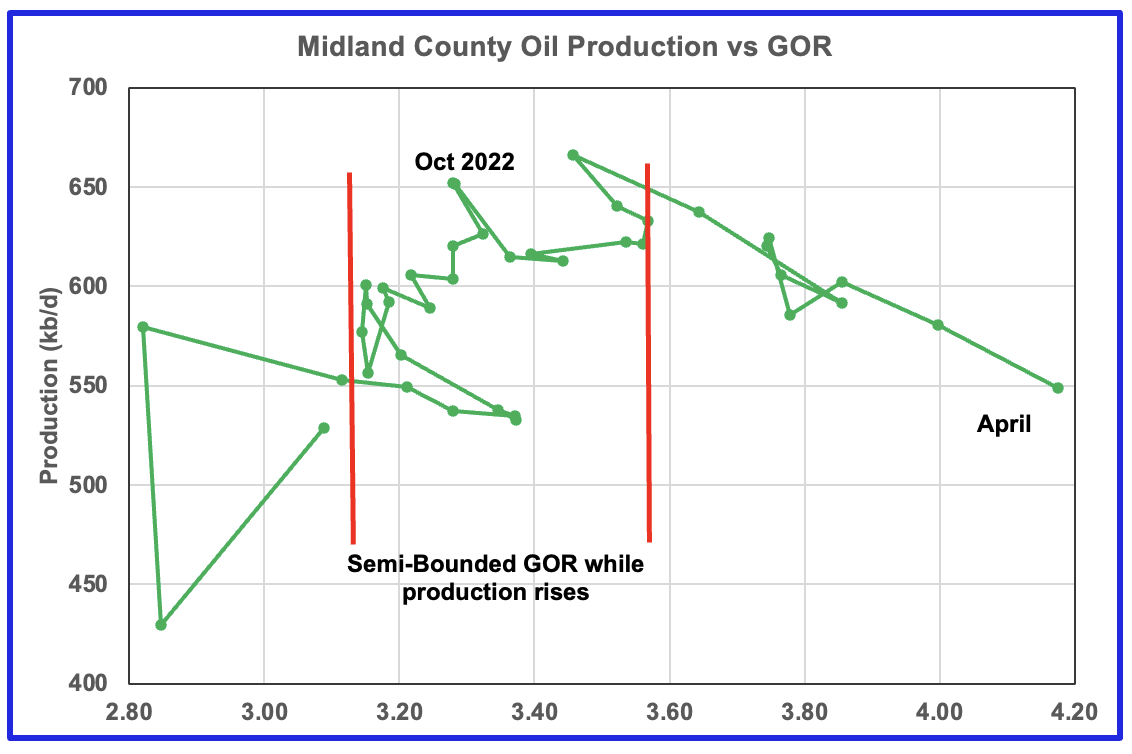
With Midland county deep into the bubble point phase, oil production continues to drop from previous highs, based on the previous graph, and should continue to drop. Note that oil production and GOR in this chart is based on the RRC’s preliminary April production report.
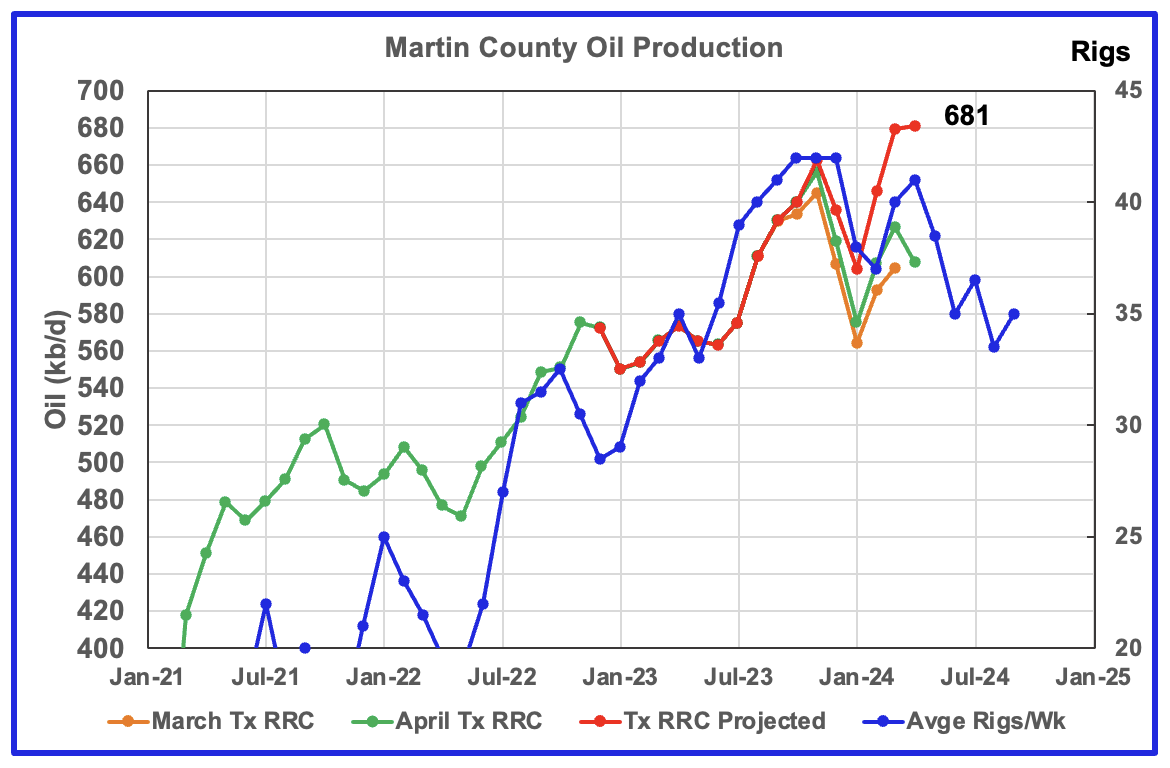
Martin County has peaked.
This chart shows Texas RRC oil production for Martin County. It was showing initial signs of peaking in November 2023. However projected March production exceeded November by rising to 681 kb/d. The production rise followed the increasing rig count according to the time shifted rig count.
The red graph is a production forecast which the Texas RRC could be reporting for Martin county about one year from now as drillers report additional updated production information. This projection is based on a modified methodology that used March and April production data and will be re-estimated each month going forward. Production should fall in May if production follows the rig count.
The orange and green graphs show the production reported by the Texas RRC for March and April. Note that in this case, the last month in the April production graph is higher than the last month in the March production graph and is why April production is slightly higher than March.
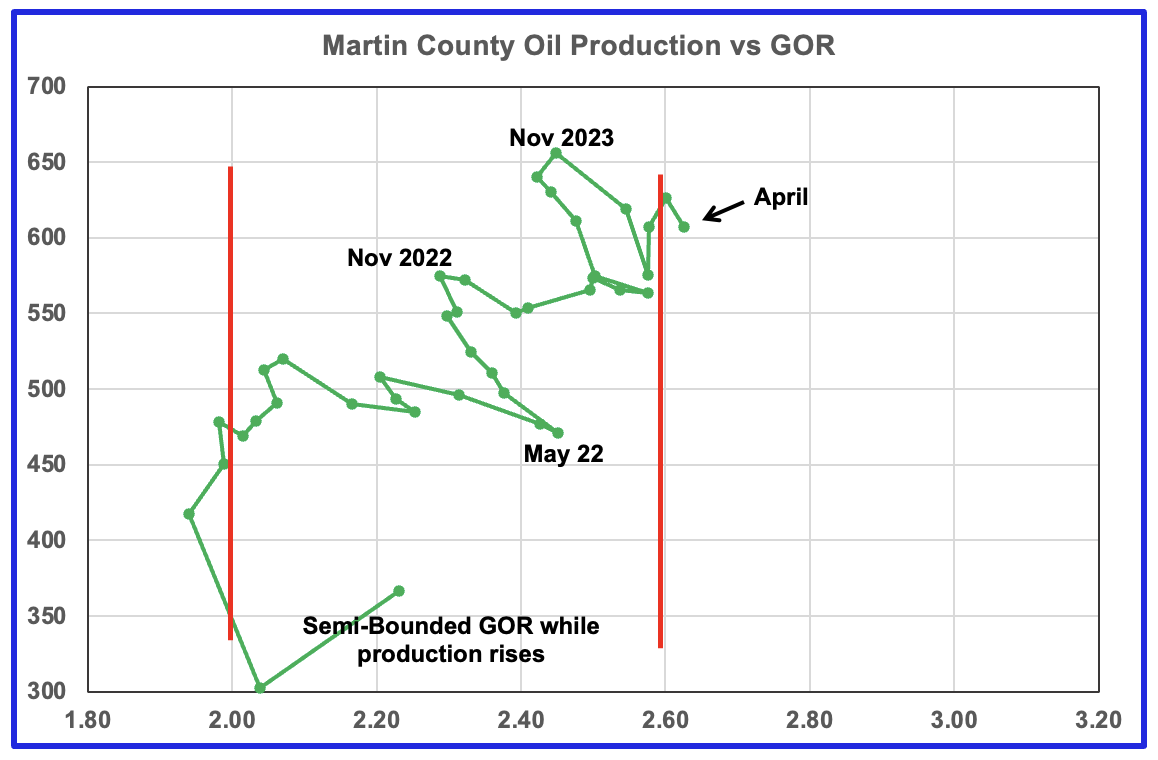
Martin county’s oil production and GOR up to November 2023 stayed within the semi bounded range and near peak oil production. However January, February and March saw production move higher while the GOR remained essentially unchanged at close to 2.6. April’s preliminary gas and oil production indicates that there was a small increase in the GOR above 2.6. Martin county has the lowest GOR of the four counties at a GOR of 2.60. Martin County may be on the verge entering the bubble point phase that should result in a dropping oil production trend.
Exactly where to put the right hand red GOR boundary for Martin county is not exactly obvious. It is possible that the right boundary should be closer to a GOR of 2.5.
Findings
– Lea County has peaked. May production will be flat or slightly down.
– Eddy County oil production peaked in February 2024
– Midland county peaked in July 2023
– Martin County has peaked based on the time shifted rig count
A note on assumptions. In the above charts of production vs rig count, the rig count has been shifted forward by 7 to 8 months and the assumption is made that production follows rig count. The underlying assumption for doing that is that no more or very few DUCs are being used. Also implicit in making the above calls is that the drillers and frackers are using the latest technology, i.e. 3 mile laterals, max proppant and chemicals and some refracs. I have no basis for assuming this assumption is correct.
Texas Permian
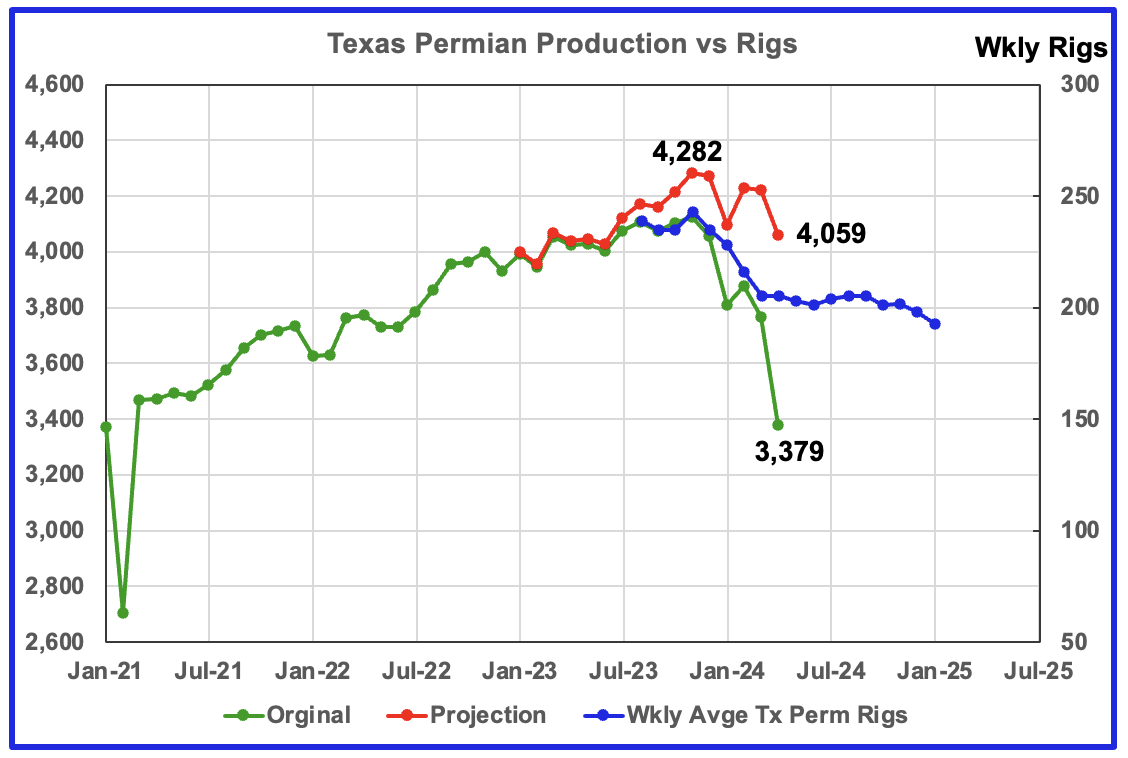
The original data for the Texas Permian comes from adding the production from Districts 7C, 8 and 8A as reported by the Texas RRC. The majority of the Permian resides within these three counties. Peak production occurred in November 2023 at 4,282 kb/d and has slowly dropped since then while following the rigs graph trend. April production is estimated to be down 223 kb/d from the peak.
Texas District 8
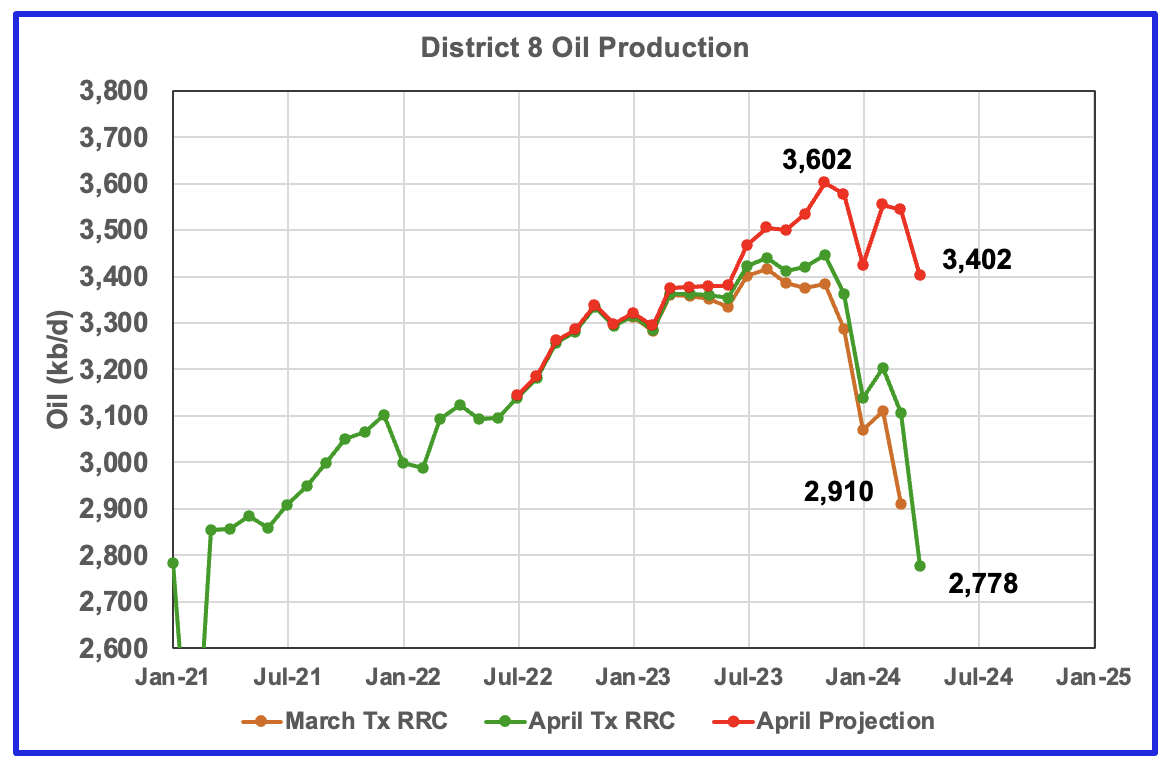
Texas District 8 has peaked.
Texas District 8 contains both the Midland and Martin counties. Combined these two counties produce close to 1,300 kb/d of oil. While these two counties are the two largest oil producers, there are many other counties with smaller production, Reeves #3 and Loving #4, that resulted in total production of 3,602 kb/d in November 2023. Essentially the Midland and Martin counties produce 1/3 of the District 8 oil.
This chart shows a projection for District 8 oil production. The red graph, derived from March and April production data indicates that oil production in District 8 has peaked. For April production dropped by 162 kb/d to 3,402 kb/d and is down 200 kb/d from the peak in November 2023.
The orange and green graphs show the production reported by the Texas RRC for March and April. Again note that the last month in the April production graph is lower than the last month in the March production graph. This is why the projection shows April’s production is lower than March’s.
District 8 accounts for more than half of Texas production. With April preliminary production being lower than March it is difficult to understand how the EIA projected Texas April production to be higher than March. Maybe they don’t use the Texas RRC data.
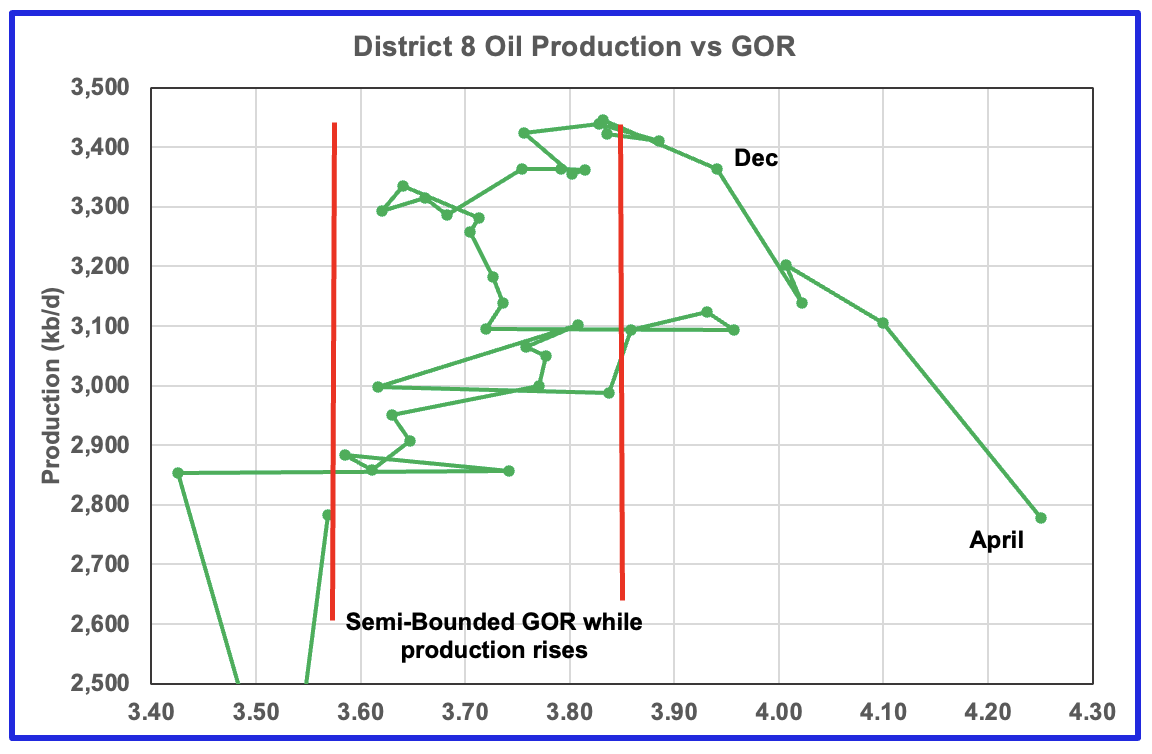
Plotting an oil production vs GOR graph for a district may be a bit of a stretch. Regardless here it is and it seems to indicate many District 8 counties may well be into the bubble point phase.
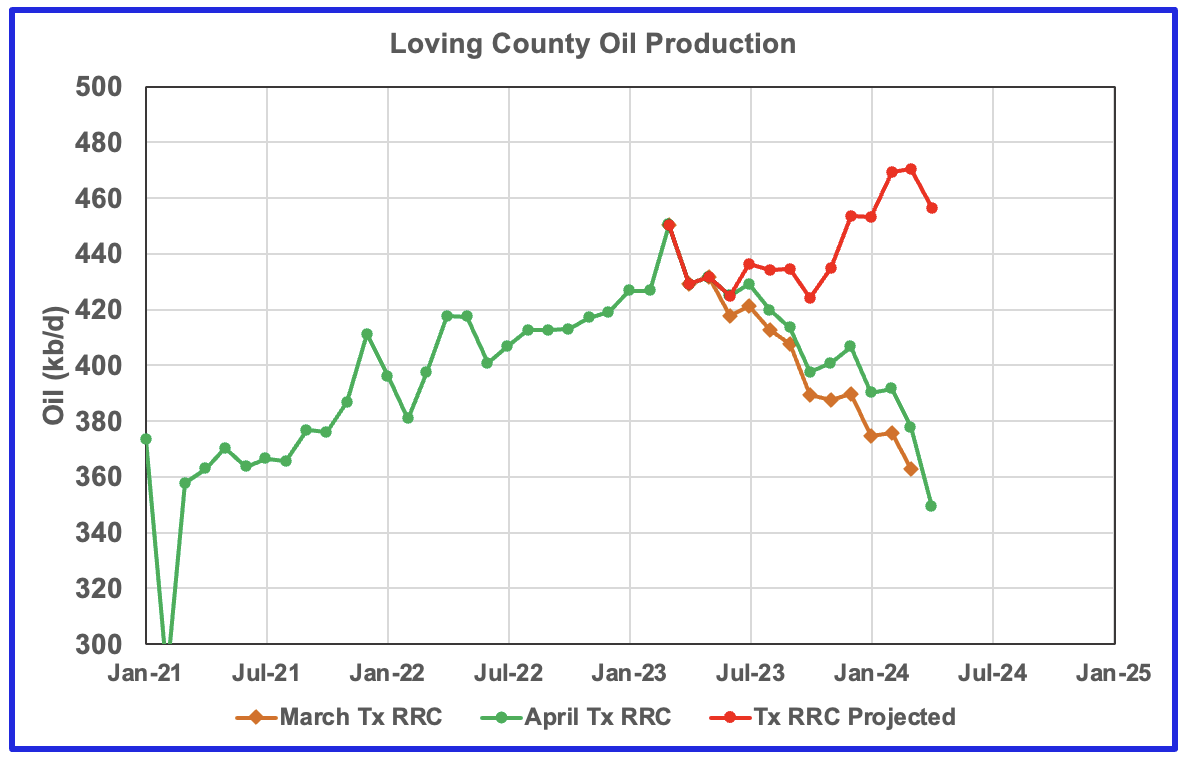
These three District 8 counties are ranked #3, 4 and 5 in terms of Texas oil production. Note that the last month in the April production graph for these three counties is lower than the last month in the March production graph. This is another indicator that these counties have peaked.

This chart captures Eagle Ford production by summing production from Districts 1 and 2 which cover most of the Eagle Ford basin. Production in the Eagle Ford is down from the March 2023 peak but has been rebounding in 2024.
Drilling Productivity Report
The Drilling productivity report that was published in June was in a new format and was included as part of the STEO and was not updated. It also appears that the DPR will only provide production information up the month preceding publication as opposed to the earlier version that provided data for the upcoming month after the publication.
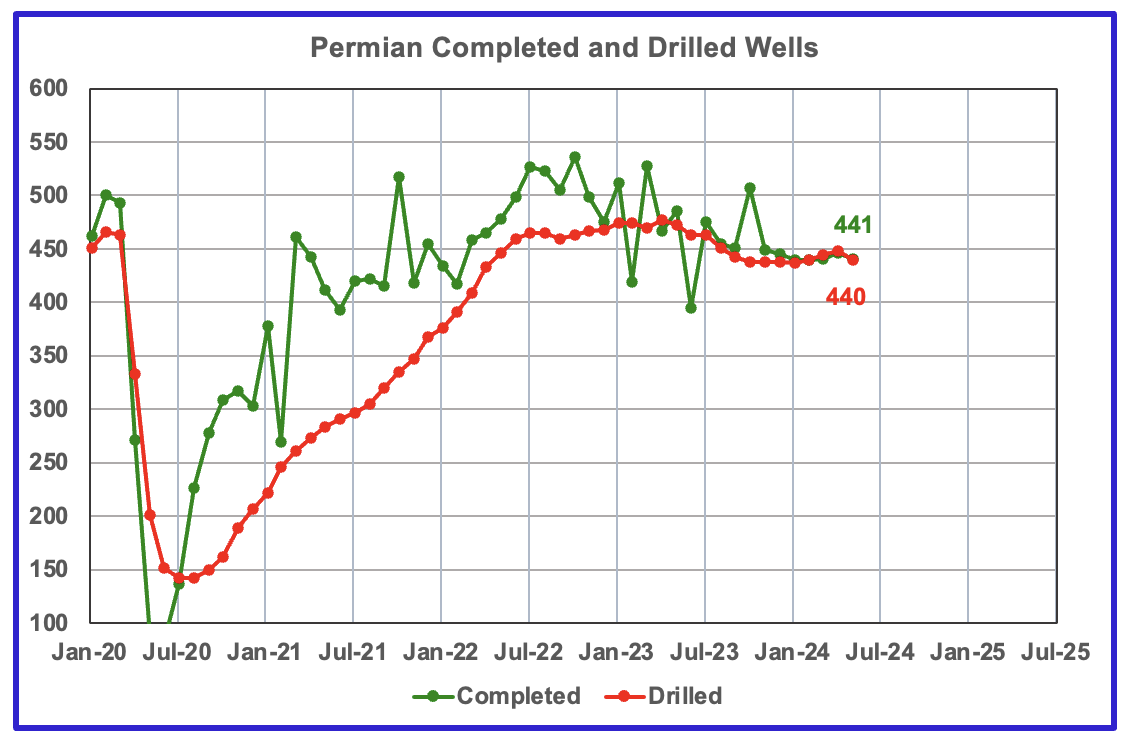
In the Permian section above, it is noted that rigs are being used as a predictor for future production trends because very few if any DUCs are being used. As can be seen from this Permian chart, 441 wells were completed and 440 were drilled in May, validating the assumption regarding the use of rigs to project production.
142 responses to “US April Oil Production Rose Again”
Great work Ovi!
https://www.oilystuff.com/forumstuff/forum-stuff/is-mike-or-ted-wrong-or-do-i-not-understand
Is the Williston Basin growing?
Andre DON’t KNOW!
Andre The Giant
Thanks.
Great work Ovi and Andre the GIANT!!!
The Novi’s hail of higher IP and Mike&Art’s deplore of the faster GOR rise and decline show one fact: the PVT is dominanting the production.
For the tight unconventional rocks to produce, fracing is needed, which convert the nano-pore trapped fluid to 10s micron or much larger and closer to conventional fluid. If the pressure in the well-bore (lateral vertical well tube) and the nearby frac stimulated rock volume (SRV) drops below the bubble pressure, then oil and gas separates (at #3 in the figure attached, and the number in the % is the oil liquid portion of original fluid), and oil are left behind in the SRV instead of at the Separator, and gas come out faster, resulting faster decline of oil and rise of GOR.
Before, the fracing size is smaller, so much of the nano-fluid still not fully converted to close-to-conventional fluid, and will slowly come out from the SRV in more or less unseparated fluid phase, and therefore although smaller IP, it enjoyed slower decline and GOR rise.
This process is extremely sensitive for volatile black to crtical volatile oil and condensate, and see the figure attached.
For low GOR black shale oil, the oil and gas phase separation is much less sensitive as shown in the figure here and therefore, the magic result like the high wax really viscous fluid like Lacustrine Uinta could outperform volatile black oil in Permian.
Sheng Wu
Thanks for the chart.
I think point 1 to 2 represents the GOR ratio in the Semi bounded region in the county charts above. The bouncing back and forth is due to the non-homogeneity of the GOR in the oil in different parts of the county. As the pressure across the field drops to point 2, the GOR pops out of the semi bounded region and continues to increase as it moves towardpoint 3 and further.
That is how it looks to me in general.
Ovi,
ShengWu’s charts are for individual wells. On a county-level, if more producing wells are at point 2 you will see that same GOR increase effect, but that doesnt mean that the whole county is at point 2 and that new wells are at point 2. The changing composition of old vs new producing wells by county could explain the small GOR increases very well, IMO.
Sheng Wu,
Thank you for your thoughts. I had come to much the same conclusion.Much of the that LTO is better described as a volatile oil
Great article, thanks Ovi!
Some notes.
1. EIA-914 is federal reporting, it’s different than Texas RRC. It’s a puzzle why the RRC data would be lagging more in April than in March. It is not a single-county issue, it’s in all counties except Martin. Interesting puzzle, lets see if in the May RRC we’ll see a catch-up for April.
2. I am not fully buying the GOR bubble point story. When production is stagnant or dropping due to reduced D&C activity you will also see increasing GORs, for the simple reason that base decline of gas is lower than oil decline. In other words, the more oil is produced from older wells vs newer wells, the higher the GOR. It is difficult to deconvolute from your graphs whether the increase of GOR is causing oil stagnation, or vice versa.
3. The reason Utah production dropped in Jan/Feb is that the Salt Lake City refinery was undergoing maintenance, and it is the main buyer of Utah oil. It’s not easy to get the oil out of Utah, as you said.
Kdimitrov
Thanks. I was a bit concerned with making those county calls but did it hopes of generating some feedback.
1: I think we will have to wait a few months to sort out the difference between the Tx RRC and EIA. With regard to the RRC, it is possible that they may have processed fewer days. Just a guess.
2: I think the GOR charts are interesting and exhibit different behaviour and it it difficult to interpret their behaviour. I am not a petroleum geologist and cannot interpret the difference in behaviour. However I think that once the GOR moves out from the red bars, the county is moving into the bubble zone. The one to watch is Martin over the next few months.
3: Thanks for the Utah explanation. Any idea on how long it would take to get to 440 kb/d. That is quite an increase.
Ovi,
Utah depends on when the train tracks are built; this is stuck in the courts now.
Once egress is resolved, I think it will ramp up pretty quickly. It’s heavy, paraffinic oil: probably the most valuable variety for the US refinery sector. They just cant get it out of the basin now…
Not US-related, but some new oil and gas fields, even unconventional, were discovered in Saudi Arabia.
The volumes of the discoveries are unknown.
https://www.upstreamonline.com/exploration/saudi-aramco-makes-seven-oil-and-gas-discoveries-report/2-1-1672183
Ovi,
where is the Red L48 line coming from? It’s not consistent with the top line: if I add April GoM and Alaska to it I get 13,157 bpd, not the 13,248?
Kdimitrov
It comes from the June STEO.
I see it now. Thanks!
SO the June STEO has total April USA down to 13,150 MMbpd, which would match your estimates, if TX production is lower, and is in disagreement with the PSM.
Interesting… I bet the STEO is based on state data, and they got pump-faked like you…
Ovi,
The EIA surveys the largest producers in most states (including Texas), they survey about 20 to 30 of the largest producers with output totaling about 90% of total production (in April 2024 and in March the survey data was 90.2% of the EIA 914 estimate).
The methodology is linked below
https://www.eia.gov/petroleum/production/pdf/eia914methodology.pdf
Spreadsheet with 914 data at link below
https://www.eia.gov/petroleum/production/xls/comp-stat-oil.xlsx
The EIA does not use RRC data for its estimates from June 2022 to April 2024, in August they will update using RRC data for June 2022 to June 2023, more recent data is based on the 914 survey reported directly to the EIA and the other 10% is based on historical ratio of Texas RRC data to the EIA 914 estimate using statistics as laid out in the methodology document.
Dennis
It is clear that the EIA uses a different source. I think Enverus does it for them.
Regardless the projection works fair well for Texas March production and totally breaks down for April. The only explanation that I can think of at this time is that the RRC processed fewer days in April. Difficult to believe this happened for all counties. This may sort itself out when the May data is posted.
I think this is a good explanation. April is one less calendar day, and you had Easter.. It may be useful to compare to last year’s April, to test the hypothesis.
Kdimitrov
I need back to back data for two months and this county tracking didn’t start till six months ago. As you can see it is a work in progress.
Ovi,
The 914 survey is sent to large oil producers in the State and the output is reported directly to the EIA. For the past 24 months (May 2022 to April 2024) the ratio of 914 survey data for Texas to the 914 estimate has been 89.2%, so about 11% of the Texas 914 estimate is from smaller producers that do not participate in the 914 survey and the rest is reported directly to the EIA. The EIA looks at Enverus data for the smaller producers that produce about 11% of Texas output and does a statistical weighted least squares estimate to arrive at their 914 estimate as laid out in the methodology document.
“In the Permian section above, it is noted that rigs are being used as a predictor for future production trends because very few if any DUCs are being used. As can be seen from this Permian chart, 441 wells were completed and 440 were drilled in May, validating the assumption regarding the use of rigs to project production.”
No offense Ovi, but I can’t believe that the above had to be said/people came to this realization. I remember last year when people were dumbfounded by the surge of production relative to rig counts. I dont remember who said it, but someone said “Major efficiencies in the shale basins” something to that effect.
Rig counts = production was true before and during covid and is and will be true from here on out. The charts show rigs were still drilling during covid and as we all know, many wells were Drilled but UnCompleted. It’s such an embarrasing oversight on everyone’s part except Mike Shellman.
Anyway thanks for your updates.
Anon
The rig count vs production correlation just gets more complex when DUCs are added to the mix. I think it is working now because of the balance between wells and DUCs. The next three to four months will be interesting to watch to see if the rig count vs production correlation continues.
In preparing to respond to your comment regarding the rig/production correlation I looked into the post above for a Texas chart I thought I had posted. It is not there and I realized I forgot to post it. It is attached and it just adds to the confusion.
Check the drop off in rigs vs the EIA production vs the projection. This is the first chart I updated when the Tx data came out. I thought for sure Tx production would be down. Then the EIA reported their results which left me totally puzzled. Let’s see what next month brings.
The rig chart is moved forward by 9 months.
Ovi, EIA doesn’t use RRC data for the 914. It is a direct survey.
Yeah, that’s an approach, to try one of these differencing models, but no guarantee it correlates always. This is long plowed ground. I forget the name of the Italian guy who used to post the same attempts–he still does, I think even though…he started before 914 even existed and has totally ignored a better approach (direct surveys).
I wouldn’t be surprised that you don’t always see the differencing model work for you. Try looking at more data points and I bet you find other months where the differencing approach failed.
It sort of reminds me of HFIR at Seeking Alpha thinking EIA must be wrong, when HFIR’s “corrections” don’t prove out properly.
Anonymous
Just look at the correlation from January 2023 to March 2024. I think it is reasonably good so I see no reason to try a different approach at this time as long as it doesn’t totally tank.
The issue is the huge difference for April. Let’s see what happens in May.
I can only compare all of Texas and New Mexico with the EIA data. Since NM compares well, I assume that Lea and Eddy counties must be OK. Texas after March is the issue.
Ovi,
Yes, the rig fit is quite tight. It’s a fascinating puzzle. Rigs/RRC/Ovi vs EIA!
I would be more willing to question the EIA PSM if their missing barrels (adjustment) was negative. However, it is positive for April. So if they are wrong on production, they must be extra wrong somewhere else for their balances to work…
Regarding MT, it’s interesting that it’s production is higher now, then it was pre-pandemic. Granted, a small state. Still…interesting.
“US production has been flat since September 2023.” [in bold]
Well, it’s well known that there is some component of seasonality in US oil production. What does YOY production look like? Up 0.6 MM bopd.
Anonymous
I am looking at a possible peak in US production in the next few months. The past may not repeat itself.
I get it…that someone on a site called “peak oil” barrel…might be looking for peaks. I caution you about conflating temporary effects (e.g. seasonal or financial) with systemic ones. There is a long, long, longitty-long-long history of failed peak calls, for these two reasons.
And the explanation was usually “Yes, I know that seasonality (or commodity price) has an effect, but it’s just overlaying the peaking itself”. And then they were wrong. Over and over.
I think we had this exact discussion about the FEB data. And at that time, the TTM delta was 0.6 MM bopd. Two months later…and still 0.6 MM bopd.
[First column is month, second column is US production in M bopd, third is the yearly change, and fourth is the monthly change.]
Apr-2023 12650 880 -120
May-2023 12694 960 44
Jun-2023 12894 1094 200
Jul-2023 12925 1091 31
Aug-2023 13041 1056 116
Sep-2023 13247 922 206
Oct-2023 13219 841 -28
Nov-2023 13295 919 76
Dec-2023 13264 1126 -31
Jan-2024 12553 -15 -711
Feb-2024 13102 570 549
Mar-2024 13176 406 74
Apr-2024 13248 598 72
FWIW, there was a VERY significant drop in JAN24, that definitely was weather related and that we’ve recovered from, now. Stand by for some stronger summer months, along with ND hitting 1.3.
If you wanted to make a point instead, that rate of growth has dropped, I’d buy it. But peaked? When there’s known seasonal issues and a miserable weather hit in JAN (with some smaller ND wells/pads shut in and not turned loose until spring)? Nah.
I’ve been following this for a long time…and it really is Groundhog Day.
P.s. I appreciate the charts and the work…but a man should understand his limitations, also. Dunning Kruger. It should give you pause that you didn’t know the 914 methodology (the RRC comment), despite it being public and oft discussed.
Peak Global Combustion (all fuels including dung) Day-
July 27th, 2034
Write it down.
I’ve been told I’m wrong, and that it will be in June 2037.
Anonymous
I know what I don’t know. I was a bit concerned with making those county calls but did it in the hope of generating some feedback, both Pro and Cons, and getting back to oil rather then wind/solar/cost. In looking for a peak, I am not predicting a Seneca cliff, more peak/plateau.
I think it worked. Thanks for disagreeing.
The great thing about this board is that participants agree or disagree in a gentlemeny manner.
Not totally clear on your 914 comment. My undestanding is that Enverus does a sample survey for EIA. What I didn’t know was that the Enverus survey was buried within something called a 914 survey. I didn’t know that it was exclusive and that they totally ignored the RRC for the current year. Their problem. Regardless I could do nothing about that and decided to provide a different method to spice things up.
Ovi,
I think the EIA pulls data from Enverus for the companies it does not survey directly and for some of the smaller producing states (where a different methodology is used to estimate production).
From Jan 2023 to April 2024 about 91% of US output is reported directly to the EIA in the 914 survey on a monthly basis, the other 9% of output is estimated statistically using data from Enverus (collected from state agencies).
Dennis, agreed.
Ovi, this is actually my gentlemanly. 😉
It’s not the end of the world, but still was a fundamental lack of understanding of the 914. It’s a 90% DIRECT SURVEY, and then they have a model for the last 10% (not completely sure what is in there, maybe Enverus, rig count, etc.). RRC data is only used very far in hindsight, maybe 12-24 months out. There is some historical correction process. But they definitely don’t use the initial RRC data or month ago…it’s a different animal from that. That was the fundamental upgrade to go to a direct survey, versus differencing models or the like. Done at considerable expense to the industry and EIA.
Anyway, hope you know now. If not, just sit down and read the actual methodology details. But don’t just assume they do things how you would naively assume they do them.
Dennis/Nony
Understanding the details of the 914 survey does me no good. Not sure how it would help me. I am trying to do something which I thought was new. After showing Dennis what I had done he replied that he thought it was similar to the analysis Dr Fantazzini had developed and published on POB earlier.
Also there is the issue of the accuracy of industry information. They are known to make mistakes. The weekly API numbers and EIA numbers on occasion are out by a lot.
As for using 12 month linear analysis, there are times when it is useful and times when it’s not. When you look at rigs rolling over big time, one has to ask is it appropriate to use linear analysis to predict future production? Predicting the future is not easy and risky.
Let’s just sit back and rehash this discussion s few months down the road.
I assume you have read Ron’s post further down on slowing US production.
If you understood the methodology, you would not “assume” that they are doing something, they are not doing.
You should know what you are graphing.
This RRC differencing approach is very well plowed. You should know more about the history of that…and that the (somewhat expensive) direct survey method was created to improve over these issues.
You should have a curious mind about what you are analyzing. You should be interested in what EIA does. MAybe there are flaws in it. But to not even examine it? Maybe there are good things about it…and you aren’t even bothering to look for them.
I’m not saying you can’t try alternative analyses. That’s fine. But have some perspective on them, that they are trial analyses. And don’t be so wedded to them, that you ignore basic concepts.
Nony
You seem to be concerned about some inconsequential statements I made about the EIA which I still don’t get since it has nothing to do with the analysis.
There is a theory that says the more you know of the past, the less likelihood there is to innovate. Consider if I had studied the 914 surveys and knew all of the details like you do. I think that I would have come to the conclusion that I couldn’t do better and probably the new Permian section would never have appeared.
Instead I just kept working with what I had, data sources which I kept on analysing, RRC and NM county data. At some point I came up with new charts, which were also criticized for being non-standard, and then later something I thought was a new analysis but which wasn’t. So I decided to put it out there in the Permian section for what it is worth and let the charts do most of the talking.
Consider this statement: “This RRC differencing approach is very well plowed. You should know more about the history of that…” Again If I knew about that methodology and all of its pitfalls I again may not have tried to do something new and the Permian section would not be there. Another case where more knowledge reduces curiosity.
I guess we should agree to disagree. I have my ways of doing things and you have your ways and never the twain shall meet.
Ovi,
I agree linear trends rarely continue for long. I was pointing out how the 914 estimate is done, you asked the question in the post, so I answered. Note that the RRC and all state agencies gets their data from industry, the difference on the 914 survey is that only a small set of the largest oil companies are surveyed, historically the 914 estimates have been very good, you can easily compare the 914 survey with Texas and New Mexico state data to prove this to yourself.
This may seem like a bit of mathematical nit picking, but linear regression might not be the best model for predicting oil production because it allows negative values.
It’s hard to see a real world scenario when oil wells are producing a negative amount of oil.
An alternative is to look at percent changes in output (instead of raw output numbers) and base predictions on that. That at least has the advantage of never predicting negative numbers.
Alimbiquated,
A linear model will never be accurate for all input values in the real World, it simply describes the data over some interval of input data in a rough way, over long periods for some data sets the linear model results in better correlation than an exponential model.
In short, I do not agree that in general the exponential is the better model over short intervals. I do agree it will not be a general solution, a more complex model would be needed.
Nony,
From May 2022 to April 2023 the annual rate of increase in US C plus C output was 1093 kb/d. From May 2023 to April 2024 that annual rate of increase was 317 kb/d, both cases OLS was used on 12 months of data to determine the trend.
So yes the rate of increase has slowed by a factor of 3. The falling rig counts in the Permian basin may lead to further decreases in the future rate of increase, perhaps falling to zero over the next few years.
I think lower demand and stagnant future oil prices may lead to a falling completion rate in US tight oil basins.
I like your analysis. I think making a comment on slowing growth is much more apt than “peak calling”.
I think I said that before. But in any case…”you go, girl!” 😉
Got a DUC count trend chart perchance? Appreciate the post as always!
JB
Attached is a DUC chart using data from the June STEO. Many participants on this board believe that most of those DUCS are dead DUCs. Regardless, it is the trend that counts. DUCs are flat from January 2024.
Why U.S. Oil and Gas Production Is Slowing Down
Slowing drilling activity in the U.S. shale patch is capping oil production growth while natural gas output is down from year-ago levels amid above-average inventories and unsustainably low prices earlier this year.
Oil and gas prices have dropped since the highs from the summer of 2022 when they spiked following the Russian invasion of Ukraine.
The decline in U.S. benchmark oil and gas prices over the past nearly two years has reduced – with a lag – drilling activity in the shale patch. America’s oil and gas production hit record highs at the end of 2023 and continues to be close to all-time highs, but growth has slowed down in oil output while gas production has started to fall after a mild 2023/2024 winter boosted inventories to above-average levels and sunk Henry Hub gas prices to $1.80 per million British thermal units (MMBtu) in February 2024, compared to $9 / MMBtu in August 2022.
Crude oil production from the Lower 48 basins, which exclude the federal offshore Gulf of Mexico, increased by 500,000 barrels per day (bpd) in April 2024 from the same month in 2023. But in April last year, the annual growth in the Lower 48 output stood at 900,000 bpd, per EIA data cited by Reuters market analyst John Kemp.
The number of oil rigs currently stands at 479—down by 66 compared to this time last year, according to the latest Baker Hughes data.
Despite the decline in the number of oil rigs, U.S. oil production has grown compared to year-ago levels, mostly thanks to efficiency gains, analysts say.
Amid the ongoing consolidation in the American oil and gas industry, producers have become bigger and are focusing on shareholder returns. They wouldn’t be inclined to respond to every price spike with a major boost in drilling that ultimately floods the market with oil and depresses prices.
This is less than half the article. Click on blue link above to read the rest.
Permian oil (conventional and tight) on right axis in Mb/d with STEO forecast starting April 2024 (starting at 6.3 Mb/d as shown on chart) with horizontal oil rig count i Permian Basin on left axis. This chart includes both Texas and New Mexico Permian regions. The linear trend for Permian output over the period on the chart is an annual increase of about 550 kb/d. The high point in Jan 2025 on the chart is 6.51 Mb/d about 210 kb/d higher than April 2024 output (as estimated by the DPR).
Dennis
You beat me to it. I was going to ask you to prepare a shorter period for the Permian.
Thanks
Slight revision to first projection posted (which I deleted) below.
Permian basin projection based on correlation of horizontal oil rig count to output for 2 different periods (Jan 2022 to December 2024 and Jan 2023 to March 2024), horizontal rig count shifted forward by 8 months. I believe the second shorter 2023 to 2024 period results in a more realistic projection. Potentially the STEO forecast may be roughly correct and may assume gradually improving rig efficiency (more wells drilled per rig per week over time).
Left axis is average horizontal oil rigs (HOR) operating per month and right axis is tight oil output in millions of barrels per day
Hi Dennis,
there are three ways, by which aggregate rig productivity goes up.
1. Compositional, when rig counts go downs. Generally, companies drop the oldest and the least productive rigs, resulting in higher average productivity of the remaining fleet.
2. Workflow. the more wells per pad and the longer laterals result in more oil production per rig per month, as rigs spend less time on setting up and on drilling the vertical part of the well, and more time drilling the horizontal pay. This is happening continually.
3. Technical. As rigs churn, the new rigs are bigger and faster.
So yeah, the STEO is probably taking all of this into account.
Kdimitrov,
Currently where there is likely excess frack and rig capacity and average lateral lengths are not changing very much we might be seeing some of the first effect you mention, but less of number 2 and 3 in the short term with horizontal rig counts not changing by very much at least in the Permian basin which dominates tight oil production in the US. In the short term I don’t think average rig productivity will change much in the Permian basin from October 2023 to April 2024 (affecting output 8 months later fromMay to December 2024.)
Just a guess on my part.
Hi Dennis,
I sort of agree with what you’re saying, but I can’t understand your chart. If the maroon triangles are trained on the Jan’23-Mar’24 correlation, shouldn’t they start from April ‘24?
In any case, the Jan-Apr data is historical and your model fails to replicate it…
Could you, please clarify?
It will be interesting to see next week’s STEO. I sort of agree that with these current rig counts H2’24 is probably looking as flat at best…
Kdimitrov,
The correlation is on Jan 2023 to March 2024 data, the earlier points are shown as a test of the model, as you are no doubt aware the models are never perfect, note that both models fail, and also note that data from recent months often gets revised, data is also not always perfect. My guess is that output will be flat, but perhaps at close to the Feb or March level reported by the DPR, rather than the level of my simple model based on rig count. Sometimes the DPR model is not all that good and that is the Permian “data” reported in the STEO, so we are actually comparing one model with another the STEO estimate for the Permian region uses the DPR model.
Russia C+C and Russia Crude Only. Crude Only before January 2024 is estimated. But after that, it is from the OPEC MOMR.
Hi Ovi,
Dr. Fantazzini just published his correction, and it is interesting.
His “all data” correction is very similar to yours.
However, his “12month” correction is very similar to EIA.
So looking at the graph, it looks like in the last 12 months or so the RRC data is becoming more laggy and the historical correction factors don’t work as well…
https://x.com/DeanFantazzini/status/1809261224883892270/photo/1
The data for oil catches up in about a month, however for condensates seems to be lagging for longer…
Kdimitrov
Thanks. Not sure what his definitions are. I do Jan 2021 to April 2024. That could be close to his corrected all data vintage estimate which is close to mine.
I will try to look up his methodology.
Ovi,
Dr Fantazzini has been doing these estimates since 2015, so all data may be Jan 2015 to April 2024
see
https://peakoilbarrel.com/texas-update-november-2017/
Data from April 2014 as of November 2017, this might have changed since 2017.
Dennis
Typically the January to March 2021 differences start at zero.
Hi Ovi,
Dr Fantazzini’s methodology collects many monthly data sets (back in Nov 2017 it was about 40 datasets with 24 months of data in each data set, he looked at cumulative differences for T-1 to T-24 and then would average these differences over the 40 datasets, that would be his all vintage estimate.
Ovi,
I sent you an email with Dr. Fantazzini’s data from July 2017 (data goes back in time to 2014 or so). I cannot find a newer spreadsheet, when I realized the EIA estimates were quite good, it seemed unnecessary to pursue Dr, Fantazzini’s approach. For county estimates you could use % of county to state total and then multiply this percentage by EIA 914 estimate, especially for Texas this would be more accurate, the New Mexico data does not lag as much, but I would use that approach there as well and at least compare it to your method as a check.
Some info on the Uinta. Looks pretty good, actually.
https://novilabs.com/wp-content/uploads/2024/06/Sigler_Fidler_Cross_URTEC_2024_vF1.pdf
You may need to register, if so, https://novilabs.com/resources/urtec2024-unpacking-the-uinta-basin/
Is the Ukraine war based on anticipation of post peak oil decline?
Russia investing heavily in world’s largest oil reserves in Venezuela
https://www.atlanticcouncil.org/in-depth-research-reports/report/russias-intervention-in-venezuela-whats-at-stake/
“Putin is willing to subordinate economic interests to geopolitical advantage and has done so in Venezuela.”
https://apnews.com/article/venezuela-russia-navy-ships-cuba-d594c7c8fc97a903e5dc90754970b8c0
“Two Russian naval ships docked Tuesday in the Venezuelan port of La Guaira after exercises”
The Rig report for the week ending July 5
– US Hz oil rigs decreased by 3 to 428. This is the ninth consecutive weekly drop. The rig count is down 31 from 11 weeks ago and is the lowest since January 22 when the rig count was 434 and rising after the Xmas break.
– The Texas rig count dropped by 2 to 234 rigs and is down 92 from January 2023
– Texas Permian dropped 2 to 188 while the New Mexico Permian dropped 1 to 101. The Texas Permian is down 56 rigs from the 2023 high of 244 in April 2023.
-– In New Mexico Lea was unchanged at 50 while Eddy dropped 1 to 50.
– In Texas, both Martin and Midland counties were up 1 at 31 and 19 respectively.
– Eagle Ford added 1 to 44.
– NG Hz rigs added 2 to 88. (Not shown).
Frac Spread report for the week ending July 5.
The frac spread count rose by 5 to 242 and is down 18 from one year ago. It is also down by 30 spreads since March 8. The overall trend in frac spreads appears to be down.
Will this dropping trend reversal continue over the next month or two?
Saudi Crude Oil Exports Slump to 10-Month Low
The world’s top crude exporter, Saudi Arabia, shipped the lowest volumes of oil in June for ten months as Saudi domestic consumption grew and Russia continued to take market share from the Kingdom in key Asian export destinations.
Saudi crude oil exports fell to 5.6 million barrels per day (bpd) in June, tanker tracking data compiled by Bloomberg showed on Friday.
This export volume is only 250,000 bpd more than the low Saudi exports at the beginning of the pandemic in 2020, according to Bloomberg’s estimates.
Earlier this week, tanker-tracking data compiled by Bloomberg showed that falling crude oil exports from Saudi Arabia accounted for half of the 1 million bpd drop in global seaborne shipments in June compared to May.
Saudi Arabia led the global decline in crude shipments, likely because of burning more oil domestically for power generation as it typically does every summer to meet soaring demand for air conditioning in the hottest months in the desert.
Saudi seaborne crude oil shipments thus fell by 529,000 bpd to 5.606 million bpd in June, down from 6.135 million bpd in May, according to the data compiled by Bloomberg.
Apart from the seasonal low in Saudi exports due to higher demand at home, the Kingdom’s shipments faced stiff competition from OPEC+ ally Russia, which boosted its exports to the key Asian markets, China and India.
India’s crude imports from Russia rose to 1.97 million bpd last month, the highest since July 2023, per data from Vortexa cited by The Hindu Business Line.
China’s overall crude imports disappointed again in June, Vortexa’s senior market analyst Emma Li wrote in an analysis on Thursday.
However, the recent government mandate for stockpiling additional 58.5 million barrels of crude in majors-operated storage by March 2025 will likely support additional imports from Russia, Li said.
“The new SPR mandate will likely support Russian crude imports into China, as oil majors are cautious about touching other US-sanctioned discounted crude grades, while oil benchmark prices breaching $85/b will challenge the stockpile economics,” the analyst wrote.
It appears that the Saudis are so far willing to let Russia have a larger market share in India and China as a price the Kingdom has to pay for the OPEC+ alliance to support oil prices, Bloomberg’s Julian Lee notes.
Are the Saudi’s really just letting Russia have a greater market share, or is all the fabled “spare capacity” just not there?
Given that Ghawar was down to 3.5Mbbls/d 5 years ago, is it not reasonable to assume that depletion is taking it’s toll on Saudi production, until they prove they can supply a lot more for a continuous period?
Russia is not getting greater market share globally, just in Asia, because of the realignment of flows. Russian market share in the EU/USA is close to zero now (small flows to Hungary and Slovakia only).
Globally, the export share is only rising for American producers: US, Canada, Brazil, Guyana.
I think Saudis are OK to wait on the US and Brazil flows to peak, as they probably share the views from this blog that this is imminent.
According to the OPEC MOMR, Russian crude only was down almost three thousand barrels per day in the last two months, from March to Mahy. I really don’t think their market share is increasing very much.
March .. 9,476
May……. 9,182
Dif………. -294
Chart below compares the EIA 914 estimates for Texas and New Mexico with Texas and New Mexico’s state agency data for C plus C from Jan 2015 to March 2023. The correlation coefficient is 0.9992, if we sum up all the data over this period and compare 914 to state data the 914 estimate is 0.19% lower than the state data. Mostly the 914 estimates are quite good, note that it is the EIA final estimate which gets revised to match the state data, these are the initial estimates made by the EIA using the 914 survey.
Permian estimate using EIA and TX RRC and NM OCD data, this includes conventional and tight oil from Permian region.
OPEC + Production Cheats Show Little Sign of Making Compensation
From May, Iraq and Kazakhstan promised both to adhere to their assigned limits, and cut substantially below these levels each month to make up for overproduction since the beginning of the year. But neither country has so far hit their initial quota, let alone begun the work of compensation.
Baghdad pumped about 195,000 barrels above its target in May, at 4.195 million a day, while Astana produced an excess of 43,000 a day, at 1.511 million a day, according to OPEC’s latest monthly report. Data compiled by Bloomberg indicate that Iraq continued to overproduce at a similar level in June.
Both countries have a long history of chafing against OPEC+ quotas, as Iraq seeks revenue to rebuild its war-shattered economy, while Kazakhstan rushes to monetize new capacity, such as the $48.5 billion Tengiz oil field project led by Chevron Corp.
https://www.rigzone.com/news/wire/opec_oil_production_cheats_show_little_sign_of_making_compensation_cuts-07-jul-2024-177318-article/
It may just be my opinion, but I believe every OPEC+ nation, including Saudi Arabia and Russia, is producing at or very near its full potential. Saudi Arabia may have a tiny bit of spare capacity, but Russia has absolutely none.
Ron,
I agree on Russia, but think you may be wrong for OPEC Big 4 (KSA, UAE, Iraq, and Kuwait). Spare capacity is probably about 2500 kb/d.
Hilarious! Not even close, Dennis. But I thank you for the most humorous comment of the day. There is a little spare capacity among the big 4, but about one million barrels per day at most.
Correction, I was estimating from memory. Spare capacity for Big 4 is about 2254 kb/d, in October 2022 the centered 12 month average output was 20849 kb/d and in May 2024 output was 18548 kb/d, so I disagree with your 1000 kb/d estimate. KSA has 1000 kb/d of spare capacity alone (at minimum) I am confident that there is at minimum 1000 kb/d of spare capacity in the other 3 big 4 OPEC members, we will only really know if quotas are removed what actual spare capacity is.
KSA has 1000 kb/d of spare capacity alone
I agree. And that’s it.
Scenario below is for tight oil only from Permian basin (approximately 500 kb/d of Permian region output is conventional C plus C) using my tight oil model and rig counts to estimate completion rate from April to December 2024, after December 2024 I assume the rig count remains at the December 2024 level for all of 2025 and also assume there is very little change in the DUC inventory level over the entire April 2024 to December 2025 period. All assumptions are likely to be incorrect.
Damn good model Dennis. I think you are getting a lot better with your projections. Congratulations on such great work.
Ron
Maybe we are beginning to agree that a peak in US production may not be far off.
Ovi,
I agree that looks likely if horizontal oil rig counts do not increase much in the future. Difficult to know what happens in the future. I have been too pessimistic in the past and may be repeating that tendency.
Thanks Ron.
Dennis
Looks like your Permain model is showing a peak for March production and a small drop for April and a bigger one for May.
Is the April drop due to the New Mexico Permian drop overpowering a slight Texas increase?
What is your Rig time shift, seven or eight months.
Ovi,
I am using an 8 month rig shift, the drop after March is due to fewer completions due to a lower rig count, I have assumed about 1.4 wells drilled per rig and that competions will be equal to wells drilled (but shifted 8 months into the future). I use my Permian tight oil model with the completions, but with lower new well productivity (or new well EUR) with the annual decrease in new well EUR at about 3.7% per year in 2023 and about 3.4% in 2024 (due to lower completion rate) and to 3.3% in 2025 (due to an even lower completion rate).
Dennis
Thanks
Does your model use the the same well profile for Texas and NM?
Ovi,
Yes, I use an average well profile for the entire Permian basin. as in chat below for Jan 2022 to Dec 2023, after that average well profile assumed to decrease.
very interesting. Thanks, Dennis!
NOVI actually has an increase in new wells production for 2024, after the declines in 2022 and 2023. I think this is because of the M&A consolidation wave the last couple of years: now more wells are brought online by larger/public companies and they tend to be larger wells with larger completions and better D&C designs
Kdimitrov,
For the Permian productivity per lateral foot has been decreasing since 2016, they are not making any more rock volume, so longer laterals simply means fewer potential drilling locations as it chews up rock volume more quickly. Here are average Permian well priles from 2020 to 2023, 2020 and 2022 are quite similar.
Correction,
The well profile remains at the level shown in the chart for Jan 2022 to Dec 2022, the decrease in noew well EUR starts in Jan 2023.
Thanks for the Permian graph Dennis, impressive work. As I believe production will always depend on break even price that some wrote now is about 84 usd for Permian WTI.
https://www.artberman.com/blog/bakken-break-even-prices-threaten-profits/ Than as we have seen the latest year there have been a positive developent in drilling productivity, could be interested to see a graph for this. When the best spots are drilled break even price will increase because you get less oil from each well drilled each foot. Than adding inflation, more exspensive labour cost, equipment, lease rent for the ground. To keep this going drilling need to be done more cost effective and I believe that has a limit or at least the lowest hanging fruits have been taken than break even price at well head will increase and production will drop faster.
Freddy,
Thanks.
My expectation is that oil and natural gas prices may rise just enough to keep new wells profitable, but not so high as to lead to an increase in the completion rate. My guesses are often incorrect so the completion rate may start to decrease either sooner or later than I have guessed (currently my guess is a decrease in the completion rate will start around Jan 2030.) It is always difficult to predict future prices, costs, and technological changes.
Dennis,
I don’t think this is true. Here’s teh IP90 chart from NOVI. There is an uptick in 2024, even when normalized per foot. Also the decline started post-2021, not in 2016
Another question: is your model based on # of wells, or lateral footage? The well lengths are still creeping-up, so I don’t think you can model new well production decline, if you are modelling wells….
Kdimitrov,
If you look at the well profiles for 2020 and 2022 they are nearly the same (these are not normalized for lateral length) with 2021 being somewhat higher, I also do not believe using the 90 day cumulative is the best metric for EUR, using 6 or 12 month cumulative gives more reliable results. I am using wells for productivity and do not have normalized data, my guess is that the average well length will stabilize as there are limited locations with the potential for longer laterals.
See chart a few comments down thread.
Permian well productivity from most recent Novilabs blog post, not normalized for lateral length.
Also see
https://www.eia.gov/todayinenergy/detail.php?id=54079
Permian normalized well EUR using Novi data for estimating well profiles and EIA data for lateral length from
https://www.eia.gov/todayinenergy/detail.php?id=54079
The high point for normalized well EUR was 2016, based on these estimates.
Mistake on 2022 well which should be EUR=432 kbo, EUR/10k=429 kbo.
well profiles for permian wells for 2020, 2022, and 2023 from Novi labs
https://novilabs.com/blog/permian-update-through-jan-2024/
https://public.tableau.com/shared/TC6D6SQG7?:toolbar=n&:display_count=n&:origin=viz_share_link&:embed=y
Part of my tendency for pessimistic projections in the past was my expectation back in 2012 that new well EUR would decrease in the near future, but EUR did not start to decrease until 2022 in the Permian Basin (when wells are not normalized for well productivity). Also lateral length increased by more than I expected, but note that if we double lateral length from 5000 to 10,000 feet, the potential number of wells is reduced from maybe 200 thousand wells (at 5000 feet) to 100 thousand wells at 10 thousand feet lateral length, so the overall EUR for the basin may be unchanged if the average EUR per foot of lateral remains constant in this example.
yes, but we’re talking about your model of #rigs x 1.4 wells/rig x production per well.
For that model matters how long/productive the wells are
Yes the well productivity for wells that are not normalized show falling average productivity for the Permian basin as a whole (see chart above which is not normalized for lateral length and note that the 2023 well has 2.4% lower cumulative output at 13 months), the discussion of normalized well productivity has to do with the longer term prospects for the Permian Basin, eventually the average lateral length will stop increasing, take a look at Bakken well producivity forecast for North Dakota at this post
https://novilabs.com/blog/north-dakota-update-through-jan-2024/
That is what the future looks like for the Permian as well.
Longer term Permian scenario below where the normalized well productivity becomes more relevant, I agree this is not that important for the short term versus actual well productivity (not normalized for lateral length). I always have the long term in view.
For the Bakken new well EUR decreased at about 2.6% per year from 2020 to 2023 based on the Novilab estimates. This may be what the future holds for the Permian basin as well. EUR in 2020 was about 433 kb and in 2023 it was about 400 kb for Bakken.
Dennis,
I think it is early to model production decreases in new wells, yet…
Lots of moving parts the past few years: ever increasing lengths, high-grading in 2020-2021, M&A, etc.
I don’t see a clear unequivocal trend of decreasing productivity.
Kdimitrov,
I agree lots of moving parts, eventually I expect technological progress and increasing lateral lengths, proppant intensity, and tighter spacing will reach diminishing returns as far as profitability. The high grading, M&A, etc will all tend to use up the best rock more quickly leaving us with well locations that are likely to have lower productivity, this is just the nature of the oil business.
The data I see suggests normalized Permian EUR has decreased by about 4.6% per yer on average from 2020 to 2022, my model is more conservative with a 3.4% annual decrease in new well EUR (this assumes lateral length, well spacing and proppant use settle at about the 2022 average level going forward, which is impossible to know in advance). Updated EUR per 10k feet below.
I agree the future is far from clear, perhaps productivity will be flat rather than decreasing, but the trend from 2021 to 2023 seems to suggest falling EUR per well (not normalized for lateral length) on average (436 kbo, 423 kbo, and 418 kbo, about a 2% annual decrease in EUR), perhaps this trend reverses, we will have to wait for more data.
Kdimitrov,
On the basis of our discussion, I have revised the EUR annual decrease to 2.2% in 2023 and to 1.8% per year for 2024 to 2029. The short term scenario is below with this change. Longer term output is relatively flat through December 2029 (after this I assume the well completion rate decreases.)
Kdimitrov,
If we assume no decrease in new well EUR from Jan 2023 to December 2025 we get the scenario below (with completion rate the same as the previous scenarios).
“Palm Springs breaks all-time record high temperature amidst Calif. heat wave”
Just a reference point—-
Another reference point,
PJM Interconnect, I estimate had to of burned upwards of 500,000 barrels of oil to produce electricity this summer and of the 39,000 MW of installed wind capacity on ERCOT system at 1:00 pm today the wind turbines are delivering 800 MWs.
Permian scenario with EUR decrease starting in Jan 2026 at an annual rate of decrease of 2.5%, the annual rate of decrease in new well EUR starts to fall as completion rate falls after Jan 2030. Long term scenario to 2046 with URR for Permian basin estimated at 43 Gb with 110 thousand total wells completed (about 48.5 thousand wells have been completed as of April 2023). Peak Permian output for this scenario is in summer/fall 2027 at about 5900 kb/d.
Projection for Bakken well profiles from Novilabs, note the decrease in EUR from 2020 to 2023. We may see something similar from 2022 to 2025 for the Permian Basin. Unfortunately this type of chart has not been presented for the Permian Basin at Novilabs, but would be available for subscribers to their service.
I used this blog post for the screenshot below.
https://novilabs.com/blog/north-dakota-update-through-jan-2024/
The annual rate of decline in new well EUR from 2020 to 2023 is about 2.8% for the North Dakota Bakken/Three Forks.
It’s a drop sure. But pretty minor. Field is doing a lot better than you predicted, previously.
https://peakoilbarrel.com/us-april-oil-production-rose-again/#comments
“The average new well estimated ultimate recovery (EUR) rises from 350 kb in Jan 2013 to 430 kb in Dec 2014 and then gradually decreases starting in June 2015 reaching an annual rate of decrease of 7% in June 2016.”
Going by your prediction, we’d expect something like a 250 kb EUR for 2023 wells…and that sure ain’t right.
I remember cautioning you at the time about always putting a “next year EURs will drop” in your simplistic models. Looks like I was right to caution you.
Nony,
I was wrong in my predictions in 2014 the EUR did not start to drop until 2019 or so and dropped more slowly than I predicted, (2% rather than 7%) the model has been revised over time to reflect the actual EUR based on output data. Note that I overestimated EUR for 2014 at 430 kbo (it was actually around 337 kb), that level was reached 6 years later in 2020. I also assumed a higher completion rate in my scenarios, it is always easier to predict the past than the future, what do expect for average North Dakota Bakken/Three Forks output of tight oil in 2024? I think you have mentioned 1300 kb/d? My guess is about 1200 kb/d (plus or minus 50 kb/d) for average North Dakota Bakken/Three Forks tight oil output.
No worries and glad to see you admit it. Also, I think I had the right instinct to caution you. It seemed to me like you were searching for some sort of lever to restrain your model. Rather than being completely objective. After all, you already got a lot of grief for being too optimistic, here, and seemed to respond to it, with alternate predictions.
Completions dropping was strongly financially driven…you were way off on the prices for second half of the 20teens. Although this also, helped high grade the EURs…so throw you half a bone here!
—————-
I expect us to reach/breach 1.3 MM bopd in one of the months of 2024 (as reported on Director’s Cut, to include through the DEC2024 report, made in FEB2025). I would (heck…WILL) bet serious money on that. It’s an aspect of the seasonality of ND production, where they figuratively make hay in the summer. If we have a price crash, I’ll be wrong, but I’d still take the bet and just deal with the chance.
I don’t think the annual production will breach 1.3+. You’re averaging in 5 months of sub 1.3 already, after all.
Nony,
Single month predictions are of little interest to me, give an annual prediction, if you dare (less than 1301 kb/d is a pretty big window of zero to 1300 kb/d). So you have not made a prediction for annual output in my book. My price predictions were for a specific scenario, my medium price prediction was based on the EIA’s AEO.
The 1.3 that we talked about earlier (me versus Ovi) was in relation to a comment from Helms that we would hit 1.3 during the year. Ovi said it would be hard. I disagreed.
As far as your interest in annual…good. You do, you. I do me! 🙂
Dennis, I expect annual output to be between 1200 and 1300. The first four months (including most of winter), were already averaging just under 1.2 MM bopd. (1.197).
Figure we have the normal summer recovery and activity increase. We’ll be over 1200 every month and probably have a few months over 1300 as year goes on. (Ovi was wrong to doubt that.) Then DEC (maybe NOV) will feel the winter impact and drop again. So, when you average it all out, something like 1.25. Maybe a tick higher. But not over 1.3 annual.
By the way, it’s like fish in a barrel to pull up some of Ron or Verwimp’s old Bakken predictions.
The funny thing is the crew here thought you were too optimistic. And you ended up being too pessimistic. But not as way off as they were.
And it’s OK, to be wrong. But one should learn from it…even to learn about oneself and how objective one is. There is a phenomenon called wishcasting.
https://en.wikipedia.org/wiki/Confirmation_bias
Nony,
I make my best guess at the time. Here is a Bakken Model from June 14, 2018, at the time I only has data through March 2018, I have added NDIC data from April 2018 to April 2024 to the chart. This scenario had new well EUR that was too low, but completion rates that were too high. from April 2018 to April 2024. I had assumed that EUR decrease would start around June 2019 for this scenario and the drop in EUR for my current Bakken scenario is about 2% per year (the older 2018 scenario assumed a 6.3% annual decrease in new well EUR in 2024 which is too high by about a factor of 3).
What I have learned over time is that the future is difficult to predict.
The 34k medium price model refers to 34 thousand total wells completed for the scenario and medium price means the AEO reference oil price scenario from AEO 2017. As of April 2024 roughly 19 thousand horizontal wells have been completed in North Dakota.
Listened to recent NDIC Director’s Cut and Helms was predicting 1 to 2% annual growth in Bakken/Three Forks output, the most recent 12 month average was about 1185 kb/d and hasn’t been as high as 1300 kb/d for 12 month average since Jan 2020. If we assume 1.5% future growth in Bakken/Three Forks, then it reaches 1300 kb/d in 2030. I also noticed he was talking mainly about Tier 2 and Tier 3 areas left to produce, I think he may be a bit optimistic about future output, in the past NDIC predictions have been very optimistic and quite far from the mark.
No comments on Ron and Verwimp’s Bakken predictions?
Nony,
Predictions of the future are wrong 100% of the time with about half being too high and the other half being too low. Number of possible futures is infinite, pick a single scenario as being your best guess. What are the odds of being correct? The math is very simple, the probability of a correct scenario is 1 over infinity which is exactly zero.
Dennis,
This is not how trends work.
you can’t just pick the last 3 data-points and call a trend based on 2 of them.
20/21 and 21/22 were declines, but 22/23 was an increase. and so was 19/20. I don’t see a trend here…
Kdimitrov,
I was doing a quick calculation based on two data points, here is 2019 to 2023 EUR for Bakken (estimated from chart, I don’t have the actual data). The trend is pretty clear to me.
1. Does Novi, actually give an EUR now? I remember back in the day, they didn’t, just people extrapolated by eye.
2. Plotting that on a true scale, shows how tiny the trend is. I agree that it looks like a down trend, and probably is. But still…the real story, might should be “close to 2019”, not “dropping”. Certainly, it’s not dropping anything like the shale critics thought it would (and posted here that it would).
3. Well performance can be affected by high/low grading, based on reactions to oil price. This isn’t even a criticism of you, just a note. It’s why Enno plots the “thickness of the line”. Maybe 2019 versus 2023 is the most reasonable comparison as sort of pre and post Covid. In that, case, you’re looking at a 5% drop, over 4 years. Not earth shaking, even for shale critics.
4. Realize that EURs are estimates of future performance. I would be a little leery of extracting too much insight from such small changes, especially for the 2023 vintage. You are estimating 25+ year performance, from 12 months performance. The drops in EUR, that you are looking at, are probably within the margin of error of the EUR estimation (E in EUR) itself. Or they could even be more extreme. But just realize, the issue.
yeah, just eye-balling these points, I’m not sure a straight line connecting 2019-2023 is not the best fit. What would be its R^2 relative to the one that Dennis has? So that would be your 5% over 4 years, or 1.5%/yr…
Depending on which data points are selected and how you draw the line, the slope can vary, but in any case it is very small and not clear if it’s significant…
Kdimitrov,
The r squared for both linear and exponential OLS for 2019 to 2023 are about the same (68%). For exponential it is a 2.3% per year decrease and for linear a 9.5 kb per year decrease. Perhaps not significant, time will tell. Over many years, it adds up, if the 2.3% decrease continues the EUR falls to 348 kb by 2030 from 435 kb in 2020, that seems pretty significant.
Nony,
I agree it is too early to make a prediction on the average EUR of 2023 wells, my experience is that my EUR estimates have been pretty accurate once I have 18 to 24 months of output data. Most of these wells will be shut in after they reach 10 to 15 bopd output which will be reached after 15 to 18 years in most cases. If a downhole repair costing 300k or so occurs it will not be worth doing the repair and the well will become inactive.
See https://novilabs.com/blog/north-dakota-update-through-jan-2024/
Thanks, K.
Yeah, you could even make a case for linear being potentially over-fitting. You’ve got 5 data points that are within 5% of the sample mean. You could even just regress a constant and get a decent fit! (What’s the rsq of that, Dennis?)
Nony,
That would be r^2 of zero rather than 68%. If you like linear we can use that, it would be 95 kb per decade, for a 400 kb EUR thats about 25%, if you think that isn’t significant, you’re wrong. As far as how you draw the line, I have used the very standard OLS used in most spreadsheet software.
Based on the regression the slope is significant for the linear regression with the null hypothesis of no relationship being rejected at the 10% confidence level P=0.086.
1. 24 months is what industry people say is reasonable. All that said, there’s still uncertainty. It could even be in the other direction (worse than expected).
2. I’d love to see some analysis proving that wells are plugged after then drop to 10-15 bopd. The Bakken is a big enough basin and has been operating a long time. So even if the average well is not there, you’d think you’d be able to show that with some sort of statistical analysis. Yes, it is more expensive to operate in ND, but those wells are also (relatively) low water compared to typical TX stripper wells. Of course, if there’s a major failure, an individual well may be plugged, if the cost of fishing out a broke tool or the like is not worth it. But I have a hard time believing the typical well will finish life at 10-15 bopd.
I tried looking at some older generation (2010ish), but those wells are still averaging 20+ bopd. And (on the log rate versus time) plot, they still look hyperbolic (or if exponential, pretty gentle rate). In any case, the average (and this includes plugged and idle!) seems to be stubbornly sticking above 20 bopd. There’s probably a way to slice and dice the data (maybe with paid access) and extract the insight to prove/disprove your hypothesis.
Dennis, yes you’re right about the rsq of a constant fit. I guess I want the standard error of the regression. The average for all 5 years is 412 Mbo. So, you are looking at very small deviations from that average. I would be hesitant to fit much of a model at all, given that.
10% confidence level is something, but its not the textbook 5%. I’m mean, OK…sure maybe there is an effect there. The data show what they show. But it’s not certain.
And we’re not even including the error uncertainty of the values themselves. Remember the E in EUR. Are we sure enough of these values themselves to make comparisons at that small of a variation?
Nony,
Nothing is certain. When you look at a breakeven analysis for the Permian Basin at current prices for the Average 2022 well, the well starts to lose money at 190 months at about 13 bopd. That is at 15.8 years it no longer makes economic sense to continue to operate the well at $2/MCF for natural gas, $80bo for crude and NGL at $23.20/b. Stuff breaks on wells all the time, especially wells with 2 mile laterals and repair costs are very high, my $300k estimate may be too low for replacing a downhole pump for example on a typical tight oil well.
Dennis:
Of course there is a point in time when it makes sense to P&A a well. Heck for some wells this happens very early if the disaster is bad enough. I’m not naive…it is a tradeoff. I just would be a little leery of your own ability to calculate this stuff.
Also, while it is true that wells eventually get plugged, it’s also true that there is a huge inventory of stripper wells out there (in the US, non-shale). I get it that these are horizontals and that makes you think maintenance is worse. But these two effects will sort of fight each other. And like I said, the water is actually pretty decent compared to a conventional stripper well. So, just don’t be sanguine. And don’t act like you discovered something and/or the industry has no concept of it. Or even that I as a commenter don’t get the basic idea. Duh.
Again, really, I’d think the data exists in Novi to do some sort of hypothesis test. If you look at 2010, there’s 54 out of 822 wells that are plugged. Very low growth in plugging last several years though. Looks like a bunch were plugged in 2020, probably using some of the Covid incentive money that was being thrown out. Still, it would seem that one ought to be able to test your hypothesis and figure out what production level is too little to keep a well going. Enno used to share the well quality breakouts, so you could see how many are doing sub-15 or sub 10 or the like, but that is no longer in the free version.
What percentage of Bakken wells produced under 600 BO in the most recently reported month?
It might be worthwhile to also analyze that by year, going back to 2006?
SS,
The median well tends to be worse than the average well. It’s a bit of a log normal distribution, not normal bell curve.
Looking at Enno (back when he had advanced insights for free):
https://novilabs.com/blog/north-dakota-update-through-january-2020/
Go to advanced insights (bottom panel of post). Go to eighth tab (production rate distribution). Select 2010 as the vintage to look at. Select 100 months after first production. You will see a histogram.
For 2010 wells, 100 months after production, the average well was doing 35 bopd. The median was doing 27. If you look at the histogram, 301 wells (the largest tranche) were doing less than 20 bopd. Note that even currently (~140 months after first production), only 55ish 2010-POPed wells have been plugged. So, certainly these wells don’t normally get shut in, just from dropping below 20.
On well profile uncertainty, in chart below I have 5 different estimates of the average 2019 Permian well I have done over time as I have gotten new data, the most recent data is also shown for comparison. As of 50 month cumulative the average of the cumualtive output at 50 months for the 5 estimates is 1.9% higher than data currently published (data=288kb and estimate is 294 kb). My well profile estimates seem to be a bit too optimistic, at least for 2019.
Time series are interesting things. We are not talking about a physical effect like resistivity versus temperature. A lot of things going on and it is possible for trends to reverse themselves. After all, look at 2010 to 2020. What’s the trend on that EUR? (Up and more, I bet!) And presumably, you expected it to reverse itself eventually. Like “next year”, every year. 😉 And actually I don’t think you should expect an uptrend to continue. But you also don’t know that a down trend will either. There are a lot of moving parts. And this is time series analysis, not a functional physical effect.
None and Dennis,
good discussion, thanks to both!
You too, K. Much respect.
Nony,
Much of the increase in EUR from 2015 to 2022 was simply due to increased lateral length (both of these increased at an annual rate of about 6%). When we normalize for lateral length we find that there has been a decrease in EUR per 10k feet of lateral with the regression rejecting the null hypothesis of no relationship at 0.1% confidence level (99.9% probability that there is a relationship) for a linear OLS regression slope of -13.6 kbo per 10k lateral per year, R^2 is 85.5%. On a basinwide basis the normalized EUR is the important variable to estimate ERR for the basin as the productive area and volume is limited.
As far as a physical relationship, this change over time reflects the geophysics of fluid flow in tight rock at high pressure which falls as fluid is removed from the rock.
I was talking about the Bakken, Dennis. Laterals have been 2 miles since 2010.
Nony,
No not correct. In 2010 average lateral length was 8000 feet in North Dakota Bakken/Three Forks, it increased to about 9000 feet in 2011 and then gradually increased to 10,000 feet by 2018. In the ND Bakken/TF EUR increased from 2011 to 2017 due to increased use of proppants, but that factor leveled off from 2017 to 2022.
See https://novilabs.com/blog/north-dakota-update-through-may-2023/
Permian is of far greater importance than the Bakken Three Forks today and I don’t have good data on Bakken lateral lengths. I also have not updated my Bakken EUR estimates for several years. My focus is the Permian basin as it produces about 63% of US tight oil output as of June 2024 (having grown from 46% of total tight oil output in Jan 2019).
In his last Director’s cut, Helms was talking about 3 and 4 mile laterals that had permits approved in ND so we may see some increase in average lateral length if these wells get completed.
I was talking about the Bakken and contrasting versus your 2% downtrend comments on the Bakken. I haven’t made any Permian comments.
OK on the lateral lengths. But even normalized, I bet you still get a more substantial uptrend than the recent downtrend.
Nony,
I was basing my analysis on what Enno Peters presented as far as Bakken, perhaps EUR will remain flat, the statistical significance is rather low at about 92% rather than the typical cutoff of 95%.
Yes the uptrend is steeper as there is learning by doing that occurs rapidly, especially as there was previous experience in Bakken and Eagle Ford some of which applied, this seems obvious enough not to mention, is there a point?
The fact is that there has been a downtrend in the Permian Basin from 2015 to 2023 as optimum parameters for frac stages per foot, lateral length, well spacing, pounds of proppant per lateral foot and frac fluid had been established. Increases in average lateral length reduced capital cost per barrel of EUR and make sense for an individual operator. In terms of maximizing oil recovered the increased lateral lengths recover less oil per volume of rock fracked and will reduce overall recovery rates from tight oil basins.
Though on second thought we might simply be seeing the effect of moving from Tier 1 to tier 2 and lower quality locations. There would need to be a better analysis comparing wells from similar areas with similar well design except for different lateral length. I think I have seen research along these lines.
This paper for example
https://novilabs.com/resources/urtec-2022-the-diminishing-returns-of-lateral-length-across-different-basins-id-3723784/
Higher lateral lengths in the Permian seem to be correlated with lower normalized EUR. chart below is for Permian basin only. Regression significant at 0.001 level. Normalized EUR falls by 27 kbo for every 1000 foot increase in lateral length, based on average Permian wells from 2015 to 2022.
Big picture:
source: https://asb.opec.org/ASB_Charts.html?chapter=2202
Russian crude production continues to decline. June production at 9,139,000 barrels per day.
Click on the graph to enlarge.
And their Navy is in Venezuela………..
Oil production has decreased in Russia
OREANDA-NEWS In June 2024, the average daily oil production in Russia decreased by 114 thousand barrels and dropped to the level of 9.139 million. This is reported by TASS with reference to statistical data from the July report of the Organization of Petroleum Exporting Countries (OPEC).
In April, 9.301 million barrels were extracted daily in Russia, in May — 9.253 million. In the first quarter, the average level of raw material production in the country was 9.431 million, and in the second — 9.231 million, OPEC said.
At the same time, the above-mentioned reduction rates in Russia were not enough to meet the established organizational framework. Taking into account all voluntary reductions in oil production under the OPEC+ agreements, in June Russia was supposed to reduce the average daily production of raw materials to 8.978 million barrels. However, as a result, this figure was exceeded by 161 thousand, OPEC summarized.
Earlier, the organization reported that Russia retains leadership in terms of oil supplies to China and India. In the structure of imports of the first country, the Russian Federation was able to take a share of 19 percent, the second — 41 percent. In the Chinese market, Russia was able to outpace Saudi Arabia (16 percent) and Malaysia (12 percent), in the Indian market — Iraq (21 percent) and Saudi Arabia (11 percent).
On LNG, AI, and Shale Supply – We Believe the Turn in North American Natural Gas is Here
This is a very long article. Here is just a snippet from deep inside the article. Bold mine.
In many respects, the current natural gas market represents the perfect storm: dry gas production is faltering just as demand is set to surge. We have warned for several years that shale growth would slow. Our neural network models indicated that, although immense, the shale basins were not infinite. The Barnett and Fayetteville were the first two shale gas basins developed in the middle 2000s. Each field ramped up sharply before unexpectedly plateauing and declining by over 50%. We concluded that both fields peaked precisely once half their recoverable reserves had been produced, just as Hubbert’s theories predicted. By applying these same principles to the Marcellus, Haynesville, and Permian (collectively 75% of total shale gas production ) we warned growth would soon begin to slow before production rolled over entirely in 2025. It appears we were too conservative; US gas supply has likely peaked already.
As we mentioned, the US produced nearly 1 bcf/d less dry gas in February than the peak in December. Preliminary data suggests production declines will accelerate.
An updated report on March Non-OPEC and World Oil Production has been posted.
https://peakoilbarrel.com/march-non-opec-and-world-oil-production-rose/
A new Open Thread Non-Petroleum has been posted.
https://peakoilbarrel.com/open-thread-non-petroleum-july-10-2024/