The EIA’s Short Term Energy Outlook (STEO) was published in early February. The chart below estimates World C+C by using the STEO forecast combined with past data from the EIA on World Output.
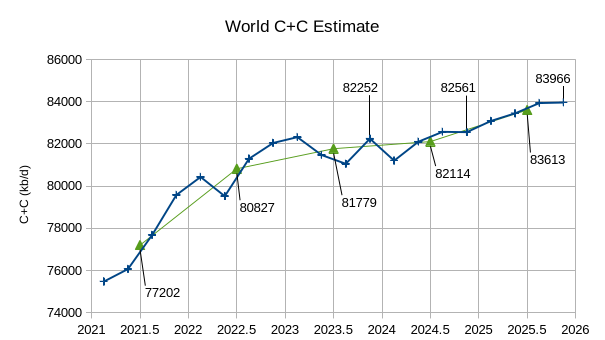
The EIA’s Short Term Energy Outlook (STEO) was published in early February. The chart below estimates World C+C by using the STEO forecast combined with past data from the EIA on World Output.
Comments not related to oil or natural gas production in this thread please, thanks.
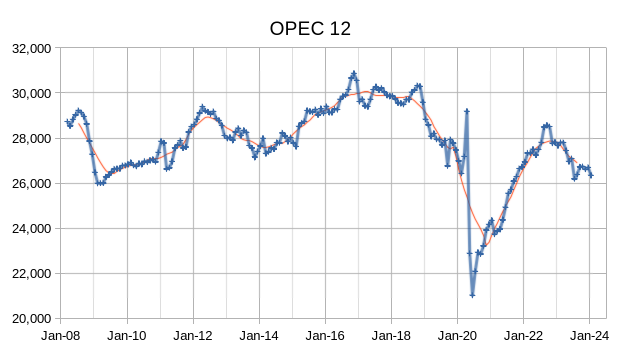
Read MoreThe OPEC Monthly Oil Market Report (MOMR) for February 2024 was published recently. The last month reported in most of the OPEC charts that follow is January 2024 and output reported for OPEC nations is crude oil output in thousands of barrels per day (kb/d). In the OPEC charts that follow the blue line with markers is monthly output and the thin red line is the centered twelve month average (CTMA) output.
Comments not related to oil or natural gas production in this thread please. Thanks.
Read MoreBy Ovi
Below are a number of Crude plus Condensate (C + C) production charts, usually shortened to “oil”, for oil producing countries. The charts are created from data provided by the EIA’s International Energy Statistics and are updated to October 2023. This is the latest and most detailed/complete World Oil production information available. Information from other sources such as OPEC, the STEO and country specific sites such as Brazil, Norway and China is used to provide a short term outlook
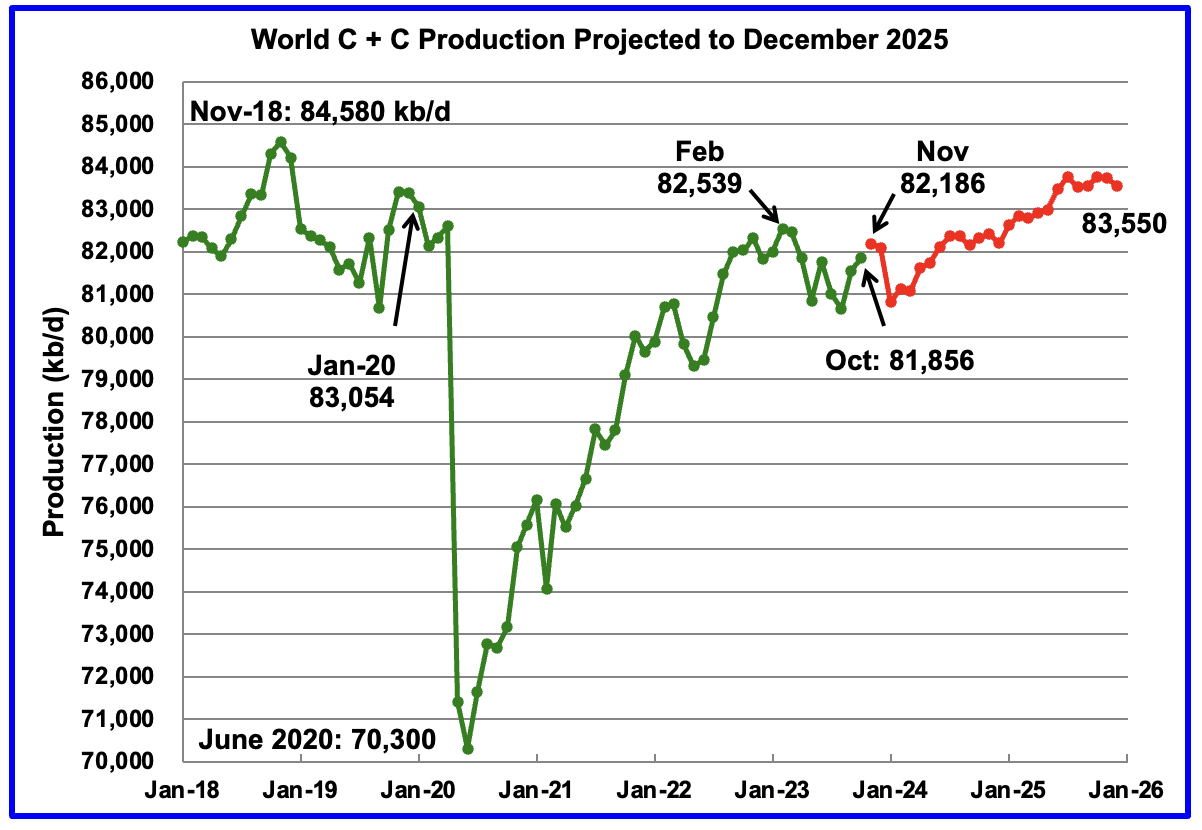
World oil production increased by 302 kb/d in October, green graph. The largest increase came from Canada and Kazakhstan with both adding 123 kb/d each.
Read More