The EIA’s Short Term Energy Outlook (STEO) was published in early June. The chart below estimates World C+C by using the STEO forecast combined with past data from the EIA on World Output.
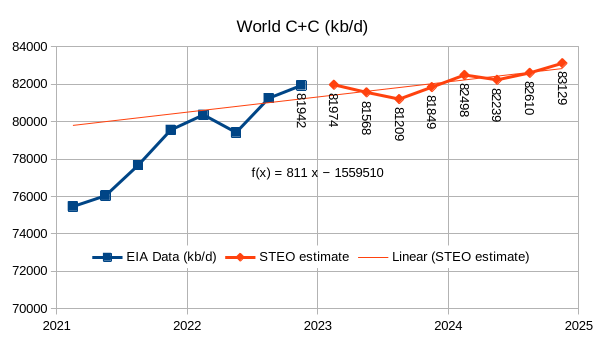
The EIA’s Short Term Energy Outlook (STEO) was published in early June. The chart below estimates World C+C by using the STEO forecast combined with past data from the EIA on World Output.
Comments not related to Oil or Natural Gas production in this thread please. Thank you.
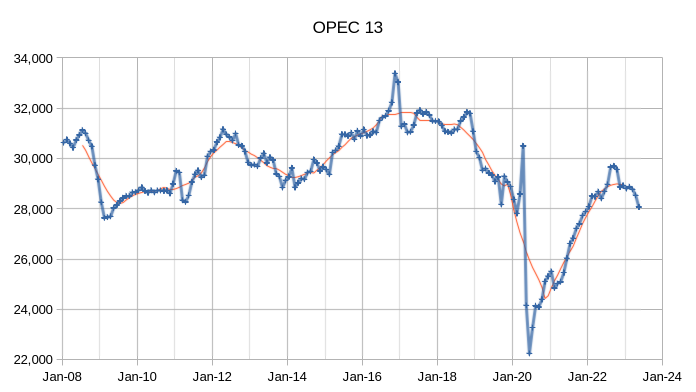
Read MoreThe OPEC Monthly Oil Market Report (MOMR) for June 2023 was published recently. The last month reported in most of the OPEC charts that follow is May 2023 and output reported for OPEC nations is crude oil output in thousands of barrels per day (kb/d). In many of the OPEC charts that follow the blue line with markers is monthly output and the thin red line is the centered twelve month average (CTMA) output.
Comments not related to Oil or Natural Gas production in this thread please. Thank you.
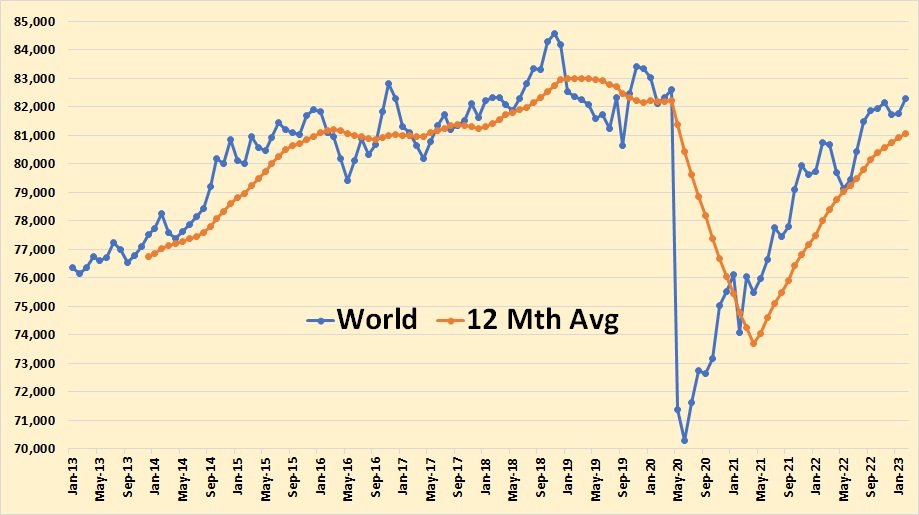
World C+C production increased by 524,000 barrels per day in February to a post-pandemic high.
Read More