Comments not related to oil or natural gas production in this thread please. Thank you.
Read MoreMonth: August 2021
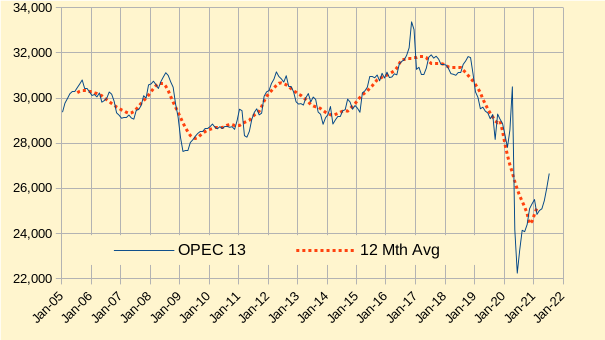
OPEC Update, August 2021
The OPEC Monthly Oil Market Report for August 2021 was published this past week. The last month reported in each of the charts that follow is July 2021 and output reported for OPEC nations is crude oil output in thousands of barrels per day (kb/d). In the charts that follow the blue line is monthly output and the red line is the centered twelve month average (CTMA) output.

Open Thread Non-Petroleum, August 14, 2021
Comments not related to oil and/or natural gas production in this thread please. Thank you.
Bakken Summary
A guest post by George Kaplan
The North Dakota area of the Bakken LTO basin has accessible data from the ND Department of Natural Resources, Oil and Gas Division. Production here seems to be past peak and in general decline. The data presented here is therefore more a historical perspective than of much interest in predicting issues that may have significant impact for the future. However it may give some indication on what to expect in the Permian basins, the only ones left in the US that may have capacity to increase production. The Texas RRC does also produce good data but a global data dump produces files that are too big for my computer to handle and splitting into smaller subsets is too man-hour intensive for me to pursue.
Production Across the Area
These charts show how the oil production has changed every three years by range (almost equivalent to lines of longitudes) and township lines (latitudes). These lines run every six miles and the area they contain is called a township, consisting of 36 square mile sections (that’s the simplified explanation, earth’s curvature and irregular land features make things a bit more complicated).


Open Thread Non-Petroleum, August 7, 2021
Comments not related to oil or natural gas production in this thread please. Thanks.