A Guest Post by George Kaplan
Brazil
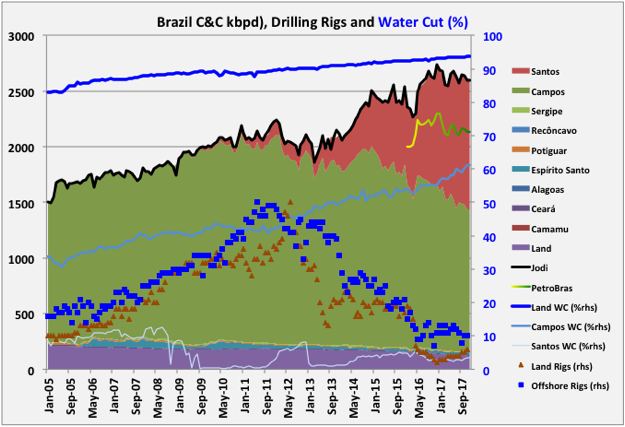
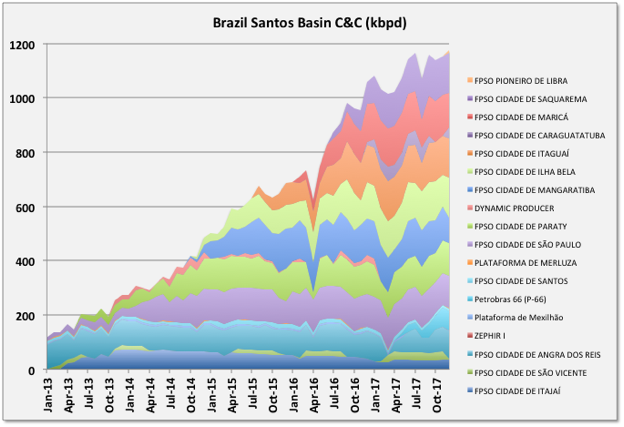
Brazil had a fairly uneventful 2017 for C&C production. Overall production was up 4.5% at 957 mmbbls (114 kbpd average), but the December exit rate was down 4.5%, or 124 kbpd, at 2612 kbpd. There were only two new platforms with significant ramp-ups, and one of those went off line for a couple of months late in the year. The Libra (now Mero) extended test FPSO came on line in November but had achieved only 11 kbpd.
Pre-salt production exceeded 50% for the first time. It was 1356 kbpd, or 52%, in December compared to 1262, or 46%, for December 2016. There were 85 pre-salt wells up from 68, but average production for each had fallen from 19 kbpd to 16, which is as expected as they were drilled mostly on producing platforms.
Petrobras owned 94% of December production, with Statoil at 2.4% (63 kbpd) and Shell, from their BG purchase at 2.1% (57 kbpd); for 2016 the numbers were 94%, 2.1% and 2.0%.

(Note that December water data wasn’t available at the time of writing so the water cut values have been assumed to be the same as November for the chart.)
Santos platforms increased overall, but some of the older ones may be showing signs of coming off plateau. Campos platforms declined and the rate may be increasing as the water cut growth is accelerating.

Read More


