This is a guest post by “Political Economist” and does not necessarily represent the opinions of Ron Patterson.
World Energy 2016-2050: Annual Report
“Political Economist”
June 2016
The purpose of this annual report is to provide an analytical framework evaluating the development of world energy supply and its impact on the global economy. The report projects the world supply of oil, natural gas, coal, nuclear, hydro, wind, solar, and other energies from 2016 to 2050. It also projects the overall world energy consumption, gross world economic product, and energy efficiency from 2016 to 2050 as well as carbon dioxide emissions from fossil fuels burning from 2016 to 2100.
The basic analytical tool is Hubbert Linearization, first proposed by American geologist M. King Hubbert (Hubbert 1982). Despite its limitations, Hubbert Linearization provides a useful tool helping to indicate the likely level of ultimately recoverable resources under the existing trends of technology, economics, and geopolitics. Other statistical methods and some official projections will also be used where they are relevant.
Past experience with Hubbert Linearization suggests that Hubbert Linearization exercise tends to underestimate the ultimately recoverable oil and natural gas resources. To mitigate this “pessimistic” bias, I use the US Energy Information Administration (EIA)’s official projection to project US oil and natural gas production from 2016 to 2040, which may prove to be too optimistic.
About two years ago, I posted “World Energy 2014-2050” at Peak Oil Barrel (Political Economist 2014). The posts can be found here:
World Energy 2014-2050 (Part 1)
World Energy 2014-2050 (Part 2)
World Energy 2014-2050 (Part 3)
The 2014 report drew the following conclusion:
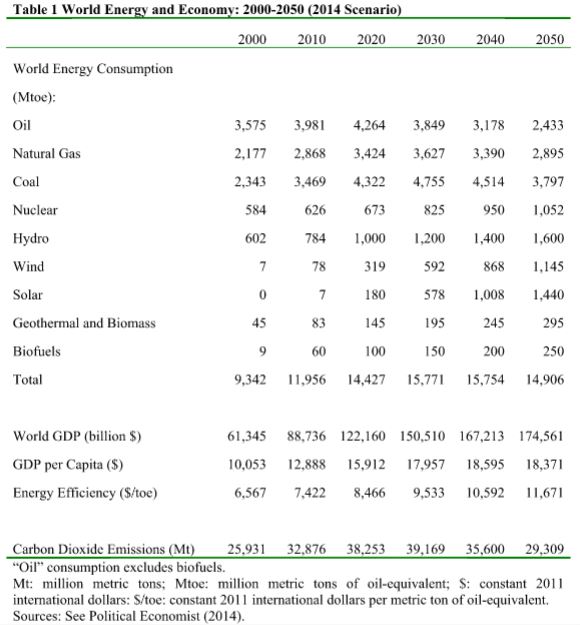
It finds that world production of oil, natural gas, and coal may peak between 2016 and 2031. As the supply of fossil fuels declines and the renewable energies do not grow sufficiently rapidly, the world energy consumption is projected to peak in 2035 and the world economy is projected to enter into a prolonged depression after 2040. World carbon dioxide emissions from fossil fuels burning are projected to peak in 2027. However, the cumulative carbon dioxide emissions from 2012 to 2100 are within the range of RCP 4.5 projected in the IPCC Fifth Assessment report, which may lead to long-term global warming of 3 degrees Celsius relative to the pre-industrial The summary statistics from the 2014 report are reported in the following table (Table 1).
These can be compared with the summary statistics reported towards the end of this report.
Since 2014, world energy conditions have significantly changed. Among the most important developments, the US production of oil and natural gas surged, leading to the collapse of world oil prices; China’s coal consumption and production have declined since 2013, leading to growing hope that the world economic growth may begin to “decouple” from carbon dioxide emissions. This report will show that this hope may be premature.
World Energy 2010-2015
According to BP’s Statistical Review of World Energy, world primary energy consumption reached 13,147 million tons of oil equivalent in 2015 (BP 2016). From 2010 to 2015, world primary energy consumption grew at an average annual rate of 1.5 percent.
World oil consumption (including biofuels) was 4,331 million tons in 2015, accounting for 33 percent of the world energy consumption. From 2010 to 2015, world oil consumption grew at an average annual rate of 1.2 percent.
World natural gas consumption was 3,135 million tons of oil equivalent in 2015, accounting for 24 percent of the world energy consumption. From 2010 to 2015, world natural gas consumption grew at an average annual rate of 1.7 percent.
World coal consumption was 3,840 million tons of oil equivalent in 2015, accounting for 29 percent of the world energy consumption. From 2010 to 2015, world coal consumption grew at an average annual rate of 1.1 percent.
World consumption of nuclear electricity was 583 million tons of oil equivalent in 2015, accounting for 4 percent of the world energy consumption. From 2010 to 2015, world consumption of nuclear electricity declined at an average annual rate of 1.4 percent.
World consumption of hydro, geothermal and biomass electricity was 1,010 million tons of oil equivalent in 2015, accounting for 8 percent of the world energy consumption. From 2010 to 2015, world consumption of hydro, geothermal and biomass electricity grew at an average annual rate of 3.0 percent.
World consumption of wind and solar electricity was 248 million tons of oil equivalent in 2015, accounting for 2 percent of the world energy consumption. From 2010 to 2015, world consumption of wind and solar electricity grew at an average annual rate of 23.9 percent.
According to World Bank and IMF data, gross world product (global economic output) was 107.0 trillion dollars (in 2011 constant international dollars) in 2015. From 2010 to 2015, global economic output grew at an average annual rate of 3.4 percent.
World average energy efficiency was 8,136 dollars per ton of oil equivalent in 2015. From 2010 to 2015, world average energy efficiency grew at an average annual rate of 1.8 percent.
World carbon dioxide emissions from fossil fuels burning were 33.5 billion tons in 2015. From 2010 to 2015, world carbon dioxide emissions grew at an average annual rate of 1.2 percent.
World average emissions intensity of gross world product was 0.313 kilogram of carbon dioxide emissions per dollar of gross world product. From 2010 to 2015, world average emissions intensity of gross world product declined at an average annual rate of 2.1 percent.
World average emissions intensity of primary energy consumption was 2.55 tons of carbon dioxide emissions per ton of oil equivalent. From 2010 to 2015, world average emissions intensity of primary energy consumption declined at an average annual rate of 0.3 percent.
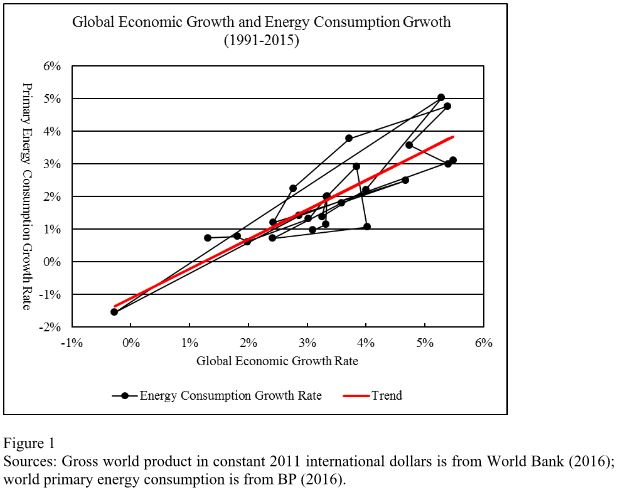
Figure 1 compares the historical world economic growth rates and the primary energy consumption growth rates from 1991 to 2015. The primary energy consumption growth rate has an intercept of -0.011 at zero economic growth rate and a slope of 0.904. That is, primary energy consumption has an “autonomous” tendency to fall by 1.1 percent a year when economic growth rate is zero. When economic growth rate rises above zero, an increase in economic growth rate by one percentage point is associated with an increase in primary energy consumption by 0.9 percent. R-square for the linear trend is 0.751.
Oil
World oil production (including crude oil and natural gas liquids) was 4,362 million tons (91.7 million barrels per day) in 2015, 3.2 percent higher than world oil production in 2014.
In 2015, Saudi Arabia was the world’s largest oil producer by energy content; Saudi Arabia produced 569 million tons of crude oil and natural gas liquids (12.0 million barrels per day), accounting for 13 percent of the world oil production.
The United States was the world’s largest oil producer by volume; the US produced 567 million tons of crude oil and natural gas liquids (12.7 million barrels per day), accounting for 13 percent of the world oil production.
The Russian Federation was the world’s third largest oil producer; Russia produced 541 million tons of crude oil and natural gas liquids (11.0 million barrels per day), accounting for 12 percent of the world oil production.
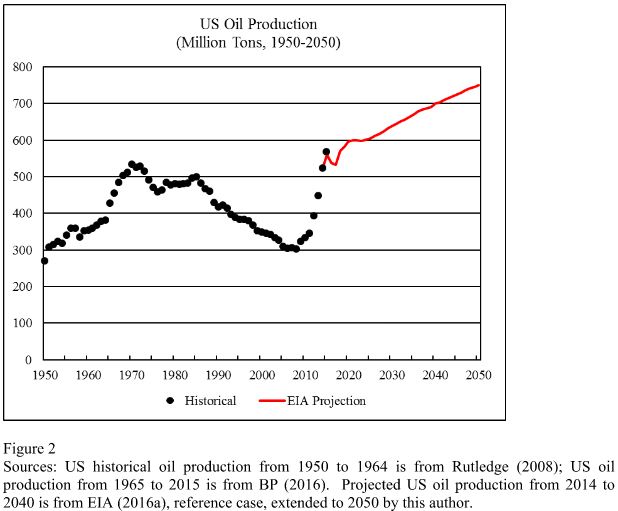
Figure 2 shows the historical and projected US oil production from 1950 to 2050. Theprojection is based on the US Energy Information Administration’s reference case scenario of the US oil production from 2014 to 2040 (EIA 2016a), extended to 2050 based on the trend from 2031 to 2040.
The US cumulative oil production up to 2015 was 32 billion tons. EIA’s current projection implies that the US cumulative oil production will be 48 billion tons by 2040 and the US ultimately recoverable oil resources will be 160 billion tons. Hubbert linearization applied to the EIA projection from 2031 to 2040 implies that the US oil production will not peak until 2081 when production rises to 833 million tons.
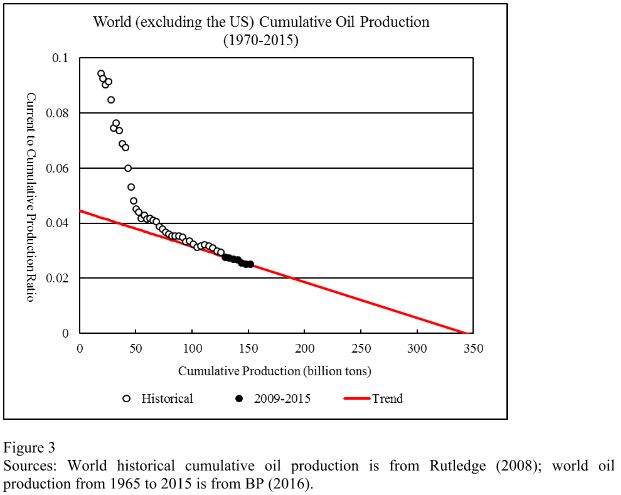
Figure 3 applies the Hubbert Linearization analysis to the world (excluding the US) oil production. The world (excluding the US) cumulative oil production up to 2015 was 152 billion tons. The linear trend from 2009 to 2015 indicates that the world (excluding the US) ultimately recoverable oil resources will be 343 billion tons. Regression R-square is 0.956. Year 2009 is selected as the beginning year in estimating the linear trend because it was a year of global economic recession. Other things being equal, a recession year tends to have a lower current production to cumulative production ratio and result in a larger amount of estimated ultimately recoverable resources.
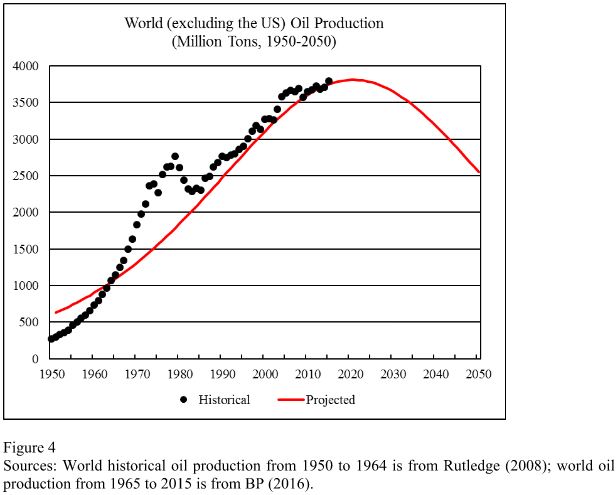
Figure 4 shows the historical projected world (excluding the US) oil production from 1950 to 2050. The world (excluding the US) oil production is projected to peak in 2021, with a production level of 3,811 million tons.
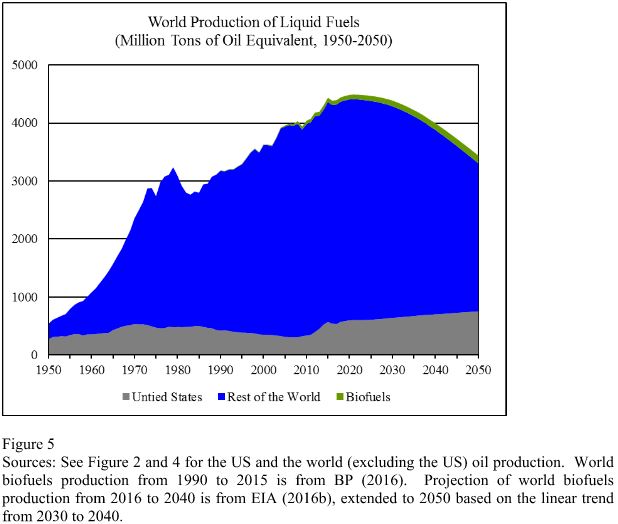
Figure 5 shows the historical and projected world production of liquid fuels. The world production of liquid fuels is the sum of the US oil production, the world (excluding the US) oil production, and the biofuels production. Projection of world biofuels production from 2016 to 2040 is from EIA (2016b), extended to 2050 based on the linear trend from 2030 to 2040. World production of liquid fuels is projected to peak in 2021, with a production level of 4,491 million tons.
Natural Gas
World natural gas production was 3,539 billion cubic meters (3,200 million tons of oil equivalent) in 2015, 2.2 percent higher than world natural gas production in 2014.
In 2015, the United States was the world’s largest natural gas producer; the US produced 767 billion cubic meters of natural gas (705 million tons of oil equivalent), accounting for 22 percent of the world natural gas production.
The Russian Federation was the world’s second largest natural gas producer; Russia produced 573 billion cubic meters of natural gas (516 million tons of oil equivalent), accounting for 16 percent of the world natural gas production.
Iran was the world’s third largest natural gas producer; Iran produced 193 billion cubic meters (173 million tons of oil equivalent), accounting for 5 percent of the world natural gas production.
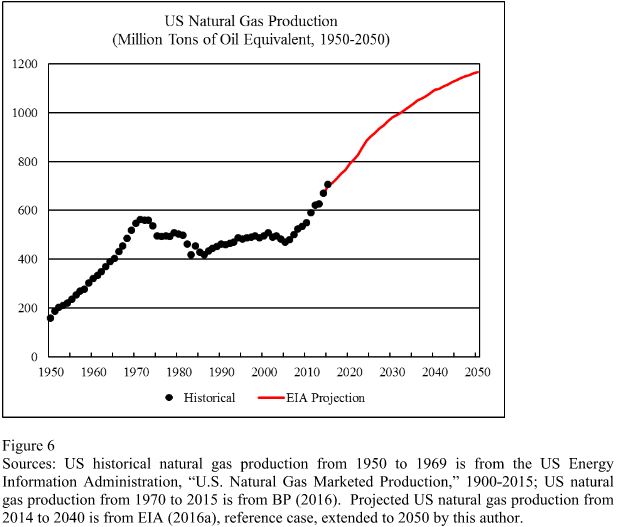
Figure 6 shows the historical and projected US natural gas production from 1950 to 2050. The projection is based on the US Energy Information Administration’s reference case scenario of the US natural gas production from 2014 to 2040 (EIA 2016a), extended to 2050 based on the trend from 2031 to 2040.
The US cumulative natural gas production up to 2015 was 32 billion tons of oilequivalent. EIA’s current projection implies that the US cumulative natural gas production will be 55 billion tons of oil equivalent by 2040 and the US ultimately recoverable natural gas resources will be 156 billion tons of oil equivalent. Hubbert linearization applied to the EIA projection from 2031 to 2040 implies that the US natural gas production will peak in 2060 with aproduction level of 1,198 million tons of oil equivalent.
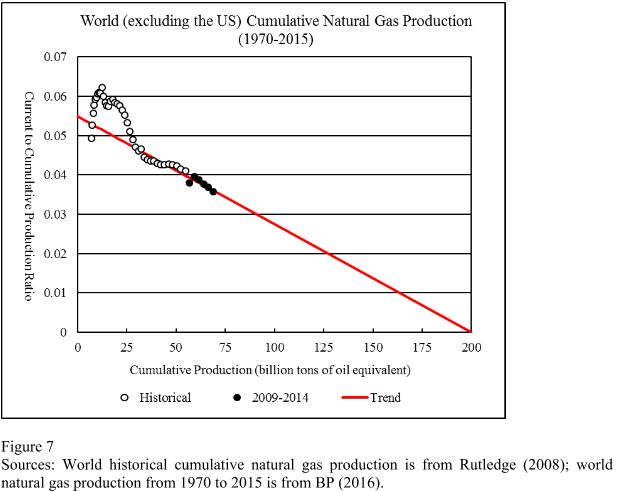
Figure 7 applies the Hubbert Linearization analysis to the world (excluding the US) natural gas production. The world (excluding the US) cumulative natural gas production up to 2015 was 72 billion tons of oil equivalent. The linear trend from 2009 to 2015 indicates that the world (excluding the US) ultimately recoverable natural gas resources will be 200 billion tons ofoil equivalent. Regression R-square is 0.777.
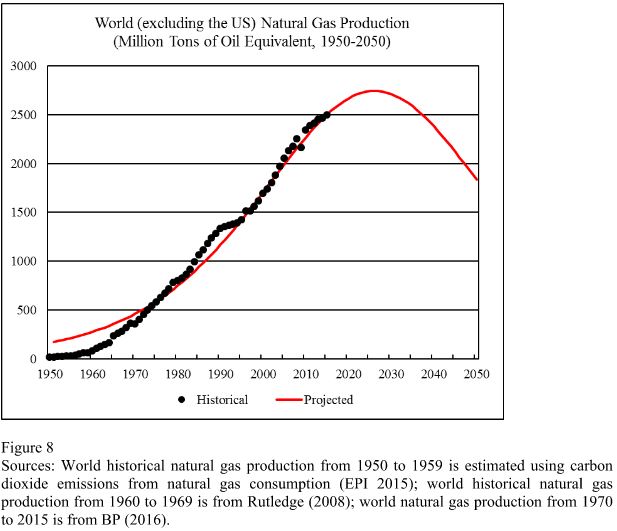
Figure 8 shows the historical and projected world (excluding the US) natural gas production from 1950 to 2050. The world (excluding the US) natural gas production is projected to peak in 2026, with a production level of 2,743 million tons of oil equivalent
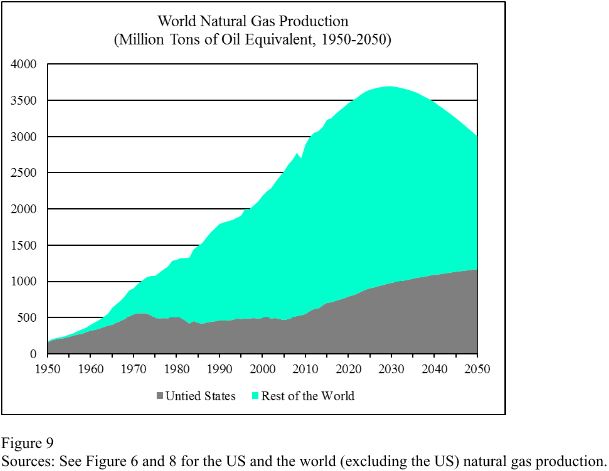
Figure 9 shows the historical and projected world natural gas production. World natural gas production is projected to peak in 2030, with a production level of 3,694 million tons of oil equivalent.
Coal
World coal production was 7,861 million tons (3,830 million tons of oil equivalent) in 2015, 4 percent lower than world coal production in 2014.
In 2015, China was the world’s largest coal producer; China produced 3,747 million tons of coal (1,827 million tons of oil equivalent), accounting for 48 percent of the world coal production.
The United States was the world’s second largest coal producer; the US produced 813 million tons of coal (455 million tons of oil equivalent), accounting for 12 percent of the world coal production.
India was the world’s third largest coal producer; India produced 678 million tons of coal (284 million tons of oil equivalent), accounting for 7 percent of the world coal production.
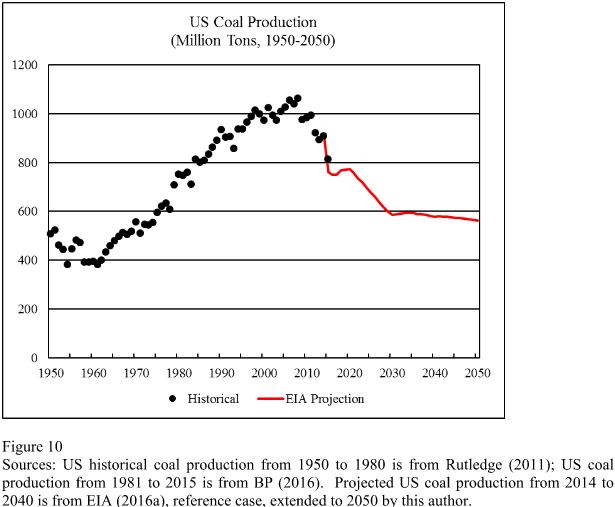
Figure 10 shows the historical and projected US coal production from 1950 to 2050. The projection is based on the US Energy Information Administration’s reference case scenario of the US coal production from 2014 to 2040 (EIA 2016a), extended to 2050 based on the trend from 2031 to 2040.
The US cumulative coal production up to 2015 was 75 billion tons. EIA’s current projection implies that the US cumulative coal production will be 91 billion tons by 2040 and the US ultimately recoverable coal resources will be 155 billion tons. The US coal production peaked in 2008, with a production level of 1,063 million tons.
The world (excluding the US) cumulative coal production up to 2015 was 285 billion tons. According to BP (2016), at the end of 2015, the world’s total coal reserves were 891.5 billion tons and the world (excluding the US) coal reserves were 654.2 billion tons.
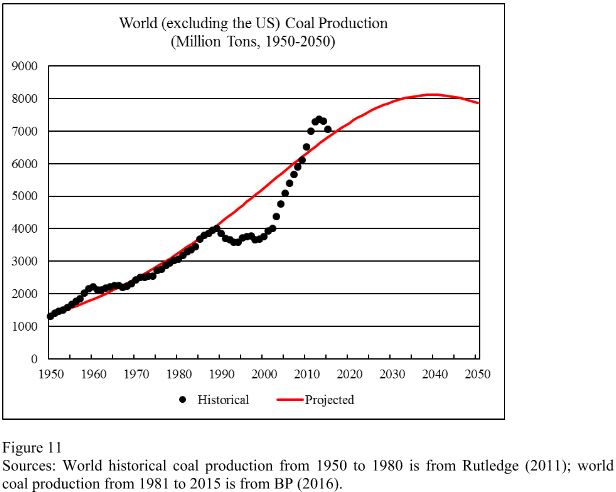
Figure 11 shows the historical and projected world (excluding the US) coal production from 1950 to 2050. The projection is based on the assumption that the world (excluding the US) ultimately recoverable coal resources will be 939 billion tons. The projected coal production curve is calibrated so that the world (excluding the US) coal production falls by about 140 million tons from 2015 to 2016. The world (excluding the US) coal production is projected to peak in 2040, with a production level of 8,115 million tons.
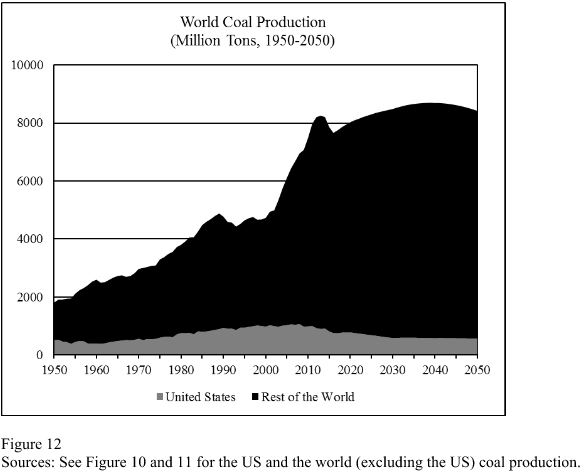
Figure 12 shows the historical and projected world coal production. World coal production is projected to peak in 2039, with a production level of 8,695 million tons.
Nuclear Electricity
World consumption of nuclear electricity was 2,577 terawatt-hours in 2015, 1.3 percent higher than world nuclear electricity consumption in 2014.
I use the US Energy Information Administration’s projection of nuclear generating capacity. According to EIA’s projection, world nuclear generating capacity will grow from 355 gigawatts in 2015 to 602 gigawatts in 2040 (EIA 2016b).
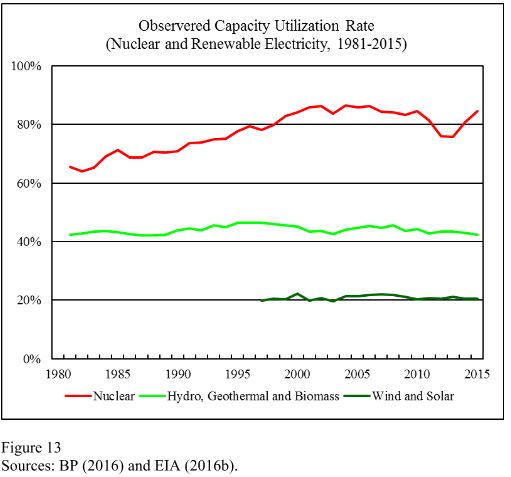
Figure 13 compares the observed capacity utilization rates for nuclear and renewable electricity.
The observed capacity utilization rate for electricity generation is calculated as follows:
Capacity Utilization Rate = (Annual Electricity Consumption * 2) / 8760 / (Beginning-of- Year Installed Capacity + End-of- Year Installed Capacity)
Electricity consumption data are from BP (2016). Electricity generating capacity data for years before 2010 are from the US Energy Information Administration, “International Energy Statistics.” Electricity generating capacity data for years after 2010 are from EIA (2016b).
From 2000-2010, the world average capacity utilization rate for nuclear generating capacity fluctuated around 85 percent. The average capacity utilization rate for nuclear generating capacity fell sharply during 2011-2014, due to the impact of the Fukushima accident. But it recovered to about 85 percent in 2015.
I assume that the average capacity utilization rate for nuclear generating capacity will be 85 percent for the period 2016-2040. From 2040 to 2050, nuclear electricity consumption is assumed to grow following the linear trend from 2030 to 2040.
Nuclear electricity is converted into its thermal equivalent using the formula: 4.4194 terawatt-hours = 1 million tons of oil equivalent (assuming 38 percent conversion efficiency in a modern thermal power plant).
Hydro, Geothermal and Biomass Electricity
World consumption of hydro electricity was 3,946 terawatt-hours in 2015, 1.0 percent higher than world hydro electricity consumption in 2014. World consumption of geothermal and biomass electricity was 518 terawatt-hours in 2015, 5.3 percent higher than world geothermal and biomass electricity consumption in 2014.
I use the US Energy Information Administration’s projection of hydro, geothermal and biomass generating capacity. According to EIA’s projection, world hydro generating capacity will grow from 1,079 gigawatts in 2015 to 1,473 gigawatts in 2040; world geothermal generating capacity will grow from 14 gigawatts in 2015 to 52 gigawatts in 2040; world biomass generating capacity (including other minor sources of renewable electricity) will grow from 132 gigawatts in 2015 to 275 gigawatts in 2040 (EIA 2016b).
In recent years, the world average capacity utilization rate for hydro, geothermal and biomass generating capacity has fluctuated around 42-43 percent (see Figure 13). I assume that the average capacity utilization rate for hydro, geothermal and biomass generating capacity will be 43 percent for the period 2016-2040. From 2040 to 2050, hydro, geothermal and biomass electricity consumption is assumed to grow following the linear trend from 2030 to 2040.
Hydro, geothermal and biomass electricity is converted into its thermal equivalent using the formula: 4.4194 terawatt-hours = 1 million tons of oil equivalent (assuming 38 percent conversion efficiency in a modern thermal power plant).
Wind and Solar Electricity
World consumption of wind electricity was 841 terawatt-hours in 2015, 17.4 percent higher than world wind electricity consumption in 2014. World consumption of solar electricity was 253 terawatt-hours, 32.6 percent higher than world solar electricity consumption in 2014.
In 2015, the world installed 63 gigawatts of wind generating capacity and 51 gigawatts of solar generating capacity.
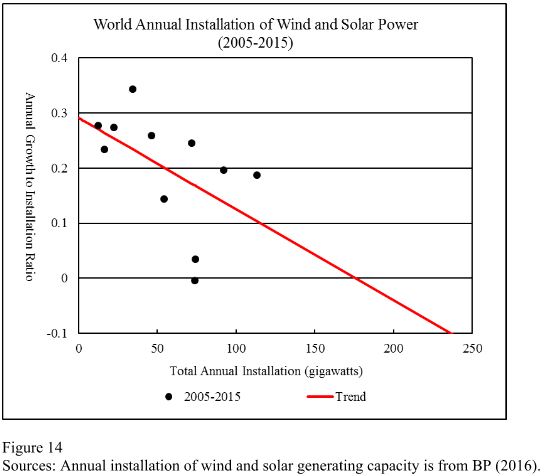
Figure 14 compares the historical relationship between total annual installation of wind and solar power and the annual growth to the annual installation ratio (that is, the ratio of the growth of the annual installation to the annual installation). The downward inear trend (R-square 0.262) indicates that the total annual installation of wind and solar power should eventually approach the maximum of 176 gigawatts (where the linear trend meets the zero horizontal line).
The parameters of the linear trend can be used to project the future installation of wind and solar power. While the linear trend is preliminary, the implied future installation compares favorably against several mainstream forecasts.
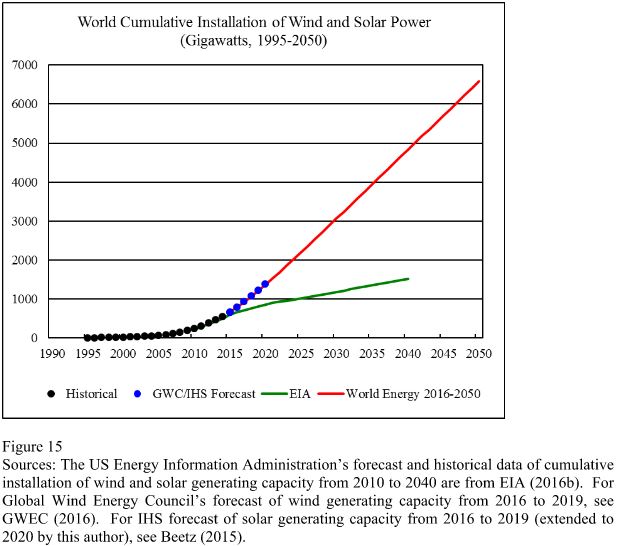
Figure 15 compares this author’s forecast of future installation of wind and solar generating capacity with the “GWC/IHS Forecast” and the US Energy Information Administration’s official forecast published in EIA’s International Energy Outlook (EIA 2016b).
According to Global Wind Energy Council’s current forecast, the world will install 64 gigawatts of wind generating capacity in 2016, 68 gigawatts in 2017, 72 gigawatts in 2018, 75.5 gigawatts in 2019, and 79.5 gigawatts in 2020 (GWEC 2016). According to energy consultancy IHS's forecast, the world will install 65 gigawatts of solar generating capacity in 2016, 65.5gigawatts in 2017, 68.4 gigawatts in 2018, and 73.5 gigawatts in 2019 (Beetz 2015). I extend IHS's forecast to 2020 by assuming that the world will install 78.5 gigawatts of solar generating capacity in 2020. If one adds up GWEC’s forecasts of wind installations and IHS's forecasts of solar installations (extended to 2020), then the world’s cumulative installation of wind and solar generating capacity should rise to 1,375 gigawatts by 2020. By comparison, this report (“World Energy 2016-2050”) projects that the cumulative installation of wind and solar generating capacity will be 1,373 gigawatts by 2020.
This report’s forecast of future wind and solar installation is far more optimistic than the US Energy Information Administration’s official forecast. According to EIA’s forecast, the world’s cumulative installation of wind and solar generating capacity will be 865 gigawatts by 2020 and 1,512 gigawatts by 2040. By comparison, this report projects that the world’s cumulative installation of wind and solar generating capacity will rise to 4,826 gigawatts by 2040 and 6,585 gigawatts by 2050.
In recent years, the world average capacity utilization rate for wind and solar generating capacity has fluctuated around 20-22 percent (see Figure 13).
I assume that the average capacity utilization rate for wind and solar generating capacity will be 22 percent for the period 2016-2040. Wind and solar electricity is converted into its thermal equivalent using the formula: 4.4194 terawatt-hours = 1 million tons of oil equivalent (assuming 38 percent conversion efficiency in a modern thermal power plant).
–
Wind and Solar Electricity Generation Cost
As the wind and solar electricity cost falls, it has become increasingly controversial regarding whether wind and solar electricity has become “cost competitive” against fossil fuels power plants.
This section uses a simple and transparent framework that compares the wind and solar electricity generation costs with the gas-fired electricity generation cost.
The average electricity generation cost is defined as the annual total generation cost divided by the annual electricity generation.
The annual electricity generation from one gigawatt of generating capacity is calculated as follows:
Annual Electricity Generation = 1 Gigawatt * Capacity Utilization Rate
In the US, gas-fired electricity serves as both base-load and load-balancing power. I assume that the gas-fired power plant has a capacity utilization rate of 50 percent.
In 2015, the world average observed capacity utilization rate for wind electricity was 24 percent and for solar electricity was 14 percent. The US had higher observed capacity utilization rates. The US observed capacity utilization rate for wind electricity was 31 percent and for solar electricity was 20 percent (calculated using data from BP 2016).
I assume that the wind power plant has a capacity utilization rate of 30 percent and the solar photovoltaic power plant has a capacity utilization rate of 20 percent.
The annual total generation cost is the sum of annual fixed cost and annual fuel cost.
Annual fixed cost is assumed to be 10 percent of the capital cost. Annual fixed cost includes interest rate (assumed to be 5 percent) and depreciation and maintenance cost (assumed to be 5 percent of the capital cost).
Wind and solar electricity has no fuel cost. For gas-fired electricity, the technology is assumed to be advanced combined cycle. Natural gas consumption for gas-fired electricity is calculated assuming 55 percent thermal conversion efficiency (or a heat rate of 6,200 British thermal units per kilowatt-hour) and natural gas price is assumed to be 5 dollars per million British thermal unit (in 2015, the US Henry Hub natural gas price was 2.6 dollars per million Btu).
Table 2 reports the estimated generating cost for gas-fired, wind, and solar photovoltaic electricity. Given the current technologies, gas-fired electricity costs 5.6 cents per kilowatt-hour, wind electricity costs 6 cents per kilowatt-hour, and solar photovoltaic electricity costs 14 cents per kilowatt-hour. Wind electricity costs about the same as the gas-fired electricity and solar photovoltaic electricity is about two-and-a-half times as expensive.

Limits to Wind and Solar Electricity
In the medium- and long run, wind and solar electricity will be constrained by their intermittency and the growing difficulties to incorporate them into the electric grid.
An article published in China Electric Power studied the problem of incorporating wind and solar electricity into the electric grid of China’s Gansu province (a Chinese province is about the size of an European country). As of 2013, Gansu province had 12 gigawatts of wind generating capacity and 5.3 gigawatts of solar photovoltaic generating capacity (Yao, Zheng, and Li 2014). By comparison, Spain had a total installation of wind and solar generating capacity of 16 gigawatts in 2007.
The conventional generating capacity that is available for load balancing can be calculated from the following formula:
P L = (P total – Grid Reserve – Plant Self-Consumption and Transmission Losses) * “Balancing Depth” Factor
In the above formula, P total is the total nameplate conventional generating capacity. P L is the conventional generating capacity available for load balancing. The authors of the study subtracted 13 percent of the total capacity as the “reserve capacity.” Power plant self- consumption and transmission losses are assumed to be 10 percent of the electricity generated.
“Balancing Depth” refers to the degree to which the conventional generating capacity can increase or decrease generation on short notice. This is assumed to be 30 percent of the effective generating capacity. Thus, overall, only about 23 percent of the nameplate conventional generating capacity is actually available for load balancing.
Out of the conventional generating capacity that is available for load balancing, some has to be used to meet peak load demand that is not offset by wind or solar generation. This is estimated to be about 20 percent of the average load or 10 percent of the total nameplate capacity. Thus, only 13 percent of the nameplate conventional generating capacity is available to balance the intermittency of wind and solar electricity.
In the case of Gansu province, it was estimated by the authors that for 17 gigawatts of wind and solar power, load balancing need would be 7-9 gigawatts or between 40 and 55 percent of the wind and solar generating capacity. Take the lower limit of 40 percent. As the balancing need of wind and solar generating capacity is 40 percent and only 13 percent of the conventional generating capacity is available for balancing the intermittency of wind and solar electricity, it follows that the total conventional generating capacity needs to be about three times as large for the electric grid to be balanced (40 / 13 = 3.08).
Let us make some optimistic assumptions. Suppose the grid reserve can be reduced to 10 percent of the total nameplate conventional generating capacity and the balancing depth can be increased to 50 percent. Thus, 40 percent of the nameplate capacity can be made available for
load balancing. Subtracting 10 percent of the capacity required to meet peak load demand, 30 percent of the nameplate conventional generating capacity can be made available to balance wind and solar intermittency.
On the other hand, suppose through better coordination and building of long-distance transmission lines, the balancing need for wind and solar electricity can be reduced to 30 percent of the generating capacity. After these adjustments, it would still take at least one gigawatt of conventional generating capacity to match one gigawatt of wind or solar generating capacity.
According to EIA’s International Energy Outlook, the world will have 1,970 gigawatts of coal-fired generating capacity, 2,252 gigawatts of gas-fired generating capacity, 320 gigawatts of liquids-fired generating capacity, and 1,473 hydroelectric generating capacity by 2040. Thus, by 2040, the total conventional generating capacity adds up to 6,015 gigawatts.
According to this report’s projection, the world will have 4,826 gigawatts of wind and solar generating capacity by 2040 and 6,586 gigawatts by 2050. Thus, the technical limits of the world’s electric grids to accommodate wind and solar electricity will be tested by the 2040s.
In the very long run, the expansion of wind and solar electricity will be constrained by the availability of land and material resources.
According to Castro et al. (2011), global technical potential for wind electricity generation is about one terawatt. The materialization of this potential would require the building of wind electric power over a land area as large as 10 million square kilometers. Assuming a capacity utilization rate of 25 percent for wind power, it takes 4,000 gigawatts of wind generating capacity to generate one terawatt of wind electricity.
The current global land occupation by human settlement and infrastructure is estimated to be 2-4 million square kilometers or 1.3-2.7 percent of the world’s total land surface area. In the next few decades, 1 million square kilometers of additional land will be occupied for human settlement and infrastructure because of population growth and urbanization. By the end of the century, there will be about 4-6 million square kilometers occupied by human settlement and infrastructure. If 10 percent of the total settlement and infrastructure land area can be made available for solar electric power, the total land area where the solar electric power can be built will amount to about 500,000 square kilometers by the end of the 21st century.
Assuming a power density of 4 watt per square meter, a land area of 500,000 square kilometers can generate solar electricity of two terawatts or 2,000 gigawatts (Castro et al. 2013).
Assuming a capacity utilization rate of 15 percent for solar power, 2,000 gigawatts of solar electricity generation requires about 13,000 solar generating capacity.
Thus, by the end of the 21st century, the world has a total technical potential of wind and solar generating capacity of about 17,000 gigawatts. According to this report’s projection, the world will have built about 6,600 gigawatts of wind and solar generating capacity by 2050.
Beyond 2050, if the world keeps building 175 gigawatts of wind and solar generating capacity each year, the world will have more than 15,000 gigawatts of wind and solar generating capacity by 2200. This is consistent with the technical potential estimated above.
World Energy 2016-2050
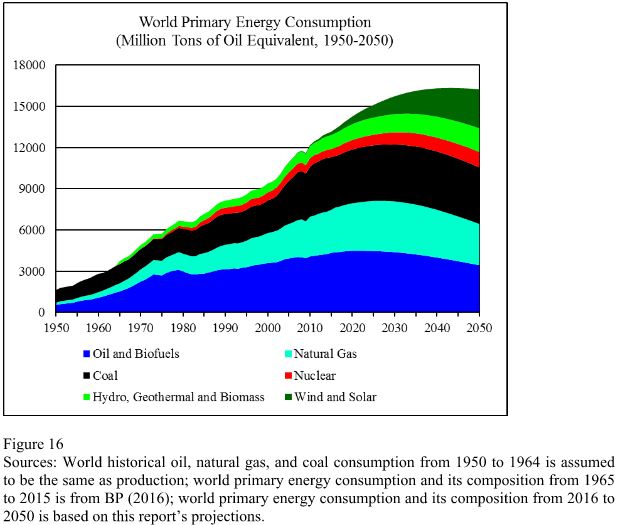
Figure 16 shows the historical and projected world primary energy consumption from 1950 to 2050.
World historical consumption of oil, natural gas, and coal from 1950 to 1964 is assumed to be the same as production.
World primary energy consumption and its composition from 1965 to 2015 is from BP (2016).
World consumption of oil, natural gas, and coal from 2016 to 2050 is assumed to be the same as production. Oil consumption includes biofuels. Coal production in tons is converted to coal consumption in tons of oil equivalent using the formula: 2.05 tons of coal production = 1 ton of oil equivalent of coal consumption (based on the observed relationship in 2015).
World consumption of nuclear, hydro, geothermal, biomass, wind, and solar electricity from 2016 to 2050 is based on projections explained in the above sections.
World primary energy consumption is projected to peak in 2043 at 16,333 million tons of oil equivalent.
For 2016-2050, the relationship between the primary energy consumption growth rate and the economic growth rate is defined as follows:
Economic Growth Rate = (Primary Energy Consumption Growth Rate + 0.0112) / 0.904
In other words, it is assumed that the trend relationship between the two variables observed for the period 1991-2015 will continue to hold for the period 2016-2050.
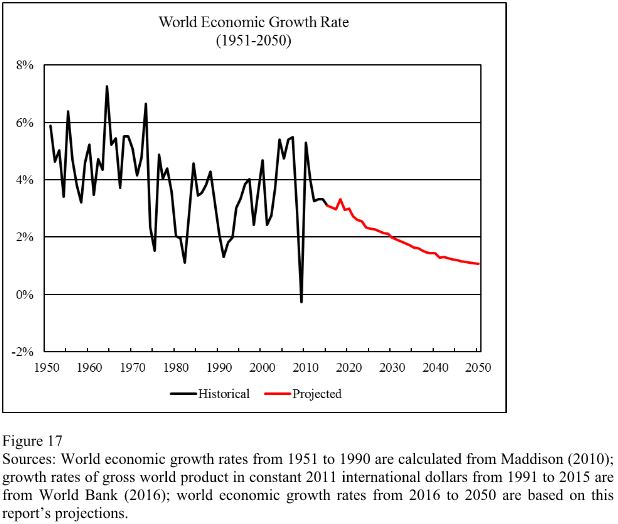
Figure 17 shows the historical and projected world economic growth rates from 1951 to 2050. World (trend) economic growth rate is projected to fall below 3 percent by the 2020s, fall below 2 percent by the 2030s, and approach 1 percent by the 2040s.
After the Second World War, global economic growth rate fell below 2 percent only in several occasions: 1975, 1982, 1991, and 2009. These were all considered to be deep global economic recessions. During 1913-1950, when the global capitalist system suffered from major wars, revolutions, and the Great Depression, world economy actually grew at an average annual rate of 1.8 percent (Maddison 2010).
Thus, by the mid-21st century, although the global economy will continue to grow, world economic growth rate may become too close to zero so that the global capitalist system will suffer from persistent economic and political instability.
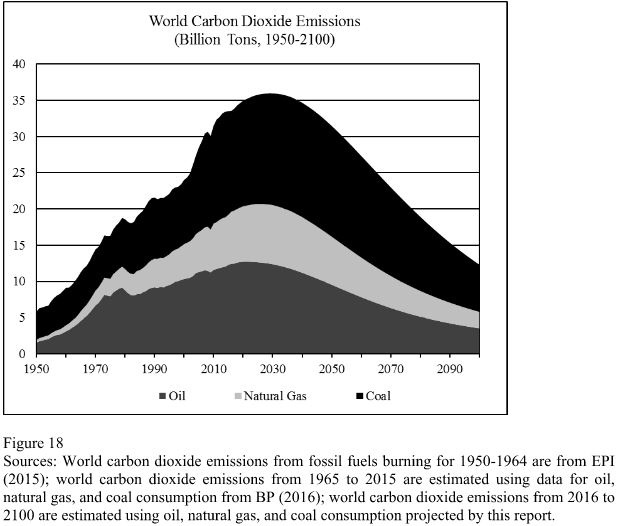
Figure 18 shows the world carbon dioxide emissions from fossil fuels burning from 1950 to 2100.
Carbon dioxide emissions are estimated using oil, natural gas, and coal consumption data from BP’s Statistical Review of World Energy. In previous editions of Statistical Review of World Energy, BP used the following conversion factors to calculate carbon dioxide emissions: 1 ton of oil emits 3.07 tons of carbon dioxide; 1 ton of oil equivalent of natural gas emits 2.35 tons of carbon dioxide; 1 ton of oil equivalent of coal emits 3.96 tons of carbon dioxide. In the 2016 edition of Statistical Review of World Energy, BP revised the estimates of carbon dioxide emissions without providing conversion factors for fuel types.
I estimate the carbon dioxide emissions from oil, natural gas, and coal consumption by using the conversion factors provided in previous editions of Statistical Review of World Energy and multiplying the conversion factors by an adjustment factor. The adjustment factor is 0.97 for 1965-1970, 0.96 for 1971-1980, 0.95 for 1981-1990, and 0.94 for 1991-2100. For example, carbon dioxide emissions from oil consumption in 1965 are estimated as: oil consumption in 1965 * 3.07 * 0.97. For years after 1990, biofuels production is subtracted from oil consumption in estimating carbon dioxide emissions from oil consumption. The total carbon dioxide emissions so calculated are very close to the carbon dioxide emissions reported by BP (2016) for the period 1965-2015.
World carbon dioxide emissions are projected to peak in 2029 at 35,953 million tons.
Cumulative world carbon dioxide emissions from fossil fuels burning from 2011 to 2100 will be 2,432 billion tons. These are emissions from direct fossil fuels combustion only and do not include emissions from cement production and gas flaring.
According to Intergovernmental Panel on Climate Change’s Fifth Assessment Report, cumulative carbon dioxide emissions of 2.4 trillion tons from 2011 to 2100 are within the range of “representative concentrated pathways” RCP 4.5. It will lead to atmospheric concentration of carbon dioxide equivalent of 650 parts per million by 2100 and result in a median estimate of global warming of 2.6 degrees Celsius by 2100 (compared to 1850-1900), with about one-third chance that global warming by 2100 may actually exceed three degrees Celsius (IPCC 2014, Table SPM.1).
According to Hansen et al. (2015), global warming by more than two degrees may lead to the melting of West Antarctica ice sheets, causing sea level to rise by 5-9 meters over the next 50-200 years. Bangladesh, European lowlands, the US eastern coast, North China plains, and many coastal cities will be submerged. This will lead to the end of civilization as we know it.
If global warming rises above three degrees Celsius, slow climate feedbacks (through ice sheet melting and vegetation change) may eventually lead to a long-term global warming by up to six degrees Celsius (Hansen et al. 2008). In that event, much of the world will no longer be suitable for human inhabitation.
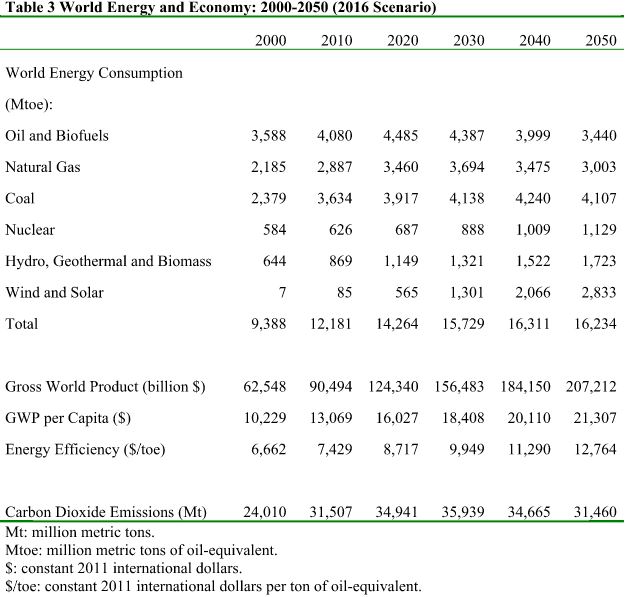
Table 3 reports the summary statistics of this Annual Report. To calculate the future gross world product per capita, United Nations’ world population forecast (median variant) is used (UN 2015).
References
IHS: 272 GW of solar installs from 2016 – 2019
BP Statistical Review ofWorld Energy June 2016
Castro, Carlos de, Margarita Mediavilla, Luis Javier Miguel, and Fernando Frechoso. 2011. “Global Wind Power Potential, Physical and Technological Limits.” Energy Policy 39(10): 6677-6682.
2013. “Global Solar Electric Potential: A Review of Their Technical and Sustainable Limits.” Renewable and Sustainable Energy Reviews 28: 824-835.
EIA. US Energy Information Administration Annual Energy Outlook, Early Release,
May 17, 2016.
International Energy Outlook, May 11, 2016.
EPI. Earth Policy Institute. 2015. “Global Carbon Dioxide Emissions from Fossil Fuel Burning by Fuel Type, 1900-2013,” April 16, 2015. http://www.earth-
policy.org/?/data_center/C23/.
GWEC. Global Wind Energy Council. 2016. “Market Forecast for 2016-2020,”
Hansen, James, Makiko Sato, Paul Hearty, Reto Ruedy, et al. 2016. “Ice Melt, Sea Level Rise and Superstorms: Evidence from Paleoclimate Data, Climate Modeling, and Modern Observations that 2°C Global Warming Could Be Dangerous.” Atmospheric Chemistry and Physics 16: 3761-3812. doi:10.5194/acp-16- 3761-2016. http://www.atmos-chem-phys.net/16/3761/2016/.
Hansen, James, Makiko Sato, Pushker Kharecha, David Beerling, Robert Berner, Valerie Masson-Delmotte, Mark Pagani, Maureen Raymo, Dana L. Royer, and James C. Zachos.
“Target Atmospheric CO2: Where Should Humanity Aim?” 2008
Hubbert, M. King. 1982. “Techniques of Prediction as Applied to the Production of Oil and Gas in Oil and Gas Supply Modeling,” in Saul I. Gass (ed.), National Bureau of Standards Special Publication 631, pp. 16-141. Washington, D.C: National Bureau of Standards.
IPCC. Intergovernmental Panel on Climate Change. 2014. Climate Change 2014: Mitigation of Climate Change. Contribution of Working Group III to the Fifth Assessment Report of the Intergovernmental Panel on Climate Change, Summary for Policy Makers.
Maddison, Angus. 2010. “Statistics on World Population, GDP, and Per Capita GDP, 1-2008
Political Economist. 2014. “World Energy 2014-2050,” Peak Oil Barrel, June 23 to July 3, 2014. Part 1, 2, and 3 can be found here:
World Energy 2014-2050 (Part 1)
World Energy 2014-2050 (Part 2)
World Energy 2014-2050 (Part 3)
Rutledge, David. 2007. “Hubbert’s Peak, the Coal Question, and Climate Change,” Excel
Workbook. Originally posted at “Estimating Long-Term World Coal Production with Logit and Probit Transforms,”Excel Workbook, 2011
World Bank. 2016. World Development Indicators.
Yao, Tianliang, Zheng Haitao, and Li Zhiwei. 2014. “Gansu Hexi 500 Wan KW Guangfu Jiudi Xiaona ji Tiaofeng Fenxi (Analysis of Local Absorption and Load Balancing for 5 Million KW Photovoltaic in Hexi, Gansu),” China Electric Power 47(3): 14-18 (March 2014).
438 responses to “World Energy 2016-2050: Annual Report”
This is the sort of big picture analysis that would ordinarily cost the rest of us more than a few bucks to get it from a commercial analyst. We all owe P E a big round of thank yous. I won’t have any more to say about it until I can take a few hours to digest it, other than that it will save me many hours personally as I try to get a book together.
Thank you Ron , thank you Dennis, thank you P E.
Thanks also to everybody else , especially those who point out errors or blind spots, etc, in my own comments. I would much rather be wrong now than later, lol.
ISLANDS OF EDEN, a proposed solution to the problem of climate forced mass migrations and rate of sola/wind development.
Create in appropriately sheltered areas of sea cost, floating islands, scientifically designed to be dwellings, solar farms, wind farms, and below, layers of fish, shell fish and seaweeds to provide ideal hatcheries and sea gardens.
These islands to provide room to allow mass migration without threats to existing countries and cultures.
Each island completely self supporting in food, energy and waste treatment.
Initial funding from countries presently threatened by mass migration.
Agreed, yes, thanks PE!
Re Table 2 and wind at 6c/kWh and solar at 14c/kWh. I’m seeing wind PPAs at 3c/kWh (Missouri, plus 2.3c PTC = 5.6c/kWh). I’m seeing solar PPAs at 3c/kWh (Dubai). Maybe the EIA’s capital costs are out of date?
These PPAs show wind at equal cost to nat gas (5.6c/kWh) and solar is cheaper.
PS Just found a Palo Alto solar PPA at 3.7c/kWh (after 30% ITC)
Hi JN2,
I don’t think Political Economist’s estimate includes the ITC, also he is using a very conservative estimate for the utilization rate.
If we assume a 30% utilization rate for utility scale PV (appropriate for new projects in the Southwest), the cost falls to $0.106 per kWhr if we ignore the ITC. If we include the Federal ITC of 30%, the cost falls to $0.066 per kWhr. There may be other state tax credits and costs might be somewhat lower than the 2480 million per GW assumed in these scenarios. I believe most of the recent PPAs are around $0.05 per kWhr, we don’t want to cherry pick the lowest cost projects.
We get close to 5 cents per kWhr by assuming 2000 million per GW (AC) for capital cost, include the Federal ITC, and also assume a 30% utilization rate in the Southwest US. Note that for a project with tracking in the Southwest, utilization rates are around 35% on average. Even with the 2480M capital cost and no ITC we get $0.081 per kWhr and with costs reduced by 15% due to the ITC, we get $0.71 per kWhr.
In the next 5 years cost might fall to $0.65 per kWhr even without the ITC and rising natural gas prices may keep solar competitive, assuming solar cost falls to 2000M per GW(AC).
Thanks DC.
>> we don’t want to cherry pick the lowest cost projects. <<
Except it proves what's possible to people who assume that renewables are only viable with government subsidies. These outliers on a consistently falling cost curve point the way ahead…
In other words, via PPAs, commercial companies are showing that they can provide unsubsidized wind/solar electricity at a price less than or equal to natural gas.
Hi JN, I and Dennis actually had lots of discussions about the costs, capacity utilization rates etc.
EIA capital costs are US averages. Some sates have lower costs.
My results should be read as follows: given the reported capital costs and the assumed capacity utilization rates, rates of return on capital, fuel prices, what the economic prices for various generating technology should be
It looks like the oil analysis is for conventional oil.
No mention of LTO. No one ever predicted that U.S. LTO production would increase 1 million barrels a day each year for three years.
According to the EIA the world has around 500 billion barrels of LTO that is producible. That number is still in the fast growth phase, and IMO may you out at around 2,000 Billion barrels.
Hi R DesRoches,
LTO for the World will be 100 Gb or less. Much of the hype is about resources in Alaska or Siberia, that LTO is unlikely to be produced unless oil prices are $175/b or higher, which is not very likely.
According to the EIA the U.S. Alone has the resources to produce 78 billion barrels of LTO, and the U.S. is only about 10% of world production.
Much of the LTO is from source rocks, and the rest of the world also has source rocks.
It has been estimated that the source rocks has about twice to oil in place as conventional oil.
We are just at the start of unlocking this resource.
Hi R DesRoches,
I believe the EIA is incorrect. US LTO output will be 30 to 40 Gb at most and the rest of the World possibly about the same amount.
US is about 1/9 of World C+C output (in 2015) and probably about 90 to 95% of World LTO output so far.
EIA estimates are not very good. The USGS estimates about 11 Gb for the ND Bakken, there might be 9 Gb in the Eagle Ford, maybe 11 in the Permian basin, and possibly another 9 Gb at most in all other lower 48 LTO plays (I am not including NGL which might be produced from shale gas plays). LTO in Alaska in highly unlikely to be produced.
An estimate of 100 Gb of LTO for the World is a very optimistic/unrealistic estimate imo.
Dennis
Thats not what is claimed for Alaska. This company backed by Paul Basinski say it can produce north slope shale at $39 per barrel mid price.
http://88energy.com/
Sounds too good too be true.
Hi Lightsout,
If it sounds too good to be true, it isn’t.
The EIA doesnt know what its talking about. Rather than quoting the EIA you should try to look up the prospective targets they include in their estimate, mention them, and then we can discuss them individually.
LTO development in rocks similar to the Bakken and Eagle Ford has a physical boundary, the recovery per well appears to be linked to fluid properties (the oil has to be low viscosity, a fairly high gas to oil ratio, and have above normal gradient pressure). The reservoir geometry has to allow drilling long horizontal wells, the zone can’t be interbedded with water bearing sands, etc.
When we screen reservoirs to account for these limits, add cost environment and economics, we see that outside the USA the prospective resources are slim.
Test yourself with a simple exercise: why is LTO so anemic in Australia? It’s a whole continent. What about Canada? It has a very dynamic oil industry. Venezuela? It needs light oil desperately to dilute the heavy oil. Mexico? Why can’t it even develop Chicontepec? Colombia? It has a very active oil industry…so what’s wrong with them?
I can see viable developments in some high graded spots in Russia, Argentina, and a few other locations. But the critical combination of properties just isn’t that common.
Hi Fernando,
Does my less educated guess sound reasonable? That is, about 60 Gb of LTO outside the US lower 48.
If not, do you have a rough estimate?
Thanks Fernando
Non pejorative question. Do you really think exploration and testing is far enough advanced to narrow light tight oil down so far? No likelihood in source rock in Middle East ? Venezuela couldn’t do more light with money? Mexico should have a continuation of. Us plays and is reforming the oil sector? Canada does a lot of fracking of something
Anyway I wondered what your view was on the geologic potential in a lot of these and if you think it known that it is not likely fruitful
Hi Fernando
So what is your view on Alaska shale?
Hi Political Economist,
I learned a lot from our conversations and I appreciate it.
Thanks!
I appreciate that too
The assumption of 10% of capital costs per year as annual fixed costs is unreasonably high for solar. Solar has extremely low maintenance costs. Based on actual quotes for maintenance fees for a solar farm, I’d say annual fixed costs are more like 0.4% of capital costs (that’s a high-end estimate).
Hi Nathanael,
The fixed cost also includes paying back the loan for the capital investment and depreciation, the 10% is not an unreasonable assumption, the fixed cost is more than just operations and maintenance.
So, paying back loans is NOT a reasonable thing to include in “fixed costs” — it’s an entirely different category, the financing category.
Different people’s cost of capital will vary *wildly*. With a giant cash hoard, Apple’s cost of capital is zero so its financing cost should be treated as zero.
Even so, 10% financing costs is way too high given that solar is normally financed at roughly 5% rates these days.
Hi JN2,
I just don’t want to overstate the case. Those very low PPAs include subsidies, if we didn’t have the subsidies today, the PPAs would probably be 6 cents per kWhr for the best projects, in the future this may become the average cost, it depends how quickly PV costs continue to fall, my guess is that the rate of decrease in prices will slow down at some point, it is not clear when.
I checked the 2015 Solar study by MIT and they have utility scale solar at $2/W in 2014. It isn’t clear if this is DC or AC. The median installed price in 2014 was $3/W AC with the lowest price projects (bottom quintile at about $2/W AC. Median prices fell from $6.3/W(AC) in 2008 to $3.1/W(AC) in 2014. Perhaps cost will fall to $2/W(AC) for the median utility scale system by 2020.
Hi DC,
Sure, the average may be higher, but my point is that even *without subsidies*, the low solar and wind PPAs are less than or equal to PE’s 5.6c natural gas. And the solar/wind price is trending lower each year…
Hi Jn2
My point is that the PPA price includes the subsidy. So claims that subsidies are not needed may not be correct.
One thing that favors solar is that output is during peak usage. A natural gas cc plant will be producing some output during off peak hours when prices are lower.
OK, add back in the 30% ITC to the Palo Alto solar PPA and you get 5.28c/kWh. Less than PE’s 5.6c for nat gas.
Add the 2.3c PTC to Missouri’s wind PPA and you get 5.3c/kWh. Less than PE’s 5.6c for nat gas.
My point is that even when adding the subsidies back into the PPAs, this results in a cost LESS than PE’s nat gas price.
Hi JN2,
Note that Political Economist used a relatively high natural gas price to reflect what may happen to future natural gas prices, if he had used a lower price for natural gas (say $3/ MMBTU) the price of electricity would have been about $.04/kWhr. At the present cost of natural gas wind and solar would have trouble competing without subsidies. It may be quite a while before we see natural gas prices at $5/MMBTU in the US. Hopefully natural gas prices will rise to that level before the subsidies expire.
That’s AC turnkey – likely even bonded, 500V 3 Phase Inverters are < .20 watt. Many Choices now in the "LunchBox" 20-50 kW Size. mount near the Array, saves on Balance of Systems Costs like high voltage Combiners on the DC Side, etc. Note there are a lot of Soft costs in such numbers.
“my guess is that the rate of decrease in prices will slow down at some point, it is not clear when.”
Speaking of trying to guess when the rate will change…
Political economist is guessing when the rate of solar installation will stabilize based on a linear projection from… um… a very messy looking bimodal distribution. Which means I don’t really think we can trust that projection. It’s a very hard thing to project.
Worse, nearly all the data points for solar installations are from prior to solar crossing the “price threshold” where it’s cheaper than the alternatives. And most of the wind data points are, too. I would therefore predict an acceleration as the threshold is crossed.
Hi JN2,
The companies fulfilling the PPAs at those low prices are getting the ITC, so the subsidies are included in those PPA prices.
Hi Old Farmer, it’s always pleasure to write here and talk to you and everyone else
So id we use this case as a baseline we just need to figure out how many nuclear plants have to be built to reduce coal use low enough that emissions drop below the RCP4.5 (the new baseline). Meanwhile we can continúe research on geoengineering and fix climate models so they stop predicting too high.
Hi Political Economist,
Thanks for the post, very nice work as always.
A few observations:
World oil is estimated at about 3600 Gb with 1100 Gb from the US, this is similar to my “high” estimate of 3600 Gb, my “medium” scenario is about 3100 Gb.
The 90 Mb/d projection for peak in 2021 seems quite high, the EIA scenarios are not very realistic in my view, I expect between 80 and 85 Mb/d around 2021.
Total US natural gas resources at the end of 2012 were about 1364 TCF according to USGS and estimates of 2P reserves (1.5 times proved) and cumulative production at the end of 2012 was about 1195 TCF for a URR of 2600 TCF, half of this would be about 1300 TCF which might be the approximate peak if production followed a Hubbert type curve. Cumulative US output was 1276 TCF at the end of 2015 so we should reach peak output in 2016. The EIA reference scenario for natural gas is not very realistic, it assumes over 70% of the US natural gas resource will be produced by 2040. I assume the Alaskan natural gas resources are unlikely to be produced.
The total World Natural gas URR estimate is about 14,000 TCF similar to the estimate of Jean Laherrere and my “low” estimate. My medium scenario is 19,000 TCF.
Note that proved plus probable reserves plus World Production from 1970 to 2015 and US output from 1900 to 1969 is 13,600 TCF. I have estimated 2P reserves as 1.5 times proved reserves in the BP Review of World Energy.
The natural gas URR estimate in this report is very conservative.
Coal URR is estimated at about 1100 Gt which is near my medium estimate for coal (1050 Gt).
Hi Dennis thanks a lot for the comments. I am glad that my estimates match either your “high” or “low” estimates.
About oil, please note that my “oil” is the BP “oil”, including both crude oil and natural gas liquids. I suppose you oil is crude oil only?
Hi Political Economist,
Excellent point (as usual). My estimate is for C+C, with NGL added it is about 400 Gboe (or 55 Gtoe) higher. So my medium scenario is 3500 Gboe or 480 Gtoe and is very similar to your estimate.
“…”Hubbert linearization applied to the EIA projection from 2031 to 2040 implies that the US oil production will not peak until 2081 when production rises to 833 million tons.”
Is it forecast a scientific or frivolous optimism?
What the graph of the image:
http://peakoilbarrel.com/wp-content/uploads/2016/06/Minqi-Figure-2.jpg
It has to do with considerations about Peak Oil in 2015 ??
and from this chart:
http://peakoilbarrel.com/wp-content/uploads/2016/06/US-Weekly-CC.jpg
Probably nothing more. More is the ideology of moderate cornucopian who claim that:
Oil “always ends in 20 years,” the term is still moved and eventually oil will never end.
https://en.wikipedia.org/wiki/Cornucopian
Hi Errata,
Political Economist says near the start of the post that the optimistic assumptions of the EIA are included to offset the tendency of Hubbert Linearization to underestimate. So Political Economist does not expect the EIA projections to be correct, he is just trying to get a rough estimate of future World URR for fossil fuels and other energy resources.
Dennis, that’s very nicely explained. Thanks.
Where would these massive quantities of oil come from. There must be some huge hidden fields where nobody’s looked!
Hi Frugal,
The “oil” is C+C+NGL. Hubbert linearization results in an estimate of 2500 Gb (or 341 Gtoe) of C+C less extra heavy (XH) oil. Jean Laherrrere estimates 500 Gb of XH oil so that’s 2900 Gboe, NGL URR will be about 400 Gboe, which brings the total to 3300 Gboe. Finally, there has been a tendency for the HL method to underestimate URR (in 2005 the estimate was 2000 Gb) so I have added 300 Gb to account for this, bringing the total C+C+NGL URR to 3600 Gboe (or 490 Gtoe). Political Economist’s estimate for World C+C+NGL URR is about 500 Gtoe, fairly close to my “medium” scenario.
That does not mean Political Economist is correct, but Fernando thinks my medium scenario is reasonable and he knows a thing or 2 about how oil is produced. I know far less than he does about the practical ins and outs of the oil industry.
I’m still having trouble with the EIA estimate of 160 billion tons of US URR versus 32 billion tons produced to date. This would imply that US oil reserves are only 20% depleted after something like 150 years of intense extraction. Is this reasonable?
Hi Frugal,
The US URR estimate is too high by about 100 Gtoe, but the rest of the World is too low by about the same amount, the two errors cancel, Political economist is interested in the World total and that estimate is approximately correct. Remember that his estimate for “oil” includes NGL, just like the BP production data. The World C+C+NGL URR is expected to be about 500 Gtoe or about 3670 Gboe (assuming 7.33 boe per metric tonne of oil equivalent).
Texas RRC data for April 2016 are out. As others will probably elaborate more on the data, I cannot resist to show the interesting situation of Texan natgas production (see below chart), which is in a stage of freefall and in complete contradiction to above scenarios for US natgas production.
It is also interesting to see how year over year % declines are leading the actual production data and indicate that the drop will march on much further. Even if drilling resumes, natgas production will not rise before year end due to the drilling time lag.
In the meantime, natgas prices continue to soar, smashing through USD 2.70. A heat wave in the SouthWest helps as power burn will reach very likely 5.5 bcf/d over the next few days. Natgas consumption soars despite – and in my view because of – high solar capacity in California. The high solar capacity does not reduce natgas demand yet drives it to record highs.
I am eagerly awaiting the official post, but from a first look oil production dropped slightly as well (20 kbp/day when comparing initial may vs. june numbers) – obviously significant revisions will take place, but initeresing to see that the decline has resumed after last months anomaly.
Also an interesting article: http://seekingalpha.com/article/3793456-will-oil-production-fall-cliff
daniel,
The World has seen many slowdowns, yet this one is particularily interesting regarding the role of shale oil and gas. Economically shale shale has shown clearly weakness below USD 50 boe/barrel.
What we will see over the next year is how fast and deep shale production will fall compared to conventional production. We will see in my opinion a new dimension.
yep. I had a discussion with some investment bankers in London and it is unbelievable in what dream-dimensions they live (they still beleive the shale oil propaganda). I feel like we are digging ourself a deeper and deeper hole. And I am startting to wonder how we we can ever get out of this
daniel.
Why do you think the financial community is having such a difficult time figuring out shale economics given access to production data, as well as detailed information in company 10K and 10Q?
I really cannot understand this disconnect, assuming it is an honest disconnect.
Clearly, just a cursory review of EPS for all US upstream companies for 2015 and 2016 should be able to clue these guys in?
Further, it would seem the financial guys would have some knowledge of reserve based finance of E & P’s and would see there is a problem when long term debt greatly exceeds 65% of PDP PV10 for practically every company in the space at $50 WTI and $2.60 HH.
Finally, have none of these guys ever thought of just doing the simple payout calculations that simple energy investors do (i.e. – what does payout look like in 36, 48 and/or 60 months?).
This stuff is not financial rocket science. So, therefore, I assume these guys either are modeling much, much higher commodity prices, or they have nefarious motives.
Have you had the “pleasure” to deal with those guys before? They are neither qualified nor interested in doing the proper research (their eyes start to glaze over when I mention some of the discussions that go on here). It is much easier for them to do the work based on the companies presentation material (there are obviously some smart and good ones out there, I haven’t met them yet though).
I think it would be dangerous to overestimate those guys (i.e. think they have some deeper knowledge, etc.)
I tend to stereotype most of those financial guys as cocaine-snorting party animals, which is probably unfair.
They are a mix. I’ve consulted for a couple of them. They ask the wrong questions, don’t listen very well, don’t do nuances, are always in a rush.
About 20 years ago I had a meeting with a senior type with a uk based investment fund. He wanted to make a commitment to buy several hundred million $ in another company’s shares, was pressing us to announce a field development so he could convince his management to go ahead and make the purchase. I explained we didn’t think the field development was viable, but we were willing to see what material he had available to show it could be done. He answered he had nothing, his company simply allocated a fraction of their cash to high risk investment, and this deal was indeed risky. So he had nothing to go on. Eventually we withdrew from the acreage, they bought a chunk of the other company, lost their shirts. I seem to remember that individual was eventually killed in Moscow trying to make deals with an oligarch.
It should have been posted on the earlier post ,but now since this is up ,I am going to post it here . This is for Denise (appreciate your work) who is far too optimistic . This is also for shallow sands who does all those fantastic analysis on the shale guys . SS I hope you outlast the punks , but frankly I am in Petro’s camp “The music is playing but the party is over ” . So here goes ,a copy paste job from Fitch :
Addendum: Fitch Blurb
We just noticed this small blurb from Fitch in our mail, summarizing the latest developments in junk land:
U.S. HY Energy Defaults Tally $13 Billion in May; June TTM Default Rate Approaching 5%
The June trailing 12-month (TTM) U.S. high yield bond default rate is closing inon 5%, reaching 4.7% after another $3 billion of defaults thus far this month, The $46.4 billion of recorded defaults this year is just $2 billion less than the total for the entire 2015.
Through mid-June, energy and metals/mining accounted for 84% of defaults ($38.9 billion). The May energy TTM rate stood at 14.6% following $12.7 billion of sector defaults last month while the E&P rate is at 28.6%. The average high yield bid levels are at 92.9, up from 91.1 last month and from 83.7 in February when crude oil prices were at their low point
Hi Hole in head,
To the pessimists, I am an optimist and to the optimists I am a pessimist. Everyone thinks their own viewpoint is realistic. Generally I take more optimistic assessments, like those of the USGS, and more pessimistic assessments such as those of Jean Laherrere and my estimate is roughly the average of those.
Seems a balanced approach to me, but most here prefer the pessimistic outlook, which is fine, we won’t know the future until it is in the past.
On the Wind and solar analysis, a different result for future wind and solar output is found by looking at the change in annual output (horizontal axis) plotted against the change in the change in output (second derivative of output wrt time) divided by the change in output (first derivative of output). Over the 2000 to 2015 period output was increasing exponentially so we can trivially show using calculus that d^2 W divided by dW (we assume a time step of 1 year so dt=1) is expected to be b, where
W=wind and solar output in TWhr and
W=ae^(bt)=f(t), dW/dt=bf(t), and d^2W/dt^2=f ”=b^2f(t).
so f ”/f ‘=b.
The chart of the data does not result in a horizontal line as expected, the slope is positive rather than negative as in Political Economist’s figure 14.
I do not expect Wind and Solar output will increase exponentially forever, but oil and natural gas output (combined) increased at 6.5% per year from 1900 to 1972. In that case, output was limited by demand so rising demand for energy as fossil fuels deplete may lead to faster exponential growth (faster than 6.5%/year) in Wind, solar, hydro, geothermal, and nuclear power.
Note that Wind and Solar output increased at an average rate of 22.6 %/year from 2000 to 2015.
Yep. The exponential trends are clearer if you separate wind and solar. They are growing on different exponential curves.
Wind is hitting a limitation — siting! NIMBYs are making it hard to expand, and this has slowed wind below exponential growth in the US (though not in some other countries where there are still good sites with few NIMBYs).
Solar is nowhere close to hitting a limitation like that.
Maybe because solar isn’t competitive without a complementary energy storage or gas turbine kit. Solar in Spain hit a wall when subsidies were reduced. The government was forced to change terms because the hydropower system is used to offset solar intermittency, and it has reached a limit. They could use natural gas turbines, but it increases the total cost too much, causes energy poverty.
In Spain’s case the answer may be to encourage the British to finance the high voltage connections from the UK to Spain, and subsidize solar power plants in Spain. It may even be possible to reverse flow and have some uk wind sent to Spain, although I understand they have reached a point where wind isn’t too popular.
The situation in Spain had nothing to do with “reducing subsidies”. If they’d just cut the subsidies, solar installations would have continued.
Spain’s Rajoy government actively started punishing people for installing solar by attempting to *ban* off-grid installations and place heavy taxes on *self-consumed* solar electricity. (So, you use your own solar power during the day — massive taxes!) This was accurately described as a “tax on the sun” and was frankly outrageous behavior designed to prop up the incumbent utility companies.
Hi Political Economist,
When I consider annual installation of wind and solar along the lines of Figure 14 in your report, but I expand the analysis to 2000 to 2015, the regression does not reject the null hypothesis that there is no relationship between the annual growth to installation ratio and annual installation, the t-stat for the slope of the line is -0.75 and we would expect a t-stat with an absolute value of 2 or greater to reject the null hypothesis at the 95% confidence level. The chart below shows the regression result as well as the upper and lower 95% confidence interval, the r-squared is 0.039. Thoughts?
Hi Political Economist,
A more interesting chart is the natural log of wind and solar annual installation vs year.
The rate of growth of annual installation of wind and solar power from 2005 to 2015 was over 21% per year.
One might argue that a 21% exponential growth rate cannot continue for very long, and I would agree. I expect the growth rate will gradually slow from 15% to 10% and eventually to 7.6%.
The annual growth rate of World oil and natural gas output from 1942 to 1973 was 7.63% per year, see chart below. The rate of increase was limited by demand for energy as is clear from the very low energy prices over most of this period. It is likely that when fossil fuel peaks in 2025 (or sooner), there will be plenty of demand for energy and the rate of growth in demand for wind and solar power will be more than 7.6% per year.
Solar market hitting new heights, as costs keep dropping
One of the great takeaways from 2015 was the falling price of electricity generated from solar. That trend has continued into 2016, with a solar bid as low as 2.99 cents per KWh in a recent bid in Dubai. This has seen solar become one of the most cost-effective power generation technologies, and looks set to continue into the future.
“Solar power is increasingly cost-competitive with fossil fuels and distributed solar is cheaper than retail electricity in many countries,” said Michael Schmela, executive advisor of SolarPower Europe and lead author of the report. “In 2016, solar also became cheaper than on-shore wind power in parts of the globe.”
These trends have seen SolarPower Europe up its estimates for future PV installations from the forecasts it presented last year. The estimate in the Global Market Outlook 2015-2019 was that there would be 450 GW of installed PV by 2019, but the current report forecasts that 516 GW of installed PV will be the most likely scenario for 2019.
“Solar is booming and continues to break records in many parts of the world, which gives us reasons to believe 700 GW globally installed solar power is possible by 2020,” said President of SolarPower Europe Oliver Schafer. However, for this to be the case, a stable regulatory environment that understands renewable energy is needed.
How does this fit with the projections in this thread?
The 20%+ growth rate for solar has continued since the 1970s. Arguing that it can’t continue “for very long” is an argument from incredulity, and has no basis. It will continue for a very long time; it already has. It’s actually been *accelerating*.
Obviously it can’t continue FOREVER.
But if you seriously look at the question of when the 20%+ growth rate will slow down, by comparing when other such technology-adoption exponential growth rate curves slowed down, you will conclude that it will be sometime after solar power is covering more than 50% of the addressable market, and possibly after it covers 80% of the market.
That’s still quite some years from now.
Hi Political Economist,
Wind and solar consumption in 2015 was about 125 GW on average for the year.
Recent rates of growth have been about 16% per year so in an “optimistic” scenario I assume growth is 16%/year from 2016 to 2020, 14%/a from 2021 to 2025, 12%/a from 2026 to 2030, 10%/a from 2031 to 2035, and 8%/a from 2036 to 2050. For comparison I show a steady 12%/a growth rate, 10%/a, and 8%/a from 2016 to 2050.
Note that this is output not capacity, capacity would be 3 times higher (if utilization rate was 33.3%). If all primary energy demand was electric by 2050 (highly unlikely), I expect energy demand would be about 9000 GW.
Chart below, the 10% scenario may be doable, the others (especially 12% for 35 years) would be a bit of a stretch. 🙂
Hi Dennis,
Thanks a lot for posting these graphs on wind/solar. Yes, the quasi-Hubbert linear trend for wind/solar is sensitive to the section of years. But note your R-square for the first graph above is only 0.039
If I start at 1999, R-square is 0.098 and the implied maximum installation is 240 GW
There are a couple of reasons that I choose 2005 as the staring point. First, in 2005, annual installation exceeded 10 GW (12.6 GW).
Second, R-square is 0.26, not too bad.
Thirdly, the near term forecast roughly matches GWEC/IHS
Fourth, the long-term forecast roughly the total conventional capacity by 2040-2050.
Of course, in the future, the annual installation of wind/solar my exceed 175 GW. But so long as, say, the annual installation stays below about 300 GW before 2050, the overall impact on total energy consumption/economic growth will be limited (about 0.2-0.3%/year in term of growth rate).
The purpose to use existing data and show what it indicates given the current trend but double checking the implied results in 20, 30, and 40 years and how reasonable it is.
But results could be on the conservative side. But given that my projected installed capacity of wind/solar by 2040 is about three times that of EIA, my results should be considered to be within the reasonable range.
Hi Political Economist,
The EIA scenarios are pretty bad, they are way too optimistic on fossil fuel output (particularly natural gas and oil), this makes their assumed demand for renewable energy far lower than will be the case.
Almost all analyses suffer from this problem.
In general, choosing one’s regression to get the result you would like is not the best statistical method. 🙂
Also the regression on 2005 to 2015 has 9 degrees of freedom and to reject the null hypothesis (that the variables are not correlated) at the 95 % confidence level the absolute value of the t statistic should be more than 1.83, in this case the t statistic is -1.79. This might lead one to try other regressions which leads to confirmation that the correlation is not very good as was the case with the 2000-2015 regression where the null hypothesis is not rejected at an 80% confidence level. The 1999 to 2015 regression also has a positive slope for the upper 95% confidence interval and if we use a 60% confidence interval the upper bound has an x-intercept of 1971 GW. That means there is a 20% chance that the x-intercept is greater than 1971 GW and at least a 2.5% probability that the slope is positive rather than negative.
The limit on capacity additions will be demand for energy in my view.
Given that wind/solar is still in the early phase of development, any statistical exercise must be preliminary. In fact, even for supposedly mature resources such as oil and gas, we’re still struggling with competing HL methods. That’s just the pity of statistical analysis that we cannot overcome in the short run. I think both you and I recognize this.
That has been said, I still consider 6600 GW by 2050 is a reasonable one. Using your criteria, I think it will fall well within the 95% confidence interval of any reasonably estimated installed capacity by 2050.
While EIA’s prediction for wind/solar is likely to be pretty bad, I have no particular reason to reject their projection of conventional installed capacity. EIA’s world conventional and nuclear capacity will increase from about 5500 GW now to about 7000 GW by 2040. So total conventional/nuclear capacity will increase by 1500 GW from 2015 to 2040 or by about 2000 GW from 2015 to 2050 if the trend continues
My projection implies that wind/solar will grow by 6000 GW from now to 2050, accounting for three-quarters of the total growth of installed capacity (adding 6000 GW to 2000 GW of new conventional/nuclear capacity).
According to EIA, wind/solar is projected to grow by 900 GW from 2015 to 2040 or by about 1200 GW from 2015 to 2050 if the trend continues. Thus, under EIA’s projection, the total installed capacity will grow by about 3200 GW from 2015 to 2050.
Presumably EIA’s projection is based on estimates of future electricity demand. If the 3200 GW has an average capacity utilization rate of about 40 percent, then it can be replaced by 6400 GW of wind/solar.
Thus, assuming that EIA’s projection of future electricity demand is reasonable and even if wind/solar will only be demand constrained, 6000 GW would still meet almost all of the future incremental demand for electricity.
Hi Political economist,
If the EIA is incorrect on their fossil fuel forecasts it will effect the demand for electricity and their demand forecast for electricity will also be incorrect.
In the future I will present a post showing an alternative way of predicting the future.
I disagree that the 6600 GW of installed solar and wind capacity by 2050 is reasonable, demand for electricity will be much higher than forecast by the EIA, and if hydro and nuclear to not grow as much as you predict (they remain fixed at 2015 levels), then 12,000 GW of wind and solar capacity will be needed by 2050 (if we assume a 25% utilization rate). That would require an average annual growth rate in cumulative capacity of 8.8% per year for wind and solar combined. Less will be needed with some growth in nuclear and hydro.
Don’t mix wind and solar output. They’re following entirely separate curves.
In the recent past, solar was doubling every two years, wind every three years. Wind has a substantial head start. Those are *very different curves* and aggregating them leads to confusion.
It’s like reporting “coal + oil production” and trying to draw a single exponential curve for it, you get gibberish.
Shallow
Saw this today
http://www.streetinsider.com/dr/news.php?id=11753616
“Marathon Oil Announces STACK Acquisition”
Un conventional Oil Play?? Har! GOR > 60% ??
Again, for anyone in doubt, just subscribe to IHS Energy, US Data Online.
Just browse these wells, and explain how these companies can dub SCOOP/STACK as an oil play.
Again, I am not arguing economics, I am arguing these are NOT oil plays, at least not after the initial (12-24 months) liquids “kick”.
Some of these wells do produce a lot of gas, based on the IHS data.
In fact, Texas tea has indicated here he is an investor in wells in these plays, and he has agreed with me. Well over 50% of the BOE from these wells are/will be natural gas.
I would caution SS, that the past may not be an indicator of the future. I have pointed out before, the oil windows of these plays have yet to be developed. My take away is this, MRO is a big player(top 3) in scoop and stack. They are using this downturn to high-grade their portfolio for future growth. I do not know the details of the properties they sold but do understand the economics of scoop and stack. I understand why they did what they did. You guys need to begin to follow this play in more detail. There are a better part of 4 counties that will be in the oil windows of these two plays. And as the name implies there are multiple targets overlapping. How the EUR will compare to Eagleford or Bakken I do not know but the market gave MRO a thumbs up to with a 10% move.
Texas tea.
I just looked at both Marathon Oil and Pay rock’s horizontal wells in OK.
I stand by my views that these wells are gas wells.
Less than 1/3 of the wells wherein Pay rock is operator produced any oil in the most recent month.
Less than 1/4 of MRO’s have cumulative oil of 50K BO or more, none have cumulative of 200K BO, and only 1/8 of their OK hz wells produced 3000 BO or more in the most recent month.
What else do you suggest we go by besides well histories?
Why do the companies insist these are oil plays? Almost half of MRO’s OK hz wells have surpassed 1 million mcf, which is nothing to sneeze at IMO.
But it is gas. If I own a mine and find much more silver, can I still call it a gold mine if I find even a small amount of gold?
Further, what is API of this oil? My recollection of CLR’s Poteet Unit was gravity of 58-60 API.
Hi Shallow sand,
I believe they have a name for that kind of oil, don’t they call it condensate? 🙂
Dennis. Upon additional review, it appears that the cumulative BOE on the recently purchased MRO acreage is 25% oil and 75% gas, and that current production is likewise 25% oil and 75% gas. However, removal of one well that has just one month of production history changes current production to 15% oil 85% gas.
These wells tend to have 30 day oil IP of 15-25K BO, but stop producing oil within 12-24 months.
That is what they are calling an “oil window”.
I will watch this play over time and see if the oil portion increases. Texas tea thinks it will, but I am not seeing that yet.
Noteworthy that OK has over 13K active hz wells, and less than 3% produced 100 BOPD in the most recently reported month. That compares to about 12% nationally.
If you give me the API, GOR, I can tell you if it’s condensate. I don’t like the term BOE, it’s a bullshit term that came in vogue to inflate oil reserve numbers in a subliminal fashion.
It’s very unlikely anything above 48 degrees API is oil. You also have to understand what’s the oil viscosity in the oil window. Some of these plays have a gas condensate trapped down dip, and a medium crude up dip. The oil has higher viscosity (because the reservoir is cooler), it has less gas, and reservoir pressure is also much lower. This reduces well IP.
So what is oil in the Vapour phase?
Hello SS,
I think I understand why we are not communicating with one another. The Poteet unit is in the gas condensate portion of the wood ford. I am involved in 3 units in the immediate area of the poteet. The operators active in scoop have largely “focused” on the gas condensate window over the last two years for a better ROI. The oil windows of the play are defined but not developed and as you will note in the last CLR presentations have economics similar to both the Bakken and Eagleford. Page 5 May 2016 presentation with single well break-evens in the mid $40’s. I am not suggesting your analysis in not correct, I am just suggesting that as oil prices recover the mix of production in this trend is likely to change.
http://oilprice.com/Energy/Energy-General/Why-We-Can-Expect-Cripplingly-Higher-Oil-Prices-In-The-Near-Future.html
In any event, I focus on $$$ and ROI, so I have no real pig in the race of who is right?
TT. Give me names of oil window wells and I will look them up.
I think if you go back and look, Poteet was initially described as an oil play and IP discussed in terms of BOE.
Also, what is API gravity of oil on the wells you own? I guess more importantly, do you get paid near WTI?
As I posted above, less than 3% of all hz wells in OK produced 3,000 BO or more last month, I also set forth payrock’s wells, at least 3/4 of BOE being gas in the oil window.
CLR is saying 1.7 million BOE EUR. Do they say how much is oil?
Edit: Went back and looked at CLR OK hz wells.
Springer wells I would classify as oil.
Would you agree the large majority of CLR hz wells in OK don’t have cumulative of 100K BO and aren’t currently producing 3000 BOPM?
I am just looking at raw production data. Is there a reason why none of the OK companies will publish well cumulatives?
to the best of my knowledge there are two fully developed units in the oil window as defined by CLR one is the Good Martin and the other is the May, 6n5w Grady County. I have the production on the Good Martin to December but no info on the May Unit. I will be interested in your conclusions, MRO is drilling two wells on us “next door” to these units as we speak.
Weird. Found 8 Good Martin wells. Zero May wells.
Good Martin shows no production since 11/15, and that month was minimal.
Is there some kind of confidential status, or something else going on, where the online data would not be accurate?
Hey SS, Raw Energy has a new post up about the E&P borrowing base at Seeking Alpha.
SS, yes I think there is, I have a source that helps me get the info, I won’t post the production. The Good Martin unit has only been on 15 months, the unit is still early in its production life so I am not drawing any conclusion just yet and i do not have the pressure info to help me form an opinion. I can say the production has been flat for 7 months up to december. I assume that they are producing it in the same manner in which I have wells with CLR that were brought on line during this low price environment. That is, after flow back they produce the wells at a steady stable rate which I am sure is to provide some cash flow now but at the same time preserve as much of reserves as possible for a higher price environment. That’s what i would do? If we had $5 nat gas and $100 oil they may produce them differently, I hope to find that out.
Reno: Thanks for the heads up. Great article by very strong author. I made a comment about the huge reduction in estimated future production costs and development costs from 12/31/14 to 12/31/15, using CLR as an example.
I have not been able to get much traction on this. Either I am missing something, or it is possible that most LTO companies had to really make some stretches in order to have ANY PV10.
Shallow, when analyzing the economics of a well, or field, or entire “play,” of course it matters how oil and or natural gas production is reported. You are 100 % correct for being perturbed by this SCOOP/STACK stuff. Reporting a well whose revenue stream is 75-80% gas, as oil or liquids, by gas to oil “equivalents” is absurd. It is a distortion of the facts and meant to be misleading. Until three years ago even the most prominent of distorters would report BOE as a percentage of liquids, now most of them have quit doing that. Wonder why? For one reason, to get 1.2 MBOE EUR’s ! For another reason, 58 degree condensate prices take a big negative hit to actual oil prices.
I don’t know what the price of natgas is in OK. If it’s like Texas, it sucks. Its discounted value at the moment is less than zilch. If at $ 1.50 net per MCF (and I am being very liberal) the gas to oil conversion should be 25-30:1, NOT 6:1. Therefore the notion that this OK stuff has some secret oil leg that has yet to be developed, awaiting higher oil prices, is a little wonky.
With regard to RI and ORRI, I can sometimes be guilty of irrational exuberance myself. Then the operator in me takes over and reality sets in. That stuff up there is no different that any other unconventional resource play. It declines like an anchor being dropped from VLCC in the open ocean and is hugely unprofitable.
Keep up the good work.
Mike
Mike,
goodness, I have been drilling wells with my own money for over 30 years. We made money in each of the last 3 quarters on our mix of properties across several states and our mix of product and our mix of interest, ORRI, WI,RI . I know first hand about some of the production in scoop. You may not be open to the facts and that is fine, leaves more room for those with opens mind to exploit. NO skin off my nose. By the way the Btu content of scoop gas is 135o. This is not investment advice but you have a couple of contributors to this blog that have been right with regard to the market fundamentals and exploiting the unrealistically low prices we have seen of late. They have made money, just satin? one last quick point, based on interest in a couple of dozen wells in scoop, I can say at $4nat gas and $80oil, the roi will be as good or better, risk weighted, than most anything I have participated in, over the entirety of my career. I am not all wells in scoop, but in the core areas.
You made money in Q1 2016 in North America onshore?
That is pretty good considering how much the likes of XOM and CVX, etc lost in North American upstream in Q1, 2016.
All our production in onshore US, its the mix of assets. My only point SS is I do know how to run a business and economically evaluate an oil prospect. That is what keeps me between the lines so to speak, I can’t constantly be wrong like climate change scientist and still make a living?The key strategy for long term survival has been and will be, during boom times set money aside: during frenzy’s, go to the beach: during bust allocate reserved capital for future growth.
What on earth does the BTU content of gas have to do with reporting gas as though it were oil? This makes no sense to me whatsoever. I am very open to facts, I deal with them every day. Production data does not lie. It takes time to sort the BS out but ultimately it can be done, as Shallow has proven. Tell your SCOOP/STACK boys to quit the BOE BS and start being transparent.
Here is what is going on in the SCOOP, because the same thing is happening in the PB: The word is out on the Bakken, Eagle Ford and Niobrara. UR is not going to fall in line with the EUR bunk and the economics are bleak. Money is getting scarce. So now everyone is running to new territory where there is little data to support the same old shale oil propaganda machine. Accordingly, some shale oil companies are getting good mileage out of being the first in the new subdivision and even raising some more money, believe it or not. Lenders, for the most part, have ADD. Lets talk in three years when there is more data. That stuff will suck just as bad as any other shale play, betcha.
you ask about the price of gas in okla. I gave you the information to help determine what the price was/is?
we do not have WI in the Bakken, hayneseville, Barnett or Eagle ford. We do have WI in scoop, we do have RI in a number of those plays. All shale is not created equal, as an oil man you should know that.
As for betting, i do that every time I drill a well and I’ll let the drill bit keep score?
texas tea: Can you educate me a bit about the Scoop Play. I haven’t worked the area much since my Gulf Oil days working Hunton in the area. In your opinion, how many months would bring payout (at $2.50mm/BTU, and $60/BB oil, 75% NRI lease, to a WI owner in the top 20% of wells.
Doodlebugger,
It is really to big of question because of the number of variables. What I can say is that in the gas/condensate window, with the parameters you mentioned, most wells will provide a real rate of return based on the wells we have interests in. Personally, if I believed we would be in a $2.50mm/btu and $60/BBoil environment for the foreseeable future, I would not be drilling anywhere. I believe that to keep production steady we need at least $4mm/btu and $70Bo, may be even higher. I can add for SS that i have the updated production on the Good martin unit oil window Woodford Scoop (46 API) the production across the 8 wells in the unit over the last 4 months, and if the number are correct they are not impressive. As say said, i do not draw conclusion until i have all facts.
Mike: Glad to see you still fighting the good fight of putting some real world oilfield sense in the discussions.
Question: 1.
We in US have we are told we have a huge stockpile hangover. If the oil in pipelines is counted as storage, how many long huge cross country pipelines have been built during the boom through your area? We have one through us that goes from west Texas through central to Houston. If those pipe volumes are counted as storage, they will probably never be drawn down after the initial volume is added.
2. Do you believe that the promoters of LTO will have money shoved to them fast enough to bring about another price collapse as the market seems to believe.?
Hope you are finding some good purchases to take some pain out of this downturn.
Hi, Doodle; I hope this finds you well. I can make money at 45 dollars but I still get a burr under my saddle over the shale oil industry’s bullshit. Which seems to be getting worse.
Question 1 is a good point, sir. I side with our old friend Jeffrey Brown on this issue of supply overhang and the quality of the oil in storage and not in very good favor with end users. When Mexico stops being a net exporter, and Venezuela implodes, LTO is going to take some big price whacks simply because there won’t be anything left to blend it with. I look for it to take a long time for Cushing to drain. I produce a lot of low gravity sweet stuff and its getting a premium price now for the first time in four years.
Question 2: LTO reserve inventory is not being replaced and the discounted value of those PDP reserves is dropping like a rock. Some companies are now in a bind with the SEC over EUR’s and the IRS is bearing down on PUD reserves. The bottom line is the debt to asset ratios of all but 2 to 3 public shale oil companies is abysmal and new OCC regulations imply most of those guys can’t legally borrow more money; they have 2-3 mortgages on their homes already, and their MasterCards are maxed out. The shale oil industry is dead in the water if it cannot borrow more money and that gets harder every day, IMO. I think the shale boom is over, thankfully, and we should not worry too much about another 70% price collapse, no.
So go find some grease, man!
Mike
Thanks man: We’re shaking off the dust and starting to “think” of getting busy again.There’s still good oil out there under the right rock and we are determined to find it! We had a good little discovery that has pulled us through this Depression, though it was a shame to give the oil away to hold on.
Shallow,
I think at this point it does not matter if they are oil or gas fields or how the fields are classified. With Fed announcing that would not have legal problem pursuing negative rates it is completely clear that main goal is to keep broke debtors alive and prevent the gigantic debt bubble from imploding. With negative rates being essentially tax on the savings Fed is basically saying to investors to keep sinking money in anything that resemblance of hard assets in some distant hope that prices will recover before they run out of oil or gas. Good luck with that in the case of high depleting shale. So with negative rates boxes of brass fixtures could be more attractive than cash tomorrow. Markets are broken.
Military presence and giant nuclear icebreakers increasing in Murmansk Russia. NPR news.
http://www.npr.org/2016/06/20/482750870/arctic-circle-welcomes-summer-solstice-with-24-hours-of-daylight
A new area of contention for the world, the Arctic Ocean.
That NPR article is mostly bullshit. The Russian navy has limited access to ice free ports other than the Kola Peninsula, where Murmansk is located. The Russian northern fleet has always had a large set of bases and facilities all along the peninsula, plus the White Sea.
The Russians, like the USA, feel they have a strategic need to sustain a ship building industry with military and nuclear power capabilities. This means their budgets are set up to have continuous delivery of nuclear submarines. Adding nuclear powered ice breakers is a reasonable option.
As regards resources, the most viable resource oil targets are in the Kara sea and Yamal peninsula. Yamal has supergiant gas reserves, and there’s a couple of supergiant fields in the Kara – already discovered in areas which freeze over in winter but are open water in summer time.
I see USA elites very keen on delivering anti Russia propaganda which inflates a conflict started by the USA during the Clinton years. Their whole approach is incredibly stupid.
Did you even listen to the broadcast? It is not an article, but a radio program.
lol busted! Me thinks he didn’t listen to it but as seems usual has a thorough opinion of it. It’s probably a Castro-Obama conspiracy lol.
I think it is you, who was busted. Did you open the link ? It does contain the transcript.
GoneFishing,
No so fast. Your link contains transcript so you are misleading people here. And even if it does not would not this does not make NPR material any different. NPR sucks. Badly. Corporatist propaganda is propaganda even if it is sold under the “Public” label. There is nothing “Public” in NPR anymore. It probably should be renamed National Neoliberal Corporatism Radio. In foreign news/events coverage the content is mostly annoying, despicable neoliberal propaganda 24 x 7.
I just read the transcripts (which is in your link). And I can confirm that is a typical bullshit+ anti-Russian propaganda of the globalist part of the US elite (Killary friends from GS and like :-). If you think otherwise you probably should eat the transcript shredded into Borscht. That might help.
There is such thing as county economic zone. For Russia north border is in Arctic. What a despicable presstitutes…
And as for military spending, the USA is the world leader and I think still outspend all other nations combined. So this girl is performing the trick which is called “The pot calling the kettle black.”
BTW if I were Russian, I would take some precautions in case some psychopathic warmonger is elected in the next Presidential elections.
That does not means that Russia does not have problems. It is also a neoliberal state. Much like the USA. But that’s another story.
Yes, the Russians are such nice peaceful people who never go to war, never take over small countries, never look out for their own interests using military power and recently have destroyed their nuclear arsenal because it was so abhorrent to them.
They should be named Sweeties instead of Russians, because they would never try and cause trouble or take more than their fair share.
[…] Source link […]
Charts and graphs created based on historical trends are no doubt very useful in at least allowing us to gain some insights into what will likely come to pass in the future.
But I can’t see betting on such trends holding. Maybe they will. If the technology of oil extraction advances fast enough, maybe we will be able to produce oil in ever increasing quantities for another decade or two. Ditto gas. But if the cost of extracting ever lesser quality reserves from the ground goes up in terms of real money, as seems likely to me, then the question that follows on next is can we increase the efficiency with which we use oil and gas fast enough to compensate for the increased cost of the same so that we can AFFORD to use it ?
And it does not follow that people , and countries, and the world economy in general, or national economies, will act or react or perform in expected ways.
There is a very real possibility, and in my own opinion, a high probability, that some countries and maybe a lot of countries will be reacting with great vigor to cut their consumption of fossil fuels, especially IMPORTED fossil fuels, within the next few years. There are some very good reasons to expect such a trend to emerge, including such considerations as economic and military security, support of domestic employment and industry, reduction of trade deficits, etc.
Discrete actions that will be taken to reduce dependency on imported ( and yes depleting domestic reserves) of fossil fuels will include new and higher fuel consumption taxes, fuel efficency mandates, prohibitive taxes or out right prohibition of the sale of large personal vehicles, tougher building codes, faster build out of mass transit systems, etc, and ABOVE ALL, the construction of more wind and solar farms and also more small scale solar installations. ( Wind just doesn’t scale DOWN economically worth a hoot and probably never will imo. )
With the cost of wind and solar power falling, and the real price of fossil fuels almost inevitably decreasing, there is a strong possibility in my opinion that the wind and solar power industries may grow far faster than just about anybody expects for the reasons I have mentioned, which in a nutshell boil down to about half politics and half economic reality.
Putting one’s faith in technological progress is a very dangerous thing to do, because progress is always spotty and uneven. Some industries will become far more efficient, some will still be plodding along the same old way decades down the road, unless they become obsolete.
But it’s a safe bet now that pure electric and plug in hybrid cars and soon light trucks will be as affordable as conventional cars and light trucks. It’s a safe bet that the cost of HVDC long distance power lines will be coming down. Within five or ten years our overly self satisfied and complacent construction industry will be able to install a turn key small scale pv system for the same cost as German crews do it today.
A lot of people consider the phrase ” military intelligence” to be a world class oxymoron, but the generals of the world are actually pretty damned sharp, taken as a group, and personally I expect them to throw their weight behind any workable plan to reduce the dependence of their own countries on imported fossil fuels.
The magnitude of this support is hard to estimate, but in a country such as China, which is mostly governed by technically well educated people who are used to thinking in the long term, it means the military establishment will support the renewables industries as a matter of sound professional judgement.
My gut feeling is that unless a really bad economic environment prevents it from happening, the renewables industries are going to grow like a house afire for the next couple of decades at least.
If economic times are get to be very hard as the result of energy shortages, then countries will do the same thing they do when threatened with war- tighten the old belt in respect to everything else, and put every possible man and machine to work on producing munitions- except in the case of energy, the effort will be directed to the renewable energy industries.
I too believe the growth in PV over the next 5-7 years will rapidly escalate, and really surprise the average Joe/Juan/Juang.
When can I buy a 5% USA Solar Savings Bond?
The Feds have a huge swath of land in the sunny and windy western territories- BLM for example (and yes the cattle can still graze).
Hope Hillary has a good interior/energy secretary picked out.
What I forgot to mention is that scenarios such as the ones I just outlined are examples of why linear thinking probably fails as often as it works in when making long term predictions.
If just one important variable factor changes noticeably, it may result in half a dozen more changing in response, and the assumptions used in making the model or prediction are thus shot to hell.
…..Yeeeee…!
While you are being quite conservative (read: linear) with your:
“…it may result in half a dozen more changing in response….”, you are on the right path with regard to how our society/civilization today works.
I am happy I helped.
Be well,
Petro
Projections based on historical trends are always subject to limitations.
But I’ve some confidence in the wind/solar results to the extent that my results are far more “optimistic” than EIA and broadly match the industry predictions. The long-term results (about 6600 GW of wind/solar) by 2050 roughly match the total conventional generating capacity projected by EIA. If intermittency remains a binding constraint on wind/solar, then one-to-one match between wind/solar and conventional generating capacity seems reasonable.
Of course, there may be breakthrough in storage by then but there may be not.
For the very long run, the assumption that 10% of the total area that is expected to be used for human infrastructure by 2100 will be committed to solar seems a reasonable one. Wind is assumed to rise to 4000 GW in the very long run (based on Castro et al)
I should note that even if I assume an annual installation of 300 GW of wind/solar after 2020, the result will not be drastically changed.
This will add about 3750 GW of wind/solar by 2020. With 20% average capacity utilization rate, this amounts to 750 GW of electric power or 6570 TWH or 1487 million toe. This will raise the total primary energy consumption in 2050 from 16234 million toe to 17721 million toe and the average energy consumption growth rate from 0.4% to 0.7%, thereby raising the average economic growth rate also by 0.3%. The underlying world economic growth rate may begin to fall below the 2% growth rate by 2035 rather than 2030.
No impact on emissions, assuming the extra wind/solar will be used to accelerate economic growth.
It should also be noted that as wind/solar substitutes for the marginal (therefore more expensive) fossil fuels, at least in the short run, surge in wind/solar makes fossil fuels cheaper, as we are observing right now.
Hi Political economist,
That 6600 GW is an interesting number. If we take primary energy consumption in Mtoe and multiply by 0.38 (to eliminate the 62% of energy lost as heat in the average power station) we get about 5000 Mtoe of energy converted to electricity (some of the energy is used for transportation but losses are even higher there, about 70%).
If we multiply 1 Mtoe/year by 1.328 we get the equivalent power in GW (GJ/sec), and that turns out to be, wait for it … 6600 GW! Coincidence? Probably not, but an interesting scenario. If the deCastro estimate of 1 TW maximum foe wind is correct, then 5.6 TW will need to be solar. There could also be an expansion of hydo, geothermal and nuclear, in addition energy needs will increase to about 9000 GW by 2050, so potentially Wind and Solar could provide 73 % of energy needs (not including waste heat in power plants and ICEV) by 2050.
A widely distributed interconnected wind and power network with capacity about 2.5 to 3 times average load will be able to meet 90% of load hours with backup from batteries, fuel cells, pumped hydro, and natural gas.
The complaint is that this will be expensive, my reply is that drilling for oil and natural gas is also expensive and will become more expensive as depletion continues, so we should get started.
I agree that there will be a limit to how quickly wind and solar can ramp up, but this will mostly be determined by demand. If energy is scarce and energy prices are high, output of energy from wind and solar will grow exponentially until energy supply out runs energy demand, then supply growth will simply match growth in demand.
There is no need for one to one backup for wind and solar. My guess is that the paper looked at too small an area, power can be transferred across political boundries. In China the unit of analysis should be the entire nation not a single province. For Europe, the entire EU should be analyzed or all of Europe because country sizes are small. When the wind is not blowing or the sun is not shining in some places, there will be sun and wind in others. Many studies have shown this.
On reading your comment more carefully, I realize that you are talking about capacity and I was talking about output. So if we assumed an optimistic utilization rate of 25%, then 6600 GW of capacity is only 1650 GW of output.
That is quite a conservative estimate, I think wind and solar capacity will grow much faster as fossil fuel prices rise and as peak fossil fuels becomes apparent to all.
2016 is the year of cheap renewables, not oil
While much attention is devoted to the fall of oil prices, 2016 has seen a significant expansion in the development of renewable energies.
The global oil price slump has dominated the news for months, as exporting nations and energy companies worry about losses. Low prices are affecting both established exporters, such as OPEC, as well as newer competitors like U.S shale production. Cheap oil has led many to raise questions about the impact on renewable energy. Much has also been made about cheap oil hampering investment in renewables.
This may have been the case ten years ago, yet throughout the second half of 2015, and first six months of 2016, renewables weathered the global price slump handily. Eight million people now work in renewable energy sector, and countries from Jamaica to Japan are increasing investment.
Reading the linked article, I also discovered an interesting fact which, I consider good news for my island nation,
Indeed the countries with the largest investments in renewables relative to GDP are Mauritania, Jamaica, Honduras, and Uruguay; not to mention the fact that Morocco has the world’s largest solar farm.
Morocco’s solar plant has received huge subsidies. Time will tell whether it was worthwhile. It’s an interesting large scale pilot, so we’ll see.
Hi Dennis, the about 6600 GW refers to installed capacity. To be precise, 6585 GW by 2050 (current world total installation of all types is about 6000 GW). With 22% capacity utilization rate, it generates 12520 THW or 1448 GW in term of rate of generation. 12520 THW translates into 2833 Mtoe (shown in Table 3)
The TW de Castro et al talked about refers to rate of generation. I have converted it to installed capacity based on capacity utilization assumptions (see the section on wind/solar limitations). Thus 1 TW of wind plus 2 TW of solar becomes 17,000 GW potential of installed capacity (in my view) by 2100 not 2050.
Castro et al has long-term solar potential to be 2-4 TW. I take the lower one as the end-of-century potential given the assessment of what is a reasonable proportion of future human infrastructure committed to wind/solar. If you take their upper limit for solar and assume it can be realized by 2100, then the implied annual installation probably doubles my current estimate.
If you take Castro’s wind/solar estimates, the total future potential would be 5TW. Current world primary energy consumption (13000 Mtoe) implies 6.6 TW (13000*4.4194/8760). So wind/solar can provide roughly 80% current world energy consumption.
Hydro et al, I think, will be only a fraction of it, perhaps about 1 TW. Future nuclear potential may be similar.
So in a nearly fully renewable future, world total energy consumption will be about the same magnitude as the current one with renewables providing 90% and nuclear providing perhaps 10%.
Hi Political economist,
Remember that there are almost no thermal losses for the energy produced by wind and solar, so if are using mostly wind and solar and have 5000 GW, that would be equivalent to 5000/0.38=13157 GW, the way we produce energy at the moment. Note that deCastro severely underestimates solar potential. There is a lot of land that is not productive for agriculture is not forest where solar PV can be sited, transmission lines take the energy to the population. For a better estimate of solar potential see
http://physics.ucsd.edu/do-the-math/2011/12/wind-fights-solar/
A conservative estimate is 18 TW for solar, at least 2 times more than current energy demand, only about 0.6% of land area is needed, assuming PV panels have 8% efficiency.
Hi Dennis, we need to be clear about the units being used and use it consistently.
When I cite 2-4 TW from de Castro et al., I use the term “TW’ in the same way as the authors use it. That is, it refers to the rate of electricity generation.
1 TW so defined equals 8760 TWH or 753 Mtoe if we just count the energy content of electricity (8760/11.63)
To convert that into thermal equivalent, you can divide 753 Mtoe by 0.38. The result is 1982 Mtoe. You can also get 1982 through 8760/4.4194
Using this definition, the current world primary energy consumption is about 6TW.
So I don’t see your point of dividing 5TW by 0.38.
To avoid confusion, consider the following: 5TW*8760/4.4194 = 9911 Mtoe, clearly less than the current world primary energy consumption of 13000 Mtoe.
de Castro assumed 500,000-1 Million KM2 to be used for solar. The world’s total unused land is about 40 million KM2; total hot deserts and very degraded land is about 15 million KM2. de Castro points out that even in areas with high population density such as Northwest Europe, human settlement is only 10% of the land area. 500,000-1 Million KM2 represent roughly 3-7% of hot deserts. I find these assumptions reasonable and cautiously optimistic.
Hi Political Economist,
The BP takes 1 GW of electricity produced by wind or solar and creates a “thermal equivalent” in primary energy using units of Mtoe/year. If they reported primary energy in Watts (J/s) rather than Mtoe/year, then ! TW of electicity output would become 1/0.38= 2.63 GW of primary energy.
The point is simply that less primary energy is needed when there are fewer thermal losses (as much as 62% less).
I agree that 5 TW is less than current primary energy consumption, the 5TW is the de Castro maximum for Wind and Solar, which I believe is incorrect based on David Murphy’s analysis.
I was taking de Castro’s 5 TW and converting to primary energy that would be used by a thermal power plant in TW, that is all.
The solar forecast of 4 TW by de Castro I think is unrealistically conservative, by at least a factor of 4.
As I suggested, Murphy’s estimate is 0.6% of the Earth’s land area is needed to produce 18 TW of electricity using PV solar, rather than the 4 TW estimated by de Castro.
I am not suggesting we will see these levels of output before 2100, simply that the solar resource is far larger than de Castro has estimated.
I assume nuclear and hydro remain at approximately current levels and most energy will eventually be provided by wind and solar (primarily solar), with some pumped hydro as backup, along with batteries, and fuel cells.
de Castro’s wind study is very much in dispute: it excluded a lot of things arbitrarily.
For example: it excluded oceans over 200m deep, when a 2011 project was already at 320, and the project sponsor said the tech can go to 700 meters.
So often, things look like limits when they’re just things we haven’t done previously because we didn’t need to.
The fact that the assumed limit had already been exceeded shows a lack of imagination.
Intermittency isn’t a constraint on wind or solar now, let alone in the future when there’s more storage.
While wind & solar substitute for the marginal fossil fuel, which drives fuel prices down, they also have a different effect. They make the *most dispatchable* fossil fuel (natgas peakers) more valuable because it potentially acts as a complement or backup for the rare occasions when renewable output is poor, while *less dispatchable* plants (in order from most to least dispatchable, CC natgas, coal, and worst, nuclear) lose value.
However, batteries are already cheaper than the average natgas peaker, and they’re dropping in price. Batteries don’t have to compete with the coal plants for the role of “complement to intermittent wind”, they only have to compete with the peakers.
And now you see how the the electricity market shift is going to play out. Inflexible baseload will shut down first. Batteries will replace peakers. CC natgas will remain in the “middle” for a while, I don’t know how long.
It’s pretty much impossible to suppress the growth in solar installations, though several jurisdictions are trying to do so with punitive taxes.
Intermittency isn’t a constraint on wind or solar now, let alone in the future when there’s more storage.
To all those who simply do not understand or more likely don’t want to understand that storage, especially battery storage, is not a deal breaker with renewables. I strongly suggest they follow the flight of Solar Impulse2 currently flying across the Atlantic ocean. You can log on and watch their daily flight profile and how their energy production and consumption actually works in real time!
http://www.solarimpulse.com/widget-energy
You are in denial.
LOL! I think the same of you!
” If intermittency remains a binding constraint on wind/solar, then one-to-one match between wind/solar and conventional generating capacity seems reasonable.”
NO, NO.
If you want 10 GW “baseload” power and you assume a capacity factor of 33% of noncorrelated generation, then you overbuild wind threefold (30 GW). Your conventional back-up is of course only 10 GW.
Please forget this “wind and PV need a 1:1 backup” nonsense.
“This will raise the total primary energy consumption in 2050 from 16234 million toe to 17721 million toe”
Primary energy is a very inconsistent book-keeping rule when we are talking about the conversion of fossil energy carriers on one hand and and RE on the other: In case of RE the primary energy is equal to the final energy, in case of fossil or nuclear energy not. Argueing with final energy makes more sense IMHO.
The important economic concept to think about — which is missing from *far* too many analyses — is the concept of substitution. When a substitute becomes cheaper, suddenly demand shifts from one product to another…
Toyota could own this market if they wanted to. But the 2017 Prius 8.8kWh Battery PAK is a Total Joke.
“The 2017 Toyota Prius Prime, as the new PHEV is called, will have an 8.8 kWh battery pack and an EPA-rated electric range of 22 miles.”
https://chargedevs.com/newswire/is-toyota-warming-up-to-battery-evs/
I suppose Toyota is selling the PRIUS model about as fast as they can comfortably build them and secure batteries at a decent price. My guess is that within two or three years the Prius will get another overhaul, mechanical and cosmetic, and come with a much longer battery only range.
But even twenty miles is enough for a lot of people to cut their gasoline consumption to the bone, and it also means the battery is small enough to recharge it conveniently overnight with an ordinary outlet and extension cord at home, or even at work in a lot of cases, without adding any new wiring or charging apparatus.
Hi Longtimber,
The current Prius plug-in only gets 11 miles or so for a charge, my current tank of gas is just under half and I have gone about 500 miles so far, 22 miles would be much better, but I agree a bigger battery would be nice, but they are probably aiming for a certain price point. As battery prices decrease they may offer a better battery as an option in future models, or they may offer an EV Prime at some point.
22 miles is fine with me. I think I may buy one in 4-5 years. My diesel only has 50,000 km.
Hi Fernando,
Very cool, in 4 or 5 years range will probably be higher, I know you don’t like EVs much, but a plugin hybrid will probably be cheaper than a diesel, you will run the numbers and decide what you think is best I am sure. I hope to be in a Model 3 in 5 or 6 years.
Thank you Political Economist for such a fine article.
By following EIA projections you are firmly grounded in conservative optimistic outlooks, slightly tempered by the Hubbert linearization technique.
Too bad you don’t do the same with your climate projections, which clearly are not up to the high level of the energy analysis. You should have stuck to IPCC projections, because Hansen’s crazy hypotheses are rejected by almost everybody as fantasy scenarios.
Well, I don’t find Hansen’s works either crazy or fantasy.
Anyway, my paper only provides emissions projections. For the relationship between my emission projections and future temperature change, I reply upon IPCC (exactly as you recommended)
“According to Intergovernmental Panel on Climate Change’s Fifth Assessment Report, cumulative carbon dioxide emissions of 2.4 trillion tons from 2011 to 2100 are within the range of “representative concentrated pathways” RCP 4.5. It will lead to atmospheric concentration of carbon dioxide equivalent of 650 parts per million by 2100 and result in a median estimate of global warming of 2.6 degrees Celsius by 2100 (compared to 1850-1900), with about one-third chance that global warming by 2100 may actually exceed three degrees Celsius (IPCC 2014, Table SPM.1).”
I am sure we can find more than one climate scientists who will agree with Hansen that 3-degree warming by 2100 will be catastrophic.
Leaving aside that the 3°C relies on models that show a strong tendency to overestimate warming, those 3° are measured from preindustrial, not from current temperatures, so the projected warming, that is on the upper side, would be over 1°C, but less than 2°C, from current temperatures. Hardly catastrophic.
What is completely out of proportion with respect to IPCC projections is sea level rise. IPCC credible emission scenarios project a mean increase of sea level of 0.4-0.5 m by 2100. That’s probably an upper limit since sea level rise has been 2-3 mm/year since the sea started to rise over 100 years ago, so an extrapolation of the past 100 years of global warming gives less than 0.3 m by 2100.
Hi Javier,
There is no reason to assume the sea level rise will be linear, most of the excess heat being absorbed by the planet is warming the ocean, in addition polar amplification is likely to lead to substantial ice sheet loos from Greenland.
Many biologists think that 2 C above 1750 temperatures is cause for concern,
In any case we will need to transition away from fossil fuels as they deplete, don’t you think? Coal pollutes worse than any of the fossil fuels, so it would be best to start reducing that, then we can work on oil (which is where the depletion problem will be worst) and eventually reduce out use of natural gas for energy (we will continue to use it for fertilizer).
The mainstream view of climate science, might be correct, if it is not we will still need energy.
Hi Dennis,
There is a total disconnect between what we see and measure and what we are promised, and that is probably the main cause why most people in the world are not that concerned about climate change.
Sea level rise is not that different now from what it was 100 years ago, when CO2 emissions were insignificant. There is no good reason to think that it will be very different in the next 80 years. We have duplicated our emissions several times with very little effect on sea level rise, and we are not going to duplicate our emissions again.
Greenland melting dangers are greatly exaggerated. According to IPCC a collapse of the West Antarctic or Greenland ice sheets during this century is “exceptionally unlikely.” In fact, research shows that “observed [Greenland glacier melting] acceleration indicates that sea level rise from Greenland may fall well below proposed upper bounds.” (T. Moon, et al., 21st-Century Evolution of Greenland Outlet Glacier Velocities. Science 336, 576-578. 2012).
And with temperatures we have the same disconnect between what we measure and what we are promised. See figure below from RSS (http://www.remss.com/research/climate). Future temperatures are very likely to be well below projections.
Global warming since 1750 has been very positive for the planet and mankind. It is difficult to understand why it suddenly should turn very negative even if it continues to 2100. The benefits of global warming have been real, the dangers remain hypothetical.
It is curious that people that are conservative in their energy estimates will go wild with their climate estimates. Climate change is unlikely to develop into a serious problem in the 21st century, and most scientists think so, but we are told a very different story.
And yes, we are either leaving fossil fuels or fossil fuels are leaving us. That is a lot more likely to develop into a very serious problem for mankind in the 21st century that climate change. Reducing our dependence from fossil fuels is a worthy goal in my opinion. It is just not happening in a significant way as to make a difference, though.
“Fig. 1. Global (80S to 80N) Mean TLT Anomaly plotted as a function of time. The blue band is the 5% to 95% envelope for the RSS V3.3 MSU/AMSU Temperature uncertainty ensemble. The yellow band is the 5% to 95% range of output from CMIP-5 climate simulations. The mean value of each time series average from 1979-1984 is set to zero so the changes over time can be more easily seen. Note that after 1998, the observations are likely to be below the simulated values, indicating that the simulations as a whole are predicting too much warming.”
It’s really interesting to see how the climate nomenklatura does twists and turns to cover the model inability to match the data. Did you read the Cowtan, Haufstader, Hawkins et al paper?
Hi Fernando,
The satellite temperature data is not very good. The BEST data is best.
http://eprints.whiterose.ac.uk/95782/1/blend_paper.pdf
Thanks.
An exercise in turning around a failed prediction afterwards so it doesn’t look so bad. I anticipate that this type of reverse “post hoc, ergo propter hoc” is going to become even more common now that El Niño is over and temperatures are falling at the fastest rate in the satellite era.
Seems to me that many climatologists are dedicating more and more of their research to justify why climate isn’t turning as predicted. We paid them to make lousy science and we are paying them to cover their asses.
Hi Javier,
I did not say collapse, just melting of ice sheets which has been accelerating in Greenland based on the experts that study the ice sheets there.
BEST temperature data is better than RSS.
That is just an opinion.
Hi Javier,
The chart you posted from RSS can be found at the link below
http://www.remss.com/research/climate#Atmospheric-Temperature
That page pointed me to the following post that suggests an explanation.
http://www.skepticalscience.com/Response-Data-or-Dogma-hearing.html
I will take the opinion of Carl Mears(of RSS) and Ben Santer over that of Ted Cruz.
And I rather take the data at face value over the opinion of anybody.
Hi Javier,
Interesting, I think there are experts who know more than I do. From the page where the chart is found, they explain:
Why does this discrepancy exist? One possible explanation is an error in the fundamental physics used by the climate models. In addition to this possibility, there are at least three other plausible explanations for the warming rate differences. There are errors in the forcings used as input to the model simulations (these include forcings due to anthropogenic gases and aerosols, volcanic aerosols, solar input, and changes in ozone), errors in the satellite observations (partially addressed by the use of the uncertainty ensemble), and sequences of internal climate variability in the simulations that are difference from what occurred in the real world. We call to these four explanations “model physics errors”, “model input errors”, “observational errors”, and “different variability sequences”. They are not mutually exclusive. In fact, there is hard scientific evidence that all four of these factors contribute to the discrepancy, and that most of it can be explained without resorting to model physics errors. For a detailed discussion of all these reasons, see the post on the Skeptical Science blog by Ben Santer and Carl Mears.
Whatever the explanation, the world is not warming as much as predicted. No assurances that in the near future it will warm as much as predicted either.
That is a fact. The rest is not.
Hi Javier,
The fact is that there are many different models and some have been closer than others. As I showed above, the CSALT model developed by Webhubbletelescope using data from 1960 to 2000, has predicted temperatures pretty well. Nobody has claimed that the models are perfect, nor has anybody denied that there is natural variability that is not well explained.
Anybody expecting a perfect predition of future temperature will be disappointed.
The fact is we don’t know which temperature data set gives a better representation of global temperatures, over land, I believe the surface temperature data gives a better representation of average land temperatures throughout the planet than the satellite data. You can present one data set as fact and the other as “not fact”, but I am not buying it. Some times the models have under predicted temperatures and sometimes they have over predicted, that is a fact.
Hi Javier,
There is not a big difference between the UAH satellite data and the BEST Land ocean data, I adjusted both data sets so that the Jan 1981 to Dec 2000 average would be zero.
As to which is “best” the satellite data doesn’t have coverage at the poles where (especially in the North) the temperature anomaly is greatest. There have been a number of problems with the satellite data over time, perhaps they have all been corrected, I have not looked into it very carefully.
The BEST trend is 1.8 C per century and UAH is 1.5 C per century over the 1979 to 2016 period.
Nobody has coverage at the poles as there are very few thermometers and huge areas are never registered. It is all the product of adjustments. The Arctic is covered in ice in the winter and water in the summer, and nobody is measuring the air temperature there. Big assumptions are being taken, and in fact one of the main differences between HadCRUT and GISS is the difference in those assumptions.
Satellites take actual measures for most of the polar regions up to 80°, and have the huge advantage of being immune to Urban Heat Island effect. They also take measurements over all the oceans without relying on ships passing by. Also they don’t have to worry about water temperatures being different from air temperatures.
Thermometers excel at taking local temperatures but to get to planetary temperatures from a disperse and irregular collection of local temperatures requires a lot of assumptions and decisions. Satellites instruments are designed to take measurements over huge areas and thus more adequate to measure planetary temperatures.
You can take your pick, but it is hard to defend that BEST is the best.
Hi Javier,
There are a lot of theoretical assumptions and subjective decisions that go into converting the MSU signals to temperature for several different satellites that suffer from orbital decay, instrument drift, positioning errors and many other issues. If the satellite data resulted in a higher temperature trend you would be all over these various problems and might claim that the satellite data should not be trusted. The many issues with thermometers are addressed by the Berkeley Earth Group which set out to show how bad the surface temperature data was and came up with an improved data set that mostly agrees with the NDIC, GISS, and HadCRUT data. They have shown that the urban heat island effect is not a problem with their data.
On the land, where most humans live, warming is projected to reach 2 C above 1850-1900 average temperatures by the end of 2016 by Berkeley Earth.
http://berkeleyearth.org/temperature-reports/april-2016/
Dennis,
Those assumptions were the same for the 1979-2003 period when both satellites and surface stations show the same rate of warming. Afterwards they diverge. Initially HadCRUT3 was more in line with satellites than with GISS, but then it was changed to HadCRUT4 that restored the agreement of surface measurements.
It is impossible that on the same planet two measures of temperature diverge indefinitely. One way or another they will have to converge.
Hi Javier,
For UAH and BEST Land-Ocean data the trend from Jan 1979 to Dec 2003 are different, not the same as you assert.
For UAH data the linear trend has a slope of 0.132 K/decade, for BEST land-ocean the slope is 0.179 K/decade.
When the trend for the 1979 to April 2016 period is calculated, the trends actually match better with UAH at 0.15 K/decade and BEST at 0.18 K/decade.
Chart for 1979-2003 below will be posted in a wider window below.
Chart with 5 year averages for BEST and UAH data.
Hi Javier,
This is why the data do not “speak for themselves”.
How the data looks is sensitive to the choice of data as the UAH satellite data and BEST data agree pretty well over the entire period. I chose the 1981 to 2000 period average (using monthly data) as the zero point for both data sets.) and used the centered 5 year average for comparison.
UAH data can be found at link below
http://nsstc.uah.edu/climate/
BEST data at link below:
http://berkeleyearth.org/data/
Hi Javier,
I placed the equations for the trend lines on my chart above in the wrong places (though the text in the comment got it right), my apologies.
The trend for monthly data from Jan 1979 to April 2016 is:
BEST Land Ocean trend – 0.18 K/decade
UAH trend – 0.15 K/decade
Chart below
Hi Javier,
Continued from above I will post the 1979 to 2003 chart for UAH and BEST Land Ocean data here.
Chart for BEST and UAH monthly data from Jan 1979 to Dec 2003 with linear trendlines.
The trend was not the same for the two data sets from 1979 to 2003, for UAH the trend was 0.132 K/decade and for BEST Land Ocean data the trend was 0.179 K/decade.
As I showed earlier for Jan 1979 to April 2016 the UAH trend was 0.15 K/decade and for BEST Land Ocean it was 0.18 K/decade.
These are facts.
Hi Dennis,
No. These are not facts but reconstructions of a human definition called global average temperature that is subject to constant revision and has no real existence.
Between 1979 and 2003 temperature databases show a smaller spread in their trends than afterwards. Nobody argues the warming of the 80’s and 90’s. Most scientists however recognize that the warming rate reduced in the 21st century against expectations. This period shows a bigger spread in warming trends between different databases. I am no saying anything new with all this.
Hi Javier,
What you are saying depends on the data set chosen. When the UAH satellite data trend from 1979 to 2003 is compared with the BEST Land ocean data set over the same period the difference was larger than over the 1979 to 2016 period.
One also must realize that the models used inputs that were guessed in 2005 for emissions, and other factors. If the inputs into the models are incorrect the output will be incorrect. In addition there is natural variability that will cause temperatures to wander above and below modelled output.
Here’s Webhubbletelescope’s simple CSALT model on land temperatures from BEST.
See http://contextearth.com/2013/10/26/csalt-model/
Chart below.
The CSALT model below uses BEST land ocean data and the coefficients of the model use only the data from 1960 to 2000 in the regression so the model after 2000 is a forecast and the model before 1960 is a hindcast.
Hi Javier,
Probably correct that there will not be serious problems due to climate change in the 21st century, I am not that shortsighted however. Geoengineering is likely to cause more problems than it solves in my view as there are often unintended consequences.
If my medium estimates for fossil fuels are correct and “equilibrium climate sensitivity” is 3 C or less we may remain at 2.5 C or less. Unfortunately I am often wrong.
In any case we do agree that transitioning to alternatives is important, so why not just focus on that?
We actually are not far apart on climate change so I will just ignore that, because it mostly generates heat and very little light.
Agreed
Hi Dennis, I suppose neither you nor I will live beyond, say, 2070.
Before that climate change is probably tolerable. But towards the end of the century, major catastrophes (such as sea level rise by several meters) cannot be ruled out.
Hi Political economist,
Possibly sea level rise will be a problem by the end of the century, it seems there is considerable uncertainty, which in my view is a major reason to be cautious.
The smart move in my opinion is to transition as rapidly as is practical to non-fossil fuel energy.
A carbon tax or fee and dividend type of policy would be a step in the right direction and would allow subsidies to be reduced or eliminated.
Yes, to be cautious.
I agree with transition towards non fossil fuels as rapidly as possible.
I also like the idea of carbon tax and dividend (as a second best). My preferred “best” is planning or Richard Heinberg’s cap, rationing and reduction.
Unfortunately neither the first “best” nor the second “best” will become the political mainstream for the next about 30 years.
Hi Political economist,
I am not a big fan of planning unless I am in charge. 🙂
But seriously, with proper tax policy, I think it makes more sense to just let the market pick the most efficient solution. I agree neither policy is likely to be implemented, but in the West your second best, and my first choice have a slight chance of becoming law.
Hi Political Economist,
I focused on the “planning” and immediately thought in terms of a Soviet style planned economy, which I do not think you meant.
So a cap plan, could work better than a fee or tax plan as we would have a certain carbon limit we would aim for. A given amount of carbon “credits” could be issued to all citizens and as long as they could be freely traded to eliminate black markets, that seems a viable policy.
The problem with taxes or fees is that they are unlikely to be set high enough to meet the goal, so I see your preference for this approach and agree it would be better.
I still think the tax or fee approach (though inferior) is more likely to make it through a US legislature. Maybe Europe (which is light years ahead of the US) could implement the Cap and trade type plan (with no giveaways to big business) and eventually the US can follow. Almost anything would be better than the current US policy.
Dennis, I actually meant Soviet style planning. Of course, not exactly.
But what you described, capping the total and dividing it up among the citizens, is basically like how the Soviet Planning functioned.
We can talk about the pros/cons of planning another time. But the US basically had a quasi-planned economy during WWII. Gov spending was more than 50% of GDP and government investment was more than 80% of total investment.
GDP doubled in five years. The peak US per capita GDP in 1944 was not surpassed again until the 1960s.
So planning could be a very effective way for short term mobilization to achieve clearly defined social goals (by the way, the Soviet war economy also worked well and the Soviet civilian economy actually worked reasonably well until the 1970s).
It is not difficult to imagine how a WWII style planning can be implemented technically but not for war mobilization but for decarbonization, say, building 100 GW wind/solar annually, construction of electrified high speed railways, and compulsory retirement of gasoline powered cars.
As I said, I do not object second best options. However, I see the political chance of carbon tax and dividend only marginally better than the above revolutionary option.
Hi Political Economist,
I guess that could work, but would require a crisis to allow it to happen (which is probably what will occur).
The difficulty is allowing too much power in the hands of the government, though one could argue that power has already been ceded to the very wealthy.
As long as the people controlling the planning are democratically elected and they can convince the electorate that a planned economy is the best way forward, maybe it could work. I just don’t see it happening in the US unless there is a Great Depression. I am hopeful that proper Keynesian policies can keep the wealthy firmly in control. 🙂
Just as any “free” society should be.
Hi Dennis,
My idea of ‘geoengineering’ is about human populations mobilizing in a kind of war-time-like effort in planting a whole lot of diverse plants native to their regions, including edible varieties. It may have unintended consequences, but they might be mostly positive, like encouraging self-/community-empowerment outside of BAU-dependence; native wildlife diversity; and beneficial microclimates. ?
‘Alternative’ energy buildout, depending on what or how, is a source of concern for a number of reasons which I have already mentioned across my comments.
Welcome back, Javier. ?
Primobile
Thanks Caelan, but I haven’t been gone. Just reading the articles but not commenting. That’s what I do when I don’t have much time.
In a comment in February I expressed my view that the fall in oil production in 2016 was going to be upward of 1 mbpd compared to peak production in 2015, and I was alone, against the opinion of Dennis and AlexS. I am not sure I am going to end up being wrong on that one. We are in June and the drop is starting to look quite awful.
http://peakoilbarrel.com/oil-price-and-its-effect-on-production/#comment-560987
Hi Javier,
It is not emissions, it is the amount of carbon dioxide in the atmosphere that matters and the carbon dioxide persists for a very long time. The excess heat is constantly being absorbed by the ocean, the ocean expands, sea level rises.
Despite your claims the rate of rise has increased.
Perhaps or perhaps not. Satellite altimetry does not show any statistically significant increase in the rate of rise for the past 23 years, and tide gauges show a much lower sea level rise than satellites, so your claim that the rate of rise has increased is not supported by the data. I mean it is really hard to justify any alarmism on this data.
The figure:
[It does not load. It can be found here:
http://www.star.nesdis.noaa.gov/sod/lsa/SeaLevelRise/slr/slr_sla_gbl_free_txj1j2_90_400.png
]
Hi Javier,
There is a lot of ice that could potentially melt at higher temperatures. See
http://www.nature.com/climate/2010/1004/full/climate.2010.29.html
Also
http://oceanservice.noaa.gov/facts/sealevel.html
Records and research show that sea level has been steadily rising at a rate of 0.04 to 0.1 inches per year since 1900. Since 1992, new methods of satellite altimetry (the measurement of elevation or altitude) indicate a rate of rise of 0.12 inches per year. This is a significantly larger rate than the sea-level rise averaged over the last several thousand years.
The last phrase is deceitful.
Typical alarmist BS. We know sea level has gone up and down over the last several thousand years, so its average has no meaning. Comparing an annual average with a millennial average is stupid. Look at the data and you will see a modest rate of sea level rise for human standards (2-3 mm/year). That is what we have and all the rest is speculation.
Javier said:
Projecting & more peddling of crap. Much more interesting is finding the pattern behind ENSO and El Ninos. Almost there
http://contextEarth.com/2016/06/10/pukites-model-of-enso/
Hi Javier,
Opinion only.
Hi Javier,
When Global temperature has changed in the past sea levels have changed significantly, do you dispute this?
Global temperature has changed significantly in the past 240 years, especially over land where the ice sheets and glaciers that might significantly affect sea level exist, (sea ice melt will not directly impact sea level).
How much melting will occur will depend on future temperature in Greenland, the sea level rise may happen gradually over millennia, but the recent rate of change in atmospheric CO2 is unprecedented in the last 800,000 years. Potentially the ice sheets may melt more rapidly than anticipated, this is an area of active research and there is a great deal of uncertainty. Your assertion that there will be no change in the rate of ice melt in the future is opinion. The future is unknown.
Dennis,
This is a published reconstruction of sea level change for the past 2000 years (Grinsted et al. 2009). As you can see it makes no sense to talk about “the sea-level rise averaged over the last several thousand years.” The average would be close to zero despite similar increases and decreases to the present one. Notice two things:
– The scale. Sea level changes are modest, about half a meter.
– Sea level is believed by some of the specialists to have been higher during the medieval warm period.
Future projection by IPCC is shown. Once more it is worth to notice that there appears to be no cause for alarm.
Hi Javier,
So the IPCC is correct as long as it agrees with you. If the very conservative assumptions made by the IPCC is correct, there will be not problem. Long term, after 2100, sea level rise may be a problem.
Most of the coastal cities were far smaller in the medieval warm period, the problem may not be catastrophic for many, but for many cities near the coast and other low lying regions it will be a problem.
I will be difficult to move Manhatten to higher ground.
just for some balance on the risk of CO2
https://wattsupwiththat.files.wordpress.com/2016/06/moore-positive-impact-of-human-co2-emissions.pdf
One item in the article that I have keenly observed myself, is that increased CO2 in the air has greatly accelerated plant growth from historic norms. Comparing historic photos to today, brush and small plants are much more abundant on the landscape these days. Naturally this phenomenon can be extended to agricultural interests, in which case we can certainly conclude that perpetually increasing CO2 bodes very well indeed for global food production well into the future.
Hi Leo,
Except that the crops will be affected by temperature as well and the planetary flora and fauna are relatively well adapted to climate corresponding with atmospheric CO2 in the range of 180 ppm to 290 ppm for most of the last 800,000 years.
There is clear evidence that higher co2 levels do enhance agricultural productivity, everything else held equal, but the devil is always in the details in such arguments.
It is not yet clear that when all the variables involving co2 concentration under real world conditions are taken into account that agricultural productivity will rise.
There is a very strong probability that changing climate, which means the same thing as changing weather in this context, brought on MOSTLY by rising co2 levels, will result in a DECLINE in average agricultural productivity on a world wide basis.
Such reading as I have done, which is more than a little, leaves me personally convinced that on a global basis, rising co2 levels are a very BAD thing for agricultural productivity.
Rising CO2 levels are strongly associated in the climatic literature with higher temperatures , more random rainfall patterns, including more flooding and more droughts, etc.
CO2 induced increases in productivity are significant, but not game changers.
Increases in flooding, drought, scorching hot temperatures during growing seasons, rising sea levels, salt water intrusion into coastal area water tables, etc ARE real game changers in terms of agricultural productivity.
The geography of the land masses of the Earth, and the distribution of people over these land masses is such that any increases in agricultural productivity in northerly climes will be dwarfed as a PRACTICAL matter by offsetting losses in temperate and tropical areas, WHERE THE PEOPLE ARE, and where food must be produced locally, for the most part, due to economic realities.
The people of India are not likely to to be able to afford food grown in Siberia, and the northern regions of Canada are never going to amount to much as farm land. The last giant glaciers scoured such soil as once was there away down to bedrock for all intents and purposes. There wasn’t much to begin with, due to PREVIOUS glacial scouring.
FOR all intents and purposes, agriculture hardly exists in the extreme southern parts of the world. Antarctica will be too cold for the foreseeable future. Australia is mostly desert, and about maxed out already. The rest is all ocean excepting some small island nations not too far from Australia.
It is generally accepted by agricultural professionals that forced climate change is real, and that it is a grave threat to food production long term. The warming is of course mostly the result of rising CO2 levels, with other greenhouse gases playing only minor roles.
There’s some silver lining in every storm cloud, but rising atmospheric CO2 levels are coal black storm clouds in terms of agriculture, world wide and long term.
From a USDA paper:
Photosynthesis is the process whereby plants combine solar energy with water (generally from the soil) and CO2
from the air to produce glucose, a simple sugar. When classified by photosynthetic pathways, crops are generally
divided into two groups—C3 or C4—depending on the number of carbon atoms in the first compound into which
CO2 is incorporated during photosynthesis. Experimental yield responses for C3 crops (e.g., wheat, rice, barley,
oats, potatoes, and most other crops) to 700 parts per million by volume (ppmv) of atmospheric CO2 (approximately
double the 1995 concentration) average 30 percent higher, with a range of −10 to +80 percent. The yield response
of C4 crops (corn, millet, sorghum, and sugar cane) to increases in atmospheric CO2 is lower (Reilly et al., 1996).
A commonly used estimate for the yield response of C4 crops to 555 ppmv of atmospheric CO2 (double the preindustrial
and 225 ppmv above the 1990 concentration) is 7 percent (Rosenzweig et al.). Estimates for other yield
responses to 555 ppmv of atmospheric CO2 are: wheat—22 percent, rice—19 percent, soybeans—34 percent, and
all other C3 crops—25 percent (Rosenzweig et al.). Knowledge of the benefits of elevated CO2 on many tropical
crops is incomplete (Gitay et al.).
The size of the effect of CO2 fertilization on yields of field crops under commercial production, however, is
uncertain. It will be small in regions where low fertilizer use or other factors limit crop growth. Benefits associated
with water use efficiency will also be smaller in regions where water stress is a minor problem. Some of the direct
effects of CO2 will also be offset by the direct detrimental effects on crops of other fossil fuel emissions such as
sulfur dioxide and ozone. CO2 fertilization also may have some detrimental impacts. Although crop quantities are
likely to increase, grain and forage quality declines with CO2 enrichment (Gitay et al.). Some forage crops, for
example, contain lower concentrations of protein when grown under high concentrations of CO2. In addition, the
competitive advantage of C3 weeds may increase relative to C4 crops (Reilly et al., 1996). Finally, reduced
transpiration and higher leaf temperatures could affect climate by raising air temperatures and reducing precipitation
Note the mixed results, some crops respond poorly or negatively to grossly higher co2 concentrations.
And the concentrations used in writing this paper are so high that virtually all climate scientists are convinced such high levels would be catastrophic in terms of disrupting the entire biosphere, INCLUDING AGRICULTURE.
This is the link to the excerpt.
http://www.ers.usda.gov/media/873725/impactofrising.pdf
Such questions are extremely involved and it takes a good bit of time to digest and appreciate the pro and con arguments, in respect to agriculture, unless you happen to be well versed in the field.
Agriculture IS my field, so it didn’t take me long at all to make up my mind, given that I accept the consensus judgement of the climate science community in respect to CO2 and climate.
A climate scientist I am not, but I know enough physics that the argument in favor of forced climate change, not to mention the fast accumulating evidence , is rock solid in my estimation.
When-IF- we see a decade or two of DECLINING average temperature, I might change my mind about that climate consensus, lol.
And then there is the cognitive effect. Rising CO2 levels impinge on critical thinking and decision making, add to that the fact that our brains have been shrinking for millennia and we are in trouble from just about every direction.
Luckily the intelligence of TV programming has fallen far faster than our cognitive losses, so we can feel smart everywhere we encounter those ubiquitous screens.
Hello OFM,
The reason I posted the article is because it represents how I think science should be viewed, that is both(all) sides should be welcomed and any conclusions should be put in the proper context. One thing that drives someone like me absolutely nuts is the fact that the increase in CO2 is never put in the proper context. It is always framed in fossils fuel bad, humans activity bad and we must do everything possible to keep mother earth in a steady state as seen on December 19, 1967 at 5:36pm (Scar). The fact as pointed out in the article is the climate is aways changing, will always be changing because of factors we know of and those we do not and species have always adapted or perished. That is not going to change either. If folks want to spend their time on earth trying to change that, it is of course their business, but the debate has been lost, not only on the science but on the practicalities. Absence of a great loss of human life and compete fascist control of every aspect of human endeavor there is no real chance that anything is going to change with respect to our dependency on fossil fuels over the short and near term time spans. We do not know what the perfect temperature is for life on earth in terms of the human species to feed itself and maintain it self and even if we did we would have no chance to maintain it like the thermostat in your tractor! What we do know is that we have adapted to the changes in CO2 levels and temperature and we have prospered as a species for being able to do so, I think it is a fair question, do we spend our energy, time and resources in adapting or controlling the uncontrolable??
TT said,
Very Trump-like impulsiveness, but why should we be surprised? About half the population holds these kinds of half-baked views.
Hmmm, half baked idea is that what they teach at MIT these days?
http://www.climatedepot.com/2015/11/19/scientists-declare-un-climate-summit-goals-irrational-based-on-nonsense-leading-us-down-a-false-path/
the world moved on and left the dinosaurs behind, so it was then so it will be now??
Half baked ideas is that what they teach at MIT these days?
http://www.climatedepot.com/2015/11/19/scientists-declare-un-climate-summit-goals-irrational-based-on-nonsense-leading-us-down-a-false-path/
So your logic is that because human activity might not change (it will) then the science is bogus.
I notice another major problem with deniers talking about global warming is not comparing the magnitude and rates of things. One of their favorite gimmicks is to compare two things that are vastly different in size of rate and essentially say they are the same. Or even more outrageously, that the small one is bigger than the big one.
The rate of change of natural climate compared to the rate of change from anthropogenic climate change is about the mass of a mouse compared to the mass of a human.
That is what science does, it tries to measure things and when one thing (global warming or CO2 levels) suddenly stick out like a sore thumb, then scientists investigate the reasons behind them. Conclusion is that the majority of climate change is due to the activities of humans and it is not just CO2.
We have four choices: continue on ( the make no change scenario), make small convenient changes in our ways and pollution production(the pretend we are doing something scenario), make large changes in our ways and pollution production ( the we will change the future scenario), and geo-engineering (the lazy sweep it under rug scenario that bites us in the butt sooner or later scenario).
The make no change scenario has a result of 3 to 6C range temperature rise and loss of at least half the species on the planet.
The make large changes scenario has some effect on the near future and larger effects on the far future, maybe holding the temp change to less than 3C (depends on natural feedbacks).
If as a child your actions will cause you to hurt yourself or others, then most parents would intervene and change the child’s course of action. Hopefully the child will absorb the lesson and change it’s ways.
If people in general are taking actions that will cause harm to most of the species on the planet including itself, who intervenes?
That is what government is for, the scientists just inform the government of their findings and their conclusions. If the government takes no or little action, then the actions continue and general harm occurs.
Hi Texas Tea,
We have a fair idea that CO2 affects temperature and know that for most of the last 800,000 years atmospheric CO2 has been between 180 ppm and 300 ppm (up to 150 years ago). Yes flora and fauna can adapt or become extinct, the concern is that we may change our environment to the point that humans and most of the mega fauna on the planet become extinct, hopefully fossil fuels become so difficult to produce that humans find alternatives. We need the energy, we know there is a potential problem to emitting excess carbon dioxide, why not solve two problems at once and transition to alternatives to fossil fuel?
Good morning Dennis,
a reasonable statement and legitimate question. I agree that humans will need energy and we will endeavor to develop new sources as long as we the capacity to do so. I also believe to have variable energy sources is better then having a singular energy source, the same would apply to food. Those facts stand by themselves and I think all reasonable people would agree. We don’t need alarmist predictions that fail time and time again to advance a reasonable argument, more energy sources provided at competitive cost will help ensure our nation and its people to remain prosperous and competitive in the global market place.??
Hi Texas tea,
I think fossil fuels are likely to become very expensive as the peak is reached. Failure to move on to new energy sources will make us less competitive rather than more.
For now the focus should be on reducing coal use as it pollutes the most, oil will quickly deplete and natural gas has the lowest emissions.
Energy scarcity will be a problem and fossil fuel prices will rise if that is the case. Will expensive fossil fuels make us more competitive?
“Will expensive fossil fuels make us more competitive?”
With the high energy intensity of current US GDP very likely not. All your high tech competitors are producing much more with the same energy.
Agreed, part of the problem is that low energy prices do not create the incentive to become more efficient. That will change and the US will try to catch up with the Europeans and Asians.
The reason I posted the article is because it represents how I think science should be viewed, that is both(all) sides should be welcomed and any conclusions should be put in the proper context.
While that may represent how you think and you are certainly entitled to your opinion it in no way follows that everyone’s views are equal and valid in science.
https://goo.gl/WSKtcf
Dara O’Briain: Science doesn’t know everything
Enjoy!
Hello TT,
I agree with you that it is important that ALL the evidence and ALL the points of view of various groups of people be considered, which is why I post comments contrary to the usual leftish liberalish flavor of forums such as this one.
Everybody is entitled to their own opinions, but not to their own facts. Facts are objective.
But so far nobody has come up with a good way to keep partisans from representing their own opinions or agendas as facts.
By way of example, I seldom EVER run across a knowledgeable self identified liberal , well informed on environmental issues, who is willing to admit what to me is an incontrovertible FACT- That if we want to preserve the environment of the USA, we ought to be very sharply curtailing immigration right across the board.
Such a person would rather go in his or her underwear than publicly advocate for a policy contrary to the larger D party liberalish leftish agenda. A hard core conservative, even though he might be well versed in the hard and life sciences, as a rule would rather go in HIS underwear than to cross the US versus THEM divide as a tratior to his “us” or “in” group and admit it public that them there commie whale loving tree hugging libtards ( SARCASM !!! ) are right about global warming, resource depletion, etc,.
MY personal agenda is to be known as a person who gets his FACTS straight, so as to have credibility in arguing for things I want to see happen. So I try like hell to acknowledge truth as I see it wherever I find it, thereby gaining credibility with people who are willing and able to think for themselves.
The idea is that I can force the hard core liberal to admit at least to himself that open borders are not good for us. I can force the hard core conservative to face up to such facts as the ones involving global warming, at least to some extent in his own mind.
WHY? Because by sharing some of his beliefs, I am in a position to communicate with a man of EITHER the right or the left, politically and culturally.
(Besides which, if I ever finish my book, and it sells, I may get on some of the talking head shows and find out if there really are hot young blossom groupies who have a thing for old fat guys with money, lol. )
Now when it comes to interpretation of data in the grand sense of the big picture, nobody can know everything. I know far more biology than just about anybody EXCEPT biologists, but I defer to my physician because he knows infinitely more about human biology than I do.
I know more law than most people, but I defer to my attorney on matters involving the law.
I seek out the advice of various other professionals as needed. Just about everybody, except poor people and nincompoops, minds his own personal affairs in a similar fashion.
So – Who are we to believe when there is a controversy about the actual facts?
We have two basic choices, we can either take the word of third parties, or we can trouble ourselves to learn enough about the issue in question to have an INFORMED opinion.
In the case of the third party choice, we again have two choices. We can go with professional scientists and people who have little or no personal skin in the game, or we can go with the people who DO HAVE an enormous amount of personal skin in the game, in the form of money itself, and in the form of political alliances.
I am afraid that I have no choice in this conversation except to point out that just about every thing you have to say at six forty two am is an opinion, and an erroneous opinion on top of that.
Speaking as a person knowledgeable about biology, and agriculture, I can say that there is NO SUCH thing as an OPTIMAL natural environment for humans. We ARE adaptable and can thrive in many different environments, from the far north to equatorial jungles and high mountain deserts. But we ARE adapted and adjusted to PREVAILING conditions, and if prevailing conditions change too fast, then catastrophe results. If the monsoons fail in India more than two or three consecutive years, hundreds of millions of Indians will starve or die fighting for the last few scraps of food and swallows of water.
The one thing you are right about is that we are compelled to continue using fossil fuels at least in the short term, and in the medium term too, to a substantial extent, depending on how we define “medium term”.
If you go onto the grounds of just about any university in this country, and exclude scholars who are members of the “Young Republicans” and similar organizations, and question every single person you come across who is studying the physical and life sciences, you will find that ninety nine percent of them agree with the climate science consensus, the biologists’ consensus that we are fast destroying the biosphere, that we will soon be in desperate straits in terms of affordable and readily available fossil fuel supplies, etc etc.
These young scholars are specifically taught to run experiments and observe results and think in terms of facts rather than opinions, in their professional work.
They know enough to be entitled to THEIR OWN OPINION.
Your remarks indicate a shallow knowledge of SOME facts, which are very easily misrepresented by people who are taking advantage of you as a foot soldier in order to further their own agenda.
Or maybe it’s part of your own agenda to protect the status quo fossil fuel way of life? With a handle like Texas Tea, I am entitled to wonder.
MY own handle reflects my own background, but I readily and frequently acknowledge that industrial agriculture as it is practiced today is not sustainable and not good for either people or the environment, to put it MILDLY.
I only defend in as being NECESSARY until we can figure out WORKABLE ways to do things differently.
Without fossil fuels and industrial agriculture, we would die very hard deaths, and pretty damned quick.
But fossil fuels are going to leave us if we don’t leave them, and industrial agriculture as we know it today cannot be sustained long term.
Pessimists don’t realize it, but we ARE making substantial progress in both cases. Renewable energy is out of the toddler’s phase of growth now, and every year we learn how to grow more food using relatively less in the way of industrial inputs on the farm.
Who does advocate open borders? I am unaware of this position as being part of the liberal agenda. From my perspective (a self identified liberal) the question is, what do we do about the millions of undocumented people currently residing in the country. From both a humanitarian and practical viewpoint I find the notion of rounding them all up and deporting them unacceptable. This position is not however the same as throwing open the borders and welcoming all comers. I would say that the liberal position is to do what is possible to secure the borders, but recognize that much of the undocumented population in this country has been here for many years if not generations. For many, their ancestry in the southwest predates the current political structures there. And their migration was and is a consequence of policies pursued and condoned by politicians and business interests on both sides of the border. I would prefer that we have a “path to citizenship” for those who have been here and contributed to our society for years and that our effort to curtail future illegal immigration focus on those who would exploit working people by employing them coupled with enhanced border security. I would note that this is pretty much in line with current administration policy.
I would say the defacto liberal or D party position in respect to the Mexican border has been to do as little as possible to control it, for two basic reasons. Listen to what liberal D type mouthpieces have to say about R types who want to manage it better if you have any doubts at all.
One, getting in under good control is an R party position, and the parties generally do whatever they can to sabotage each other on such issues.
Two, the D party while preening itself on holding the high moral ground is helping assure itself that the demographic balance needle in southern and western swing states moves in favor of the D party.
Being a realist, I am not personally in favor of deporting people who are already here, especially people with kids who have proven themselves to be good citizens.
But there are quite a few people here illegally who are creating some extremely serious problems and it would suit me to a T to deport them PERMANENTLY. I don’t personally know a single person, even the reddest of rednecks, who is in favor of deporting everybody in the country illegally, but there are some who are willing to talk that way. Political grandstanding is cheap and mostly free.
To be clear, I am in favor of numerous liberal policies such as drug decriminalization, single payer health care, social safety nets other than health care, most of them anyway, free public education, tough environmental laws, the usual liberal interpretation of civil rights and civil rights laws, etc.
I am a big supporter of any and all policies designed to speed up the transition to renewable energy.
But this doesn’t mean I am dumb enough to swallow the entire D agenda, or cynical enough to support it for partisan purposes.
I know a great many teachers, having once been one, and at one time I was involved in union politics.
Right now a D party liberal position that is in my eyes an OBVIOUS DISASTER is the collusion between the D party and the teachers which enables the teachers to maintain their monopoly in the education of our kids, with the result that millions of kids are getting at best a pathetic education.
More teachers put their kids in private schools or tutor them long and hard at home than you would EVER believe. ALL the young teachers both black and white that I knew as a young guy in the city of Richmond when I lived there moved outside the city limits to Henrico, Chesterfield , Goochland, etc, when their OWN kids reached school age, to take advantage of the better schools.
I was living in the city, for the ambience, and commuting to the country to teach. LOL. All the teachers who moved out commuted from the country to the city after moving.
It’s not that black kids in mostly black schools cannot do well. It’s mostly fxxxxxg political mismanagement that dooms kids in inner city schools. The teachers are themselves part and parcel of that GROSS mismanagement.
The Post Office is a better agency BECAUSE we have FEDEX and UPS and electronic banking, etc.
The schools could use a little competition too. So far as I know, there has NEVER been a large government bureaucracy that has reformed itself except as a matter of SURVIVAL. The schools of this country will never be much if any better until FORCED to get better.
Hi Old Farmer Mac,
Your position on immigration is the same as 90% of the Democratic party (maybe 99%).
The very left wing of the party (Marxists) may hold what you label as the standard Democratic position, but that is a little like saying all Republicans are fascists, not particularly accurate.
Hi Dennis,
While I agree that most D voters do indeed have a reasonably realistic understanding of the immigration question, etc, that last one percent to ten percent controls the party position, just as in some cases one to ten percent of the R voters effectively determine the R party position on some issues.
The actual D PARTY position is pretty obvious if you listen to what party spokespersons have to say.
A realist would of course expect it to be this way.Politics is a game somewhat like checkers, you sacrifice some men or voters to win over MORE voters, and just another million or two immigrants may well be enough to win over some swing state elections.
Taken all around, I find D party positions to be far superior to R party positions.
Of COURSE the R party is motivated in GREAT part by keeping immigrants out because the R party expects them to be D party voters in coming years.
How do you feel about a little competition for the teacher/ D party/ government education monopoly for our kids?
The REAL position of a party is not necessarily congruent with the party’s public persona. The R party outwardly represents itself as a good steward of the environment, the D party represents itself as wanting to get the big money out of politics, etc.
Both parties pretend to be FOR THE PEOPLE, whereas both parties are in the vest pockets of Wall Streeter types like one of Paris Hilton’s decorative little doggies peeking out from her purse.
Of course actually GETTING one percenter money out of politics would confer a HUGE advantage on the D party, since the D’s would be MUCH better positioned in terms of foot soldiers to win elections than the R’s after that.
Hi Old Farmer Mac,
I believe you claimed the Democratic position is the US should have open borders.
That is false.
Do democrats think that, building a giant wall between Mexico an the US is a good idea?
No they think it would be a waste of money.
That does not mean Democrats do not want to control our borders.
Do democrats think it violates the civil rights of Hispanics for them to be profiled and harassed by police?
Absolutely.
Again, nothing to do with border control.
Is there a large percentage of illegal immigrants that are dangerous criminals as you imply? I am very doubtful that this is the case.
The Democratic Party’s position is that dangerous criminals should be prosecuted if they are citizens and deported if they are not.
This should not be conflated with the position that rounding up all illegal immigrants and deporting them is either feasible or a good idea.
Hi Old Farmer Mac,
As you understand microeconomics fairly well, you may have been introduced to the idea of a public good. The basic idea is that investment in this good confers benefits upon society as a whole, but because the individual benefit that accrues to those that invest in that good is far less than the overall social benefit of that investment there will tend to be underinvestment in that good.
What is the good that I speak of? There are many of these, suach as roads, water systems, military, fire and police protection and education.
Do you think it would be a good idea to end the government monopoly on all of these things?
What specifically is it about education that makes you think reducing public support for it will not result in underinvestment in education?
School choice is code for, lets not worry about the education of the poorer segments of society. When the majority of citizens attend public schools there is widespread support for education. Vouchers will be chronically underfunded, and the best students will be cherry picked by the more expensive schools, which the vouchers will not cover and only the relatively wealthy will be able to afford. There may be scholarships for a few poor kids (probably 1% or less of the student body of elite schools). Getting access to those scholarships will be about as common as winning the lottery.
OFM, i am in the oil and gas business, but they are hardly counting on me to protect it.?? texas tea comes from the old beverly hillbilly theme song, Black gold…Texas tea, I though it was funny?
Every national or tribal leader and every general , in the last analysis, depends on his foot soldiers to get the job done when it comes to offense and defense.
Cargill, Monsanto, etc, don’t depend on ME personally to defend their business empires, but they depend on people LIKE ME collectively, to defend them.
Except I don’t. I used to use their products,and I had no hope of selling anything unless I sold it into markets they dominate.
I don’t defend them now, except as TEMPORARILY necessary evils.
The only real argument I have with Caelan Mc Intyre and his kind of thinker is that just condemning the existing system is a waste of energy in this forum. We are all pretty much in agreement, with a few exceptions, about what is wrong, and have been for some time.
The debate now is about how long we have left to do something useful, and WHAT we can do.
Hi Glen McMillian,
FWIW, my family kept the a in MacIntyre by the way.
Down the road, I might decide to change it to its gaelic spelling, but in the mean time, there it is.
For quite some time, including on The Oil Drum as Tribe Of Pangaea- First Member, for what to do, (interspersed among my critiques of our dystopia), I have advocated for, or mentioned, such things as permaculture, self-re-empowerment, crafts like knitting, wild edibles/medicinals, true democracy/equality, simplification and relocalization, and so forth, often with support in the way of links and images and seem to recall often arguing with you about ‘the system’, including the unfolding disaster that is industrial agriculture, Oldfarmermc.
So maybe you are coming around but want to sort of sidle it in sideways in part via your particular brand of propaganda and stereotyping– ‘his kind of thinker’, as you write– and think that the readership deserves or believes it and/or can’t read.
Maybe too, you have, to quote Mike, a burr in your saddle with the name Caelan. ‘u^
That writ, how about telling us what to do from your POV. Bonus points if it resists your usual espousing or defense of the Titanic that is BAU, such as EV’s or industrial agro.
Most of us would seem to understand that we need BAU until we can ‘abandon ship’, but it’s high time to start looking at and talking about it and then actually doing so.
Permaculture’s a good start.
Hi Caelan,
Sorry about misspelling your name, habit you know.
Some of my relatives use the “a” spelling.
“We do not know what the perfect temperature is for life on earth in terms of the human species to feed itself and maintain it self and even if we did we would have no chance to maintain it like the thermostat in your tractor! What we do know is that we have adapted to the changes in CO2 levels and temperature and we have prospered as a species for being able to do so, I think it is a fair question, do we spend our energy, time and resources in adapting or controlling the uncontrolable”
So for thousands of years the planet has been in a relative state of equilibrium, farmers could sow and harvest according to the seasons and developed patterns based on things like monsoons or rainy seasons, patterns that were established over hundreds or thousands of years.
Human population grows and at some point humans discovered ingenious ways of using energy stored in the form of fossil fuels. An uncontrolled experiment is started (unwittingly) to see what happens if CO2 that has been sequestered underground for millions of years is released back into the atmosphere over a period of a couple hundred years.
Observed effects include huge increases in wealth and standards of living, especially amongst those who use fossil fuels in larger quantities. Another effect scientists are claiming to observe is an increase in the average global temperature, supported by observations of retreating glaciers, increasing quantities of record high temperatures and others.
Since we do not have a control for this experiment, another planet of similar size, with a similar mix of elements in it’s atmosphere, a similar orbit around a similar star and temperatures that support water existing as a solid, a liquid and a gas, I think it is a bit foolhardy to assume that human activities are not the cause of global warming. It will be interesting to see what happens if human civilization figures out a way to sequester some of the CO2 or at least figure out ways to stop dumping increasing quantities into the atmosphere.
How many times will we have to see stories like the following before skeptics admit that there might be something to this global warming thing.
Danielle the Atlantic’s Earliest 4th Storm on Record; 115°-120° Heat in SW U.S.
Blazing Arizona: Sunday’s heat was the real deal
A well-predicted heat wave crescendoed on Sunday with some of the highest temperatures ever recorded in the larger towns and cities of southern California, Arizona, and northern Mexico. The heat was produced by an extremely strong upper-level high building over the Southwest just one day before the summer solstice, when the amount of incoming solar energy peaks. Sunday was the hottest day observed in any year prior to the summer solstice, and the hottest day on record for so early in the season, in Yuma (120°F, ahead of June 24, 1957), Phoenix (118°F, ahead of June 24, 1929), and Tucson (115°F, ahead of June 25, 1994). Sunday also tied as Phoenix’s 5th hottest day on record, and Yuma’s 5th hottest. In Tucson, only two other days have been officially hotter than Sunday: June 26, 1990 (117°F) and June 29, 1994 (116°F). However, as we reported last week, the instrumentation that was used to measure official temperatures at Tucson International Airport during the early 1990s was later found to be problematic. As a result, weather record researcher Maximiliano Herrera believes that 115°F—measured at the Tuscon NWS office on June 19, 1960; June 26, 1990; and July 28, 1995, as well as on Sunday at the airport—is a more reliable all-time high for Tucson. Herrera also reported that Altar, Mexico had its hottest temperature in recorded history on Sunday–48.5°C (119.3°F), beating the previous record of 48.3°C set in 1985. The award for the hottest place on Earth on Sunday may go to Piedra, Arizona, southwest of Phoenix, where the high temperature hit a remarkable 127°F (52.8°C). Thanks go to weather records researcher Jérôme Reynaud for this info (he maintains a database of all locations on Earth that have exceeded 50°C so far in 2016.) If confirmed, this would rank as the second hottest temperature ever measured in Arizona, and the hottest temperature measured anywhere on Earth so far in 2016. Stanwix, Arizona, about 8 miles to the west of Piedra, hit 125°F on Sunday.
Agricultural productivity has ALREADY risen. The planet is greener, plants breathe better, and conserve water. We read a lot of baloney denying this simple and straightforward phenomenom.
Fernando if an expert in botany and plant physiology were to start giving opinions on building skyscrapers and suspension bridges I’d take that opinion with more than a few grains of salt. I feel the same about your non expert opinion with regards plant physiology and how ecosystems actually work. You lack both the knowledge and hands on expertise to offer anything meaning to such a discussion.
Anyone who thinks global warming is good for agriculture doesn’t know much about the sex life of corn.
http://cropwatch.unl.edu/how-extended-high-heat-disrupts-corn-pollination-0
Pollination of many species best takes place within narrow temperature bands. I suggest it’s worth watching the temp forecasts for the Corn Belt. Higher CO2 brings higher temps. Higher temps will compromise crop pollination.
Sure there has been some greening, quite a lot actually, and some increase in agricultural productivity due to higher levels of CO2.
Climate people provide agricultural researchers with basic data to work with , in the same sense that biologists provide physicians with data to work with.
Not many climate guys know very much about what actually happens on farms and ranches in terms of plants and animals being raised to fill the bellies of naked apes.
Sure the C4 crops grow somewhat better.
But the REAL advantage is to the C3 weeds.
More co2 increases total plant productivity, but in crops it reduces the percentage of useful proteins while increasing the percentage of molecules essentially worthless as human food.
It doesn’t matter much if a crop will grow better with more co2 under prevailing conditions if it fares MUCH worse at higher temperatures.
Just a few days of record busting heat and drought is enough to wipe out a crop sometimes-quite often, actually. It’s happened to me, personally , four or five years.
Fortunately I am not a commercial cherry grower, like a couple of dozen of my neighbors. They were totally wiped out this year by a late frost, they aren’t even picking what’s on the trees, there’s not enough to cover the labor. Such frost damage is not so much due to the frost ITSELF, but rather to a few weeks of WARMER THAN USUAL weather in the late winter. The trees come out of the dormant state too soon, bloom too soon, BOOM, the frost gets them.
I am reduced in the midst of the normal local harvest season to buying cherries shipped from far away rather than enjoying them picked properly tree ripened within the last few hours.
The climate scientists who tell us about greening tell us farmers to be ready for more such undesirable winter weather, rather than LESS of it.
The climate scientists who point out greening also point out that we must expect some agricultural breadbaskets to grow substantially hotter and drier, even as they are at higher risk of formerly rare flooding, etc.
I am not denying these facts, but rather asking if the overall benefits of higher co2 levels outweigh the costs. The answer is that in terms of the BIG picture, higher co2 levels are VERY bad for humanity in general, short to medium term. In the long term of course , we will adapt, as will MOST of the biosphere. The species that can’t adapt will perish.
The problem with thinking long term is that we must live thru the SHORT to MEDIUM term FIRST, otherwise the long term is merely an academic question.
I have not put any significant time into researching specifically where and how much greening is occurring, but my understanding at the moment is that most of it is due to earlier, later, and more vigorous growth in formerly cooler places.
It’s going to take a LOT more than co2 induced greening to make a bread basket out of Southern Africa or the Middle East.
The most likely result of forced climate change is that such places will get to be quite a bit DRIER rather than wetter.
Co2 is the primary driver of forced climate change.
Incidentally I am a great deal more of a fan of the GAIA Hypothesis than most environmentalists in particular and biologists in general.
CO2 is a superb insulator, and the planet is heating up, and will continue to heat up to a substantially greater extent than it would otherwise, due to natural variations in climate, due to our adding so much of it to the atmosphere.
OF course it’s going to take a while for the results to be obvious to laymen and even to professional engineers, etc, who would rather NOT see the obvious. Most of the extra incoming heat energy is for now being held in the upper few hundred meters of the world ocean. As the waters warm up, the overall climate is going to warm up too.
AND while some of the positive feed backs look to be desirable, short term, such as the greening of some deserts, MOST of the positive feed backs are having the effect of pushing the average temperatures UP, and as time passes, this effect will grow and grow.
Lots of places in the far north are already getting to be noticeably greener earlier and later every spring and fall, and staying browner rather than WHITER thru the winter. This is NOT GOOD in overall terms for people and plants and animals that are adjusted to CURRENT conditions.
“Comparing historic photos to today, brush and small plants are much more abundant on the landscape these days.”
Thats not too scientific Leo. In fact, if you look at most of the plant biomes in the world that are not either urbanized or farmed, they have generally been undergoing a rapid process of desertification (drying down of the soil moisture and decreasing plant biomass).
Increasing CO2 can increase plant growth in a lab, but in the real world other factors are usually much more limiting- factors like soil moisture, soil ph, nutrient levels, and a myriad of other factors that may not be familiar to the lay person and I won’t try to astound you with the gory details.
Post script- Yeh, what OFM said.
NASA measures planet vegetation cover using satellite sensors. The measurements have been made for many years, they show a broad greening, with the most radical changes in northern latitudes. The perception that overall tendency is towards desertification comes from climate propaganda. Right now it flows very thick and heavy, it’s like a downpour of bullshit.
And yet huge amounts of forest loss are occurring and have occurred in the past.
https://earthenginepartners.appspot.com/science-2013-global-forest
https://earthenginepartners.appspot.com/science-2013-global-forest
Most of that greening is better explained by warming, the RESULT of higher co2 levels, than by higher co2 levels per se.
Not really OFM,
A great part of the greening is taking place in semi-arid regions like the Sahel.
This is likely due to two effects:
– Increased air humidity due to increased global temperatures.
– Increased plant drought-resistance due to reduced water loss by plants due to increased CO2.
Once the greening starts, it feeds on itself as plants reduce soil water loss and increase air humidity.
Elevated CO2 as a driver of global dryland greening
Lu et al. 2016. Scientific Reports 6, 20716
“Based on 1705 field measurements from 21 distinct sites, a consistent and statistically significant increase in the availability of soil water (11%) was observed under elevated CO2 treatments in both drylands and non-drylands, with a statistically stronger response over drylands (17% vs. 9%).”
A warmer planet with more CO2 means a more productive planet. This is obvious. We know agriculture was not possible during glacial periods.
This is not intended as a specific reply to Javier’s comment but rather as a general comment on this never ending polarized and politicized debate. Facts do not matter if they contradict your world view and you happen to be a member of a certain tribe.
http://goo.gl/unAAQr
Disclaimer: I don’t think for a moment that this polarization is just between Republicans and Democrats. That is a very US centric point of view IMHO! It is much more likely a conservative vs liberal issue.
This is explained a lot better by Jonathan Haidt in his book:
‘The Righteous Mind, Why Good People are Divded by Politics and Religion.’
The Moral Psychology of Liberals and Conservatives.
https://goo.gl/bzhVVq
Then, Fred, with that determinism you will be at odds to explain why I changed my position on global warming 180°.
It am not politically motivated. I am an European liberal, between conservatives and socialists. As a biologist I am a convinced conservationist, formerly affiliated to WWF. As a scientist I am espoused to the data. I experienced global warming first hand during the 80’s and 90’s. I had therefore zero doubts about the reality of global warming and its growing danger to the planet.
A few years ago I decided to write and speak about global warming, so being a scientist I carefully examined the literature. I always examine both sides and weight the evidence in scientific matters. I was very surprised to see that the data does not support any type of alarmism, and that the tactics used by those promoting alarmism are the ones used by those that do not have enough evidence to convince others.
I am not too happy that my fellow skeptics are mostly very conservative, but I rather be right with the wrong people that wrong with the right people.
In one or two decades climate will demonstrate that there is nothing to fear, and most of those that defend alarmism will be forced to change their opinion (and beliefs) or be increasingly marginalized. There is a growing urgency from the alarmists to implement policies and prosecute skeptics that speaks of the desperation of being proven wrong by the climate. The disparity between the reality of a world where global warming seems to proceed at very slow speed and the ever growing catastrophism of alarmists claims is increasingly disconnected.
Then, Fred, with that determinism you will be at odds to explain why I changed my position on global warming 180°.
Not really. As I mentioned at the beginning of my comment it was not specifically directed at you personally.
You can either read Jonathan Haidt’s book or watch this 1 hour long video of his explanation to understand what I was getting at.
https://goo.gl/iKsQKP
To be very clear it isn’t about climate change per se, it is about why all these discussion are so polarized.
My six twenty three ten twenty one comment up thread was intended to be HERE.
Hi Javier, I do recognize that there is a CHANCE you might be right about warming. It could conceivably be that you and the other skeptics are right, but my personal belief is that the odds are at least a thousand to one you are wrong.
But it is nevertheless true that the scientific establishment has been wrong before, and no doubt it will be wrong again-ONCE in a long while.
Naturally this phenomenon can be extended to agricultural interests, in which case we can certainly conclude that perpetually increasing CO2 bodes very well indeed for global food production well into the future.
Guess you’ve never heard of the law of unintended consequences!
Here are but two examples:
http://phys.org/news/2015-06-carbon-dioxide-air-restrict-ability.html
Increased carbon dioxide levels in air restrict plants’ ability to absorb nutrients
The rapidly rising levels of carbon dioxide in the atmosphere affect plants’ absorption of nitrogen, which is the nutrient that restricts crop growth in most terrestrial ecosystems. Researchers at the University of Gothenburg have now revealed that the concentration of nitrogen in plants’ tissue is lower in air with high levels of carbon dioxide, regardless of whether or not the plants’ growth is stimulated. The study has been published in the journal Global Change Biology.
Long-term decline in grassland productivity driven by increasing dryness
http://www.nature.com/ncomms/2015/150514/ncomms8148/full/ncomms8148.html
The extent to which past ecosystem responses to climate variation can predict those in the future depends on whether climate variation and ecosystem functions are deterministically coupled. Although climate variation clearly influences vegetation dynamics at local to global scales1, 2, 3, 4, causal attribution to climate may be obscured by other forcing such as increased CO2 and N deposition. Increases in net primary production by land plants in response to rising CO2, for example, requires that the availability of water and other resources keep pace with increasing evaporative demand due to warming5, 6. Recent global change experiments5, 6, 7, 8, 9 simulate future conditions via step changes in key drivers but do not simulate historical sensitivities to background-realized rates of variation. For example, although such experiments can simulate the effects of short-term departures from regional norms in precipitation (drought), it is far more difficult to simulate effects due to longer-term (decadal) trends in background aridity. Increases in drought severity and overall dryness are projected for many land areas globally10, 11, 12, 13. How primary production is coupled to these different modes of climate variation over the last several decades of anthropogenic forcing remains empirically untested for most ecosystems.
One major benefit of switching to EVs will be the gradual death (finally!) of ethanol. Currently one third of our corn crop goes to this boondoggle, probably enough to feed a billion people.
A map of projected wind power in the USA up to 2050.
http://energy.gov/maps/map-projected-growth-wind-industry-now-until-2050
Scientists nearly double sea level rise projections because of Antarctica.
https://www.washingtonpost.com/news/energy-environment/wp/2016/03/30/antarctic-loss-could-double-expected-sea-level-rise-by-2100-scientists-say/
So far Antarctica appears to be gaining ice and thus detracting from sea level rise.
https://www.nasa.gov/feature/goddard/nasa-study-mass-gains-of-antarctic-ice-sheet-greater-than-losses
Oct. 30, 2015
NASA Study: Mass Gains of Antarctic Ice Sheet Greater than Losses
A new NASA study says that an increase in Antarctic snow accumulation that began 10,000 years ago is currently adding enough ice to the continent to outweigh the increased losses from its thinning glaciers.
The research challenges the conclusions of other studies, including the Intergovernmental Panel on Climate Change’s (IPCC) 2013 report, which says that Antarctica is overall losing land ice.
“The good news is that Antarctica is not currently contributing to sea level rise, but is taking 0.23 millimeters per year away,” Zwally said.
So a double of a negative number is a bigger negative number. For 35 years dire predictions of sea level rise have been a failure. Doesn’t matter, they keep trying.
Oh no, not the pretending snow is ice study again.
I am sure NASA climatologists know the difference.
Really? But so often in the past you have said they are horrendously wrong. How can it be both ways.
At your convenience, sir.
Yep– It is a denier favorite.
I would go with the GRACE measurements, as they are actually measuring mass-
Not snow height that stopped being measured in 2005.
Sure, denier of catastrophic sea level rise, something that is not happening and will probably not happen. What is a denier of fantasy? a realist?
Straw man troll alert
I’d like to point out that sea level rise and antarctic ice mass increases are not mutually exclusive. It is possible that both can occur simultaneously. Weak tea Javier. As usual from what I can see.
Hi Javier,
From Nasa
http://climate.nasa.gov/vital-signs/land-ice/
Hi Dennis,
This is a highly controversial issue, not a settled issue. Gravimetric analysis (from GRACE satellites) does show a reduction in ice mass in Antarctica, but altimetry analysis (from ERS and Envisat satellites) does not. Jay Zwally, who is quite alarmist regarding Arctic sea ice, defends that Antarctica is gaining ice and thus detracting from sea level (see link above if interested).
Rémy and Parouty in their review article:
Rémy, Frédérique, and Soazig Parouty. “Antarctic ice sheet and radar altimetry: A review.” Remote Sensing 1.4 (2009): 1212-1239.
http://remy.omp.free.fr/FTP/article/66-remy-parouty_2009.pdf
conclude the following:
“Twenty years of altimetry have shown that the Antarctic mass balance is near neutral, and consequently the ice has no impact on global sea level change” (page 1231, last paragraph)
Clearly scientists disagree on this issue. I fail to see why we should take an alarmist view on Antarctica ice loss and global sea level rise and start making dire predictions when we are not even sure if Antarctica is losing ice.
“Planet could be hit by giant asteroid scientists say”
Please give orbital parameters and mass.
Red Herring. Are Javier and Fernando the same person? Both Spanish from what I can gather. Both climate change deniers. Both have not much more than logical fallacy to offer.
What is equally important is peak exports/imports when there is a regional production peak
20/6/2016
Peak oil in Asia (part 1)
http://crudeoilpeak.info/peak-oil-in-asia-part-1
I strongly urge everybody to take a good look at Matt’s linked blog article.
One good look at it is enough to convince any student of the oil industry that the Chinese will never drive cars on a per capita basis the way we do in the West, unless they are electric cars charged up mostly by wind and solar power.
Speaking as an armchair historian, the stage is beautifully and elaborately set for energy wars all thru the Asia Pacific region, and the nine hundred pound gorilla that will be pushing everybody else around is none other than China.
The one bright spot in this mess is that the Chinese leadership is technologically sophisticated, and culturally adapted to thinking in the long term to the extent long term thinking is possible given their circumstances. It’s NO ACCIDENT that China is leading the world in the field of renewable industry.
The Chinese could drive itty bitty hybrids, and the electricity will more likely be generated with hydro and nuclear power. I have a paper design for a small three seater hybrid that gets about 40 km per liter.
Fernando is designing hybrid cars. There is hope.
Hey, Edwin Hubble started out as a lawyer, so there is always some hope 🙂
All they have to is follow in Taiwan’s footsteps and switch their scooters to electric. For the warmer parts of China this could happen very quickly in terms of switching from a gas auto to an EV.
http://www.bbc.com/news/business-34773466
Old Farmer said
“One good look at it is enough to convince any student of the oil industry that the Chinese will never drive cars on a per capita basis the way we do in the West, unless they are electric cars charged up mostly by wind and solar power. ”
Already happening:
http://chinaautoweb.com/2014/11/chinas-auto-fleet-expands-to-154-million-vehicles/
And the older article leading to that one:
http://chinaautoweb.com/2010/09/how-many-cars-are-there-in-china/
Excellent posting Matt. That Indonesian chart is particularly illustrative.
I consider oil export capacity of the world and individual countries to be much more important than the overall production numbers. Peak world export 2005.
Many Asian countries are extremely dependent on imported energy. Percent of total energy consumption imported (2013 data)-
Singapore 98%
Japan 94%
S. Korea 83%
Philippines 45%
[USA for comparison 14%]
http://data.worldbank.org/indicator/EG.IMP.CONS.ZS?order=wbapi_data_value_2013+wbapi_data_value&sort=desc
Us Gators in Florida imports 99%+ of our daily energy. According to EIA Energy Browser our coal in NWF is sourced from Columbia. Wonder how many more mountains for removal they got?
[…] Peak Oil Barrel […]
Give us this day our daily anti-oil anti-coal daily brainwashing.
The Chinese lead the world in electricity consumption. They built that big dam that can be seen from Mars and it is the mother of all dams for generating electricity.
The coal consumption in China dwarfs the rest of the world, makes them the culprits, they are creating energy poverty in other places by hogging all that coal. ?
No coal burning in China, no electricity.
Go to Google earth and zoom in Shanghai to see the build out. The Chinese don’t fool around when it comes to building in massive quantities, they put the Coneheads to shame.
You need a minimum of 295 parts per million to have adequate plant growth. In greenhouses in Spain where there are hectares in the hundreds filled with greenhouses, growth is juiced by adding CO2, sometimes up to 4000 ppm. An alcohol burner will do the job. They should be fined for adding more CO2.
Low CO2 concentrations, plants suffer. Gotta have enough in the atmosphere so the stomata can capture the CO2, at 140 ppm, times get tough for plants. Think of the plants, show some compassion, no forests, no oxygen. Low concentrations of CO2 is a limiting factor.
406 ppm is not that much. At 4000 ppm, the Redwoods in California will be 1000 feet tall. It will be the Carboniferous Period all over again. Quit pickin’ on CO2 all of the time, we need it more than you think. har
Of course, at 20,000 ppm, it will be bad for humans.
Eventually, solar will be blamed for a reduction in CO2 concentrations and the carbon traders will sue. There won’t be enough pollutants in the atmosphere to allow for their trading chicanery.
All because solar fixed the problem and that is the problem.
Me thinks oil and coal play a significant role in the energy mix, the facts don’t budge.
Methinks your facts are awry, your logic is askew, your angry essence in need of much libation.
The best laid schemes o’ Mice an’ Men,
Gang aft agley,
An’ lea’e us nought but grief an’ pain,
For promis’d joy!
R Burns
But now proud man
Dressed in a little brief authority
Most ignorant of what he’s most assured
His glassy essence like an angry ape
Plays such fantastic tricks before high heaven
As makes the angels weep
Bill Shakespeare
Ronald Walter is our resident court jester, and taking ANYTHING he says literally is a mistake.
I have never been able to come to a firm conclusion in respect to what he actually BELIEVES, but he is a great comic entertainer, very skillful at provoking thought, and a realist at his core. He is occasionally perhaps rightfully chastised for being a supporter of the fossil fuel status quo, but he is certainly wise enough to know that without BAU we are dead short term, and wise enough to know we are dead WITH BAU long term.
He is remarkably consistent in poking sharp sticks and fun at just about everything.
Point taken. Exaggeration and provocation are the methods of comics.
I do find it interesting that both Shakespeare and Burns had the psychology and situation of man down pat way back then, and it hasn’t really changed.
Chaucer was the true master, and much earlier.
We have changed little.
I have read Chaucer in the original , but can manage it only by doing so with a line by line translation on the same page in the alternate column.
I don’t think he was all that GOOD, but being the FIRST of his kind among OUR kind, he is rightly revered as a founding father of modern lit.
He wouldn’t even be noticed if he were alive and writing today.
OFM says:”Ronald Walter is our resident court jester, and taking ANYTHING he says literally is a mistake.”
GoneFishing says: “Exaggeration and provocation are the methods of comics.”
But, both comics and jesters can use their wit to make a point. And, I agree with the point that R Walter was making.
I ‘m with Twain, whoever “Shakespeare” WAS, he WAS NOT Shakespeare. There is absolutely NO WAY an ignoramus, even one in the theater business of the day, could have even had the VOCABULARY of Shakespeare- whoever he actually was.
Twain is about equal to Shakespeare in talent in my opinion, but his work does not cover so broad a swath of history and culture.
There was no internet, no tv, no daily paper to amount to anything, even in London, books were the province of the rich and church clerics, high ranking government officials in a few cases.
To know what he knew, you HAD to be upper class in the true sense of the word, or in intimate contact with the ruling class, as for instance a personal assistant to a high ranking noble, etc.
Extremely few people had an opportunity to become well enough educated to have written what he included in the way of history, law, court customs, etc , in his work.
Eventually, solar will be blamed for a reduction in CO2 concentrations and the carbon traders will sue. There won’t be enough pollutants in the atmosphere to allow for their trading chicanery.
No worries mon! There will always be cow farts to save d’day. Har!
For the average person (consumer) their money is/was a claim on oil.
That won’t be the case with naturalgasables (ng and “renewables”). Where does the money come from for the consumer? Apparently, fake loans (securitisation) until “something bad happens” which happens every day in high paying job losses. Substitution doesn’t work because intermittent generation doesn’t scale nor can it replace oils inherent multiplier effect (eg. durable products) and critical functions. In other words less and less money for the consumer and “the transition away from oil” is suicide because the oil industry itself goes bankrupt.
“No coal burning in China, no electricity.”
No export markets because the consumer is wiped out from oil depletion, and a lot less coal will be burned to generate electricity.
Time for a Venezuela update: last week we saw intense looting in several towns. Food and medicine shortages continue.
The defense minister threatened the president of the National Assembly with a military court trial. The Assembly president reminded him he’s not subject to military courts, showed a photograph of the defense minister kneeling in front of Fidel Castro, and called him a coward for allowing Cuban military personnel to be giving instructions and orders inside the Venezuelan military structure.
The OAS is holding two meetings to discuss Venezuela, one was called by the Venezuelan regime, to allow three socialist ex presidents to present their ideas about “talks” they say they want to mediate between the regime and the opposition. The other was called by OAS secretary Almagro, who already declared democracy had broken down in Venezuela.
My impression is that Obama will sell the Venezuelans to the emerging Castroite mini empire, just like he is selling the Cuban people. These USA foreign policy moves tend to misfire badly. I expect rising violence, a lot of dead, a flood of refugees, and an emerging brand of terrorism to attack Castro’s interests as the dictatorship emerges as a Caribbean version of North Korea or Iran. This of course implies attacks on oil infrastructure, which means Venezuela’s oil production will continue to drop.
Too funny Fernando- You and R. Walter sure make me laugh. Thanks for the brevity.
“My impression is that Obama will sell the Venezuelans to the emerging Castroite mini empire, just like he is selling the Cuban people.”
The earth loses it’s gaseous hydrogen to space, but apparently Venus has lost it’s oxygen and water to space making a really dry.
https://www.washingtonpost.com/news/morning-mix/wp/2016/06/21/amazing-scientists-crack-mystery-of-venuss-vanished-water/
The JODI World Oil Database came out yesterday. The data is incomplete but just carrying forward the few countries that had not reported in April, I managed to get a pretty good picture of what the situation looks like through April 2016. The data below is all JODI except I use OPEC’s “secondary sources” for OPEC data and Canada NEB for Canadian data. JODI also uses the MOMR for their OPEC data except they use the “direct communication” data instead of “secondary sources”.
I am posting JODI’s “World”, “Non-OPEC” and “Russia” in separate posts so they can be responded to separately if anyone cares to comment.
Here is Non-OPEC. That peak was in December 2014.
Interpret JODI’s Russian data however you wish. I have no comment except to say that it looks strange.
Notice I start the Russian chart in January 2012 instead of 2005 as I did for World and Non-OPEC. The last data point in all three charts is April 2016.
There are four Russian projects due for start up in late 2015 and through 2016 which might give about 500 kbpd increase (notably Novoportovskoye and Vladimir Filanovsky) and there may be projects from early 2015 that were still ramping up. I can’t find much on their current status, but probably overall ramp up would be a bit slower than that shown. Russia also has a load of rigs operating for in fill drilling etc. (over 300 by OPEC 2014 figures). The decline could be just one major plant offline for a turn around or unplanned outage. But what is interesting is if the Russian rapid increase masked a general decline in the rest of the world which is now going to become increasingly apparent. There are two smaller Russian projects for next year (less than 100 kbpd total) but then I don’t know of anything before 2020 due.
If the world decline continues like that on top of Canada and Nigeria outages for May, North Sea maintenance, USA Shale and China declines, Iran/Iraq stalling and Venezuela collapse things are going to get interesting quickly.
America’s ‘200 years of energy independence’ and Canada’s open-pit bitumining ‘haven’t been too kind’ for this neck of the woods…
…And so geo(power)politics is kind of shifting, hence, perhaps; Venezuela’s instability (oil and lithium resource proximities); US’ opening door to Cuba; NATO on the lacy Russian fringes; and Ukraine’s and the “Fuck-the-EU” EU weirdnesses; and of course, ISIS and Syria.
And as usual, there’s that biggest resource real estate on the block, Russia, with the US’ perpetual lap-dog, Canada tagging along.
Hi Ron,
Better Russian data is available at link below,
http://minenergo.gov.ru/en/activity/statistic
The Jodi data for Russia is not very good, the World chart would be better with the Russian data from the link above.
I used 7.33 b/metric tonne to convert the data that is reported in metric tonnes.
Output peaked at 10.91 Mb/d in Jan 2016 and in May 2016 output was 10.83 Mb/d. A drop of 800 kb/d of about 0.4% over 4 months. The annual rate of decrease from Jan 2016 to May 2016 (assuming an exponential decrease) is about 2.7% per year.
If that rate continues, output would be about 10.6 Mb/d in Jan 2017. I believe AlexS (who follows Russian oil output very closely) thinks output will stabilize around the current level.
Dennis – can you recommend a good remedial math class? Maybe I do not understand “M” and “k.”
I took 10.91 Mb/d and multiplied by 1,000,000 and got 10,910,000 b/d. I then took 10.83 Mb/d times 1,000,000 and got 10,830,000 b/d. The difference is 80,000 b/d. If “k” stands for 1,000, that would be 80 kb/d, not 800 kb/d.
I then took 80,000 and divided it by 10,910,000 and got .00733272227, or roughly a drop of .7% over 4 months, not .4% over 4 months.
Hi Clueless,
My mistake, thanks for the correction, I dropped a zero, sorry.
I shouldn’t do calculations in my head, if I want them to be correct. 🙂
I believe AlexS (who follows Russian oil output very closely) thinks output will stabilize around the current level.
Stabilize? For how long? What does the word “stabilize” really mean… in months or years that is? I don’t think any country in the world will stabilize their oil production. It will go up as they bring new fields on line and it will go down if there are no new fields to be brought on line.
Hi Ron,
By stabilize I mean the level of output will change very little over the next couple of years. This means that new fields or wells are developed at a similar rate to the decline of legacy wells. I believe this is what AlexS meant or that decline would be very slow as this is almost accomplished (new well output is slightly less than legacy decline.)
A series of alarmist (disturbing) articles:
1. http://peakoil.com/generalideas/the-end-of-the-population-problem-another-seneca-cliff-in-our-future
2. http://peakoil.com/geology/92343
3. http://crudeoilpeak.info/peak-oil-in-asia-part-1
4. http://peakoil.com/consumption/china-is-peak-coal-part-of-its-problem
5. http://peakoil.com/consumption/get-ready-for-80-oil
oh I kind of like that last one?
That sharp spike and fall in Russian oil is a puzzle for sure. Maybe it is the result of some inconsistency in the data gathering process. The final point is entirely consistent with the trend of the graph.
It’s hard to see how or why the Russians would raise production so sharply, deliberately, in at a time when prices are in the pits, and then cut back just as quickly.
If Russian production shows a decline over the next few months, this would be consistent with the world jodi and non opec jodi production starting to decline.
One thing I have learned even as a complete amateur is that oil companies, especially NATIONAL oil companies, are like governments, and VERY slow to respond to changing conditions by changing production, compared to other industries. Some national and independent oil companies are likely just now getting around to actually shutting in some marginal, high cost production, either abandoning the wells permanently or shutting them temporarily waiting for the price to go up.
It’s not likely there has been much in the way of collective action to cut production on an organized basis, between countries.
And depletion may be beginning to take a noticeable bite out of production, because at least some oil companies ,nationalized and independent, may have delayed completing work on some new production that should have come on line over the last year or so.
If an oil company manager is in a position to do so, and believes the price will be going up soon, he would be a fool not to delay production to the extent he can. Oil that costs forty to produce and sells for forty two earns almost nothing. If that same oil is sold six months from now for fifty, ……… well, anybody can see that the bottom line difference is spectacular.
pure speculation, but it may have had to do with the production freeze discussion in Feb. I think the Saudis did the same thing.
Its great to be an american?? News from the live free or die state “Buy a car, get an AR.” The promotion is being done in conjunction with a local firearms store that completes the required background checks. Car buyers who pass the background checks and subsequently receive the AR-15 will then just send Hagan the bill afterward. “We’re giving these weapons away for responsible people that can lawfully obtain them and we’re confident that they’re going to maintain them responsibly” Hagan said of the program.
The campaign has increased sales, and thus far it is reported that Hagan has given away four AR-15s and one 9mm handgun, which is offered if customers decline the rifle.
A genuine two-fer, doing ones part to increase CO2 in the atmosphere thereby helping ensure human survival and at the same time helping to defend one family and community from the human predators the governments permits to live amongst us.
http://www.zerohedge.com/news/2016-06-20/new-hampshire-car-dealership-unveils-buy-car-get-ar-promotion
Finally we will be safe from “fabulous” people in glittery outfits dancing in nightclubs.
Does anybody here have an more info/insight on the continuous decline in saudi inventories since last october of 5-6 million barrels per month?
daniel. I do not have any info, but I discussed this here awhile back.
Something like 68% of world oil production does not have accurate storage data. That is to say, if one added all countries’ oil production that do not release transparent oil storage data and divided same by world oil production, the percentage would be 68%. Hope that makes sense.
For some reason, US storage drives worldwide oil prices, despite US being a net importer, and despite having a small fraction of worldwide oil storage.
I have contended KSA can greatly affect oil prices by moving oil in and out of USA, particularly as they own a considerable amount of US oil storage facilities.
RE: Saudi Inventory Drawdown:
http://fuelfix.com/blog/2016/06/24/market-currents-saudi-oil-exports-rise-while-inventories-fall/
Does anybody have a link to a site that keeps track of both high and low record temperatures by location and date- a free site?
It need not be comprehensive but the more the better. Looking for something that has new records being set on a real time basis, not hard to navigate.
Thanks in advance.
I’ll only look at the raw temps myself, not them records which are often manipulated-er, “recalibrated”. You take the temps at noon, compare to temps at 3:00 p.m. Then add them all up and divide by the number of temps you took overall, and TA DA!!! Actual science instead of whatever schemes the scientists my taxes are wasted on are coming up with these days.
OFM,
As a start, this Wikipedia page has reasonably up to date data, but not real time:
https://en.m.wikipedia.org/wiki/List_of_weather_records
A quick glance suggests more high temp records than low measured in recent years.
http://www.ncdc.noaa.gov/cdo-web/datatools/records
Go to view selected records
Ludovico Einaudi performs an original piece “Elegy for the Arctic” against the backdrop of the Wahlenbergbreen glacier (in Svalbard, Norway) on June 17 2016.
https://www.youtube.com/watch?v=2DLnhdnSUVs
Thanks for posting it, Mr. Idaho.
…a bit too late to say : “…save the Arctic…” I’m afraid, but enjoyable music nonetheless….
It (sadly) reminded me of the Iditarod Trail Sled Dog Race this year…..
-A few years ago (2008), they moved the start from Wasilla, AK to Willow, AK 80 miles north of Anchorage due to lack of snow……………………………………………………………………………………..
………………but this year they had to get the snow from Fairbanks (way to the north…. and with diesel powered trains and truck you dear and lovely EV and wind people!), for there was none of it in Anchorage, AK……………..
For the “…climate change is a hoax…” crowd out there……………..:
this race takes place in March – NOT June……and this is Alaska, not Georgia, or N. Carolina….you dumb f***ing idiots, you!
-Hey, but climate change is just a hoax so that the New World Order taxes us some more, right?….
Yeah……!
Be well,
Petro
Make what you will of this.
http://cleantechnica.com/2016/06/21/tesla-offers-buy-solarcity/
IF Musk succeeds in merging the companies, there will probably be some competitive advantages gained thereby.
The best thing for Tesla and the renewables industries in general would be for the price of gas and oil to go back up , the sooner the better.
As of right now, I expect the regulatory environment to grow friendlier for renewables etc after the fall elections.
Trump has likely managed to win the R nomination, at the cost of infuriating the R party establishment,hoping of course that the party would join him if it couldn’t lick him. But my political ear to the ground is telling me there will be no real kissy kissy.
A shotgun wedding is the best Trump can hope for, and it’s hard to convince the voting public that the people at a shotgun wedding WANT to be there.
My political ear to the ground is telling me that Trump is shooting off his mouth and hitting his toes often enough that it will be the principled conservatives who stay home in the greater numbers, and that the odds are now much improved in Clinton’s favor.
At least eighty percent of the Sanders camp will vote for Clinton, with the remainder staying home or voting a third party. Not even one Sanders supporter among my personal acquaintances will vote for Trump, even though a few hate Clinton’s guts.
I doubt Trump is a capable enough politician to get back to the center between now and November, but it’s still too early to count him out.
But if he hadn’t run so very hard to the far right, he would not be the presumptive nominee, so he did the right thing as far as HE is concerned. I pray the audience recognizes sarcasm at this point.
The election will be won in the center as usual. I am not yet ready to predict the outcome, for the first time this late in the game since the Dark Ages.
Mac,
I hate to disappoint you, but Solarcity was created by Musk in 2006….it is his baby.
This is just a game….
At that time, it did not make regulatory and financial sense to be the CEO of both companies (Tesla and Solarcity), so he made the Rive bros. CEO and CFO…..he was ALWAYS the Chairman of the board, though….(meaning: “the boss”)
This has nothing to do with competitiveness, or the health of the Planet.
It makes more sense financially now than it did then.
Elon Musk is neither the smarty, nor the goody whom you (and many others) think he is!
Without massive subsidies, Tesla and just about ANY solar and wind enterprise in the world CANNOT/COULD NOT exist.
Think about it….
Be well,
Petro
Hi, to give a glimpse of whats going on in Mr Musks Corporate Puzzle.
Been having this discussion with AlexS before. I’m not an expert on Corporate Financing, but to me as an idiot it both looks and smelled fishy before this last trick. And if an idiot sense that, well then maybe an expert smell that as well.
http://www.wsj.com/articles/elon-musk-supports-his-business-empire-with-unusual-financial-moves-1461781962
(google headline if locked)
Why should I be disappointed? I know about as much or more than most people about the history of the companies Musk has started and still owns in part.
I own no stocks or bonds of any sort, personally. They make more machinery, etc, but it gets to be more expensive every year, and they just don’t make any more farmland at all, AT ALL, lol. My assets have been going up about as fast as the stock market, all things considered, over the years. They will never be worthless, but a LOT of stocks have gone to zero, and a lot more will in the future.
Now as far as it goes, I DO think you are a very heap big smart fella, no bullshit, but I also believe you are as capable of making mistakes as anybody else, even though smart people make FEWER mistakes than dumb people.
(One reason I post so many comments is that I WANT people who know better to contradict me , and help me make FEWER mistakes later on. )
You are for instance on of the relatively few people who understand that linear thinking is a VERY risky proposition , if you extend it out very many years, because things CHANGE in fundamental ways.
My guess is that there are tax advantages and possibly some additional subsidies to be collected by merging the companies, and that there will be some savings, or at least anticipated savings, in operating expenses.
Some years ago, it was true that large scale solar and wind projects simply couldn’t be built without subsidies.
I do not believe this is true anymore.
These industries were subsidized for the SPECIFIC purpose of enabling them to grow big enough to be self sustaining in the shortest possible time. They are just about big enough NOW in some cases.
The cost of wind and solar electricity is not yet cost competitive on a strict dollars and cents basis, except in a few places, but there are now places where wind and solar power make dollars and cents sense without subsidies.
The costs of both are falling fast, and the fact that depletion never sleeps virtually GUARANTEES that the price of fossil fuels will continue to go up, on average , over time.
?? Unless maybe renewable power gets to be cheap enough to hold the price of fossil fuels down to current levels, lol.???
I don’t expect that to happen, but I do think there is a very real possibility that the public in general will save more in terms of fossil fuel purchase costs, over the next couple of decades , than the public pays out in subsidies to the renewables industries.
The sale of coal for generating fuel for instance here in the USA is probably down around three or four percent from what it would be because of wind and solar power on the grid. This has unquestionably helped force down the price of coal.
If the electrified automobile industry takes off , and light trucks likewise built with plug in or pure electric drive trains, this will result in a very sharp reduction in the sale of oil, with a consequent sharp fall in the price of that oil. Ten billion spent on subsidizing electrified cars for the next few years may save us a hundred billion, collectively, on gasoline, over the next couple of decades, and billions more on food,etc. Farmers use the hell out of oil, so do truckers hauling food.
Furthermore even without considering the climate issue, there are other good and sufficient reasons to build out wind and solar power, such as providing local employment rather than spending the money on imported fossil fuels, improved public health, improved national security, etc.
Neither the Russians nor the Germans have forgotten WWII. Think about this for a while.
I tend to think of wind and solar power as being somewhat equivalent to warships and tanks. The more we have of wind and solar, the less need we have of warships and tanks. This does not yet matter much to us Yankees of course, but it eventually will, because we are net ff importers except for coal.
The price of a warship is TOTALLY subsidized by taxpayers, lol.
The consensus view among people who are very well informed in respect to fossil fuel supplies seems to be that we have maybe another two or three decades at best before we run into some damned serious problems.
( I personally put next to no stock in government projections past a couple of years, because people who depend on government for their paychecks know damned well that those paychecks depend in large part on not upsetting the BAU political apple cart. )
I don’t know much about what you think will happen twenty or thirty years down the road, but if you read my comments, you know what I think.
Being by training and inclination a systems thinker, I PREDICT extremely serious problems, life and death problems, on the grand scale, involving depleting fossil fuels, climate change associated with fossil fuels, etc. within the lifetimes of any young man or woman reading this blog today. I am not alone, just about every body who has a tenured position in the life sciences at reputable universities agrees with me. Or to put it more modestly, lol , I agree with THEM.
To put in in a nutshell, the way I put it is “DON’T get caught in Egypt. ”
Linear fossil fuel economic thinking is no good any more, long term. It might hold for another decade, or we might wind up in a cold war with China for instance, which could morph into a hot war, within ten years.
Take a good look at the graphs Matt just posted at his blog.
The shit will soon be in the fan in terms of oil supplies , even if the price goes back to a hundred bucks.
It is perfectly justiafiable to argue that the shit has BEEN in the fan since WWI in respect to oil. Churchill realized back then that England MUST have access to oil to maintain her empire. We Yankees have been involved in oil wars just about all my life, one way or another.
If there were no oil and/or other mineral wealth in the Middle East, the Middle East wouldn’t make the news once a month on page forty.
Our only real long term hope of continuing something more or less comparable to our present day western lifestyles is to keep the pedal to the metal on the renewables, efficiency and conservation fronts.
It takes fifteen to twenty years or so to raise a child. It’s going to take longer to manage a successful transition away from fossil fuels. Time flies. Anybody who has kids needs to be supporting renewables. NOW.
Tesla has always had as it’s main goal to dominate the battery business. EVs and Solar City are both incidental and complementary to that goal!
Posterboy Musk is selling wall-to-wall carpet and then the vacuum-cleaners for it. And he’s making you pay for some of ‘his’ imposed lifestyle vision/dupes (which conveniently mesh nicely with ‘your daddy’. Who’s your daddy? Your governpimp of course.)
Then you realize, down the road, that the carpet stinks, can’t be properly cleaned, has allergens like dust mite crap, etc., and has to be pulled at your expense; at the expense of a then relatively-useless, noisy, energy-sucking vacuum-cleaner; and at the expense of the environment that has to absorb all those chucked carpets.
But by then, by the time you realize you’ve been fooled yet again, Musk et al are long gone, such as to tar and feather…
Meanwhile, the assorted greenwashed scams continue… often in your name, and on your dime…
I have spent the night outside , on bare ground, and in loose hay, as well as in a sleeping bag with rock gouging me in my back.
I will take a carpeted bedroom with a BAU mattress so long as the choice is available to me, but sleeping in loose hay is not bad at all, except it is scratchy in your underwear.
https://www.washingtonpost.com/news/energy-environment/wp/2016/06/21/how-growing-global-trade-is-carrying-pests-all-over-the-world/
This sort of thing is even older news to old farmers than it is to middleaged biologists, lol.
It’s just one more GOOD reason we really don’t NEED ever increasing international trade. We are big enough, rich enough, and diverse enough to make it ok without depending on the rest of the world for stuff we could be making at home.
But, but, but… Think of the increase in GDP due to all the money being spent on fighting invasive species. /sarc
Aren’t humans the top invasive species? Sounds like we are just eliminating the competition again.
Hi GF,
I wish I had said that first, but I’m gonna crib it!!!!!!
RW is probably kicking himself for not saying it first, you are poaching on his court jester turf!
Political Economist sez:
” … the US production of oil and natural gas surged, leading to the collapse of world oil prices … “
This is a non-sequitur, ‘surging’ and ‘collapse’ are unrelated. The surge is in condensate. The price collapse has nothing to do with a surplus of condensate.
This particular article — and so many others about energy — focuses intently on the extraction side, the obsession includes wind and solar power. None of the articles mention how energy consumption (waste) makes customers rich. They don’t talk about it because waste doesn’t enrich any customer! Driving a car does not pay for the car, nor can it pay for the fuel or the infrastructure. Driving is an activity like golfing or watching TV, there are no economic returns except to the vendors.
This leaves the fuel supply industry dependent upon credit-at-remove: as long as loans are available to customers, they can borrow and drive in circles from gas station to gas station. The borrowed funds can then trickle up to the drillers and they can retire their own loans.
Without credit the bid for fuel collapses. Look around and you can see: there are credit problems around the world … inability to lend/borrow is starving the fuel customers of funds. A likely culprit is QE and other monetary strategies which shift credit from customers to firms.
The credit crisis is caused by an energy shortage … not a glut. Customers are being systematically excluded from the market: more shortages = more exclusion in a vicious cycle.
For oil extraction rates to remain @ the current level, the wellhead prices must increase. The only way for prices to increase is for customers to become richer … to access more credit.
If customers get more credit, they have it only until they spend it. At the same time, the drillers demand for credit is both acute and self-destructive; they must borrow or die yet they do so at the expense of their customers! The situation is a hot-mess and the emergency is immediate … not ten or fifteen years into the future.
The challenge for the present is learning how to live without a car.
I am a bit confused here. Are you saying that most of the product from LTO wells is condensate?
“The price collapse has nothing to do with a surplus of condensate.”
It does if “oil storage” is full of condensate but traders think it’s full of oil.
Love this Steve guy.
Presents his conclusion (car is the enemy) first and then does the analysis which naturally agrees with his conclusion.
Like what is the point of this exercise?
Steve has something to say worth listening to, but you actually have to prepare yourself to listen before you can hear and appreciate his message.
You simply CAN’T explain evolution to a fundamentalist Christian who has a near zero level of understanding of the natural world, his prejudices block his ability to understand the subject.
In preschool terms, Steve’s message is that driving cars around in circles doing mostly meaningless NON PRODUCTIVE stuff is unsustainable and unaffordable and that we are currently paying for this indulgence by putting it ” on plastic” meaning the credit card of the world meaning the next generation,which will NOT be burning gasoline as if it were necessary to get RID of it.
The oil won’t be there, the debt is not going to be paid, barring miracles.
The question boils down to just one word. WHEN.
He may be a little ahead of his time, but not by a century, lol, and maybe not even by a decade or two.
The entire financial/ banking/ fire/ insurance / real estate house of cards could tumble down ANY DAY if the cards fall wrong, with catastrophic consequences.
If that happens, fifty people getting shot out of hand wouldn’t rate two lines on page forty. If that happens, there won’t be very many newspapers around AT ALL, and what little real news is in them will be heavily censored.
The hottest career path for attractive young women will be prostitution, and young men will be applying themselves diligently to learning the ancient and honorable art of robbery.
Old guys like me, well, I will be in camo, standing guard over a few cows, with a deer rifle. I might last a pretty good while, before my own personal luck runs out.
But with reasonably good luck, the card house might last a while yet.
“Just a few years ago, we would have scoffed at the idea that electric vehicles could be mainstream anytime soon, or that the global appetite for lithium-ion batteries and mass power storage would be so voracious, and so sudden. Today, no one is scoffing, and lithium is being viewed as our new super-mineral that will catapult us firmly into the next century.”
http://oilprice.com/Energy/Energy-General/Move-Over-Oil-Lithium-Is-The-Future-Of-Transportation.html
From the article:
LOL
Best with the catapult.
Caelan,
This is EXACTLY why I’ve been investing in several junior lithium miners over the last several months.
There’s a few key pillars to this investment strategy:
1. Even if lithium prices tripled it would still only make up ~4% of the total cost of the battery.
2. Lithium brine takes years to evaporate creating an unusually inelastic supply.
3. Toyota, VW, Tesla, Panasonic, Hyundai, Mercedes, GM, Ford, and others are all, at the same time, trying to secure supply for their significant investments they’ve begun to electrify their vehicles.
4. There are very few lithium producers in the world, and 80% of lithium comes from the Lithium Triangle in Argentina/Chile/Bolivia, and from just 3 companies.
5. There are large unproduced lithium reserves around the world with the most promise coming from the Clayton Valley in Nevada and in Australia.
My conclusion is that these factors (explosive demand growth, severely inelastic supply, vast unproduced reserves owned by junior mining companies, and the ability for lithium prices to increase several hundred percent without impacting end unit costs of batteries) will combine to create a boom in junior lithium miners that has truly never been seen or experienced.
Many will fail, but those with the best property in these plays will go from penny stock valuations to that of established miners.
The safest plays right now are Nemaska, Orocobre, and Galaxy Resources, and Lithium Americas is ALMOST on that safe list.
Even those “safe” companies are only safe within the scope of the very high risk market they exist in.
Full disclosure: I currently own OROCF and LACDF, and have owned NMKEF and GXY within the last 90 days.
Brian: ” This is EXACTLY why I’ve been investing in several junior lithium miners over the last several months.”
Brian,
How is that working for oil companies’ shareholders and depleting oil? Don’t follow the minds logic and you are going to be in big trouble. When article says that supply is “fantastically tight‘ that does not mean that price will necessary go high but it means supply will be available to only privileged one’s, and more precisely the one’s that are closer to the Fed’s credit emission machine. Using Seinfeld language it means “No Soup” for the masses.
There will be PLENTY of soup for the owners of lithium mines if the electrified auto industry takes off.
We really love to bitch about how hard poor people have it, but I live in the deepest darkest heart of APPALACHIA, or at least pretty close to it, and I can say without a shadow of doubt that half of the people around here who live in HOVELS smoke a couple of thousand up in cigarettes every year, drink up as much more in beer, and spend another thousand at least on electronic entertainment and cell phones. The brats getting free school lunches have cell phones as often as not.
Trickle down works, given time, although saying so in any forum dominated by liberals gets you flamed.
Damned near all the poor people around here have cars, the only real exceptions being those who have been prohibited from driving and those too old and too young to drive.
The oil and auto industries have been putting poor people in cars for the last century. Why should the auto industry give up now? Assuming of course that the battery industry can keep up, as oil depletes.
The Koches and the FORD families of the world understand that SELLING stuff is a better way to get to be rich and powerful than HOARDING stuff.
IF cheap batteries capable of running cars CAN be built, they WILL be sold.
Mac,
The level of input of tobacco, alcohol, and trashy Hollywood electronic entertainment and other toxins for body and mind are not measurement of some UN affordability index. You don’t need unlimited supply of lithium to reduce the input of toxins but little bit of understanding.
Agreed.
My point is that even poor people DO have some disposable and discretionary income, and will likely be able to afford second hand older electrified automobiles a few years down the road.
It’s just not transportation, It’s Everything . In Autonomous PV system design a goal is to maximize kWh energy flows to be pure PV power when possible- ie. Not battery stored. Many systems where loads can be managed, minimal kWh is actually stored. If you can achieve this, actual kWh costs are < than Utility. Possible with Li Batteries since they are not like Pb cells .. which are in a state of Chaos Decay if cell voltage is not in a narrow range +/- 2.12 Volts. A good Primer on Li Battery characteristics: https://www.youtube.com/watch?v=8Mpt25M69gA&feature=youtu.be
Hi Longtimber, Do you know anything about Aqueous Ion Batteries”? I’m wondering what the pros and cons are for these creatures and would love to hear a appraisal of them from a non biased source.
I be a desk & field rat. While R&D brings us the future and flow batteries are likely the future for Utility Scale, Not going to get excited about anything propriety or that I can’t place an order for right now. We put up 2 Powerwalls
so far for the Utility or Tesla owners. Just TRY to buy one if you not a Tesla owner.
Only works with SolarEdge so far. Now only if the Superior LFP ( Li Fe Phosphate ) prisms would come down in price – me thinks China is using all they can make. BTW.. GE of “brings good things to life” fame like Fukushima buys chunk of Sonnen. They use safer LFP chemistry unlike Tesla/Panasonic cells. For me personally, IMO Powerwalls are fine in a Detached Garage or shed. But I would not store gas or a car inside attached garage either.
http://www.bloomberg.com/news/articles/2016-06-06/ge-ventures-buys-stake-in-german-sonnen-to-boost-solar-storage
Not going to get excited about anything propriety or that I can’t place an order for right now.
Aquion Energy seems to be way past the R&D stage and their products are even available from a local distributor in my neck of the woods! Just the other day, I saw an article about the commissioning of its first grid-scale, base-load shifting, energy storage project. .The project consists of a 1.25 MWh Aquion Aqueous hybrid ion (AHI) battery array From the “Technology”page I linked to:
Our technology is based on a simple idea: In order to meet the challenges of the world’s growing energy needs and increase the use of renewable power, we need large-scale energy storage systems that are high performance, safe, sustainable and cost-effective. Our founder, Professor Jay Whitacre, set out to solve this problem and discovered a simple and elegant solution that is a twist on a 200 year-old technology: saltwater batteries.
Aquion developed this solution into our patented Aqueous Hybrid Ion (AHI™) chemistry. Aquion’s Aspen batteries are sealed electrochemical energy storage systems based on our unique saltwater electrolyte. Unlike flow batteries, lithium ion batteries, and lead acid batteries, our Aspen batteries are made using abundant, nontoxic materials and modern low cost manufacturing techniques. Our saltwater batteries are maintenance-free and optimized for daily deep cycling.
So that’s the marketing pitch. I was hoping that, as a “desk and field rat”, you might have encountered them out in the field. I want to hear from someone who bought them rather than someone who’s trying to sell them. You know they never exaggerate for the sales pitch! 😉
Forgot about these. Most Focus is on traction batteries. Over 100 in Stock, so worth a L@@K for Stationary apps. wide voltage range not such a problem that it used to be. Looks similar to NiFe. $460 kWh- $.15 USD / kWh Cycle cost. Appears no Heavy Metals 8 year warranty on a Battery! Balls. Many LA Battery warranties have dropped to a year due to lack of Quality Lead stock. Pb can not be recycled back into a new Tier 1 Batteries. I’ll have to check other suppliers and reviews.
https://www.altestore.com/store/deep-cycle-batteries/batteries-saltwater-technology/aquion-energy-s30-pre-wired-26kwh-battery-stack-48v-p11941/
Found this:
http://cleantechnica.com/2015/05/09/tesla-powerwall-powerblocks-per-kwh-lifetime-prices-vs-aquion-energy-eos-energy-imergy/
Please, bring on The Great ‘Petro’ already. Surely that magician will be more entertaining than Political Economist.
I can’t wait for that Petro guy to inform us slobs on the INTERCONNECTED (as in ponzi) mafia finance “system” which he claims to have proprietary knowledge although it can be found in any book such as ‘Derivatives: The Wild Beast of Finance’
Petro surely will try to convince us that The Global Economy has nothing at all in common with the Albanian Pyramid Schemes and that the Grand Masters of Finance are saving the great unwashed masses with their dedication to progress (more taxes)!
Will Petro do it? That is the question.
On June 19, 1915 the low temperature for that date was 27 degrees Fahrenheit in my neck of the desert.
On June 21st in 1917, the record low of 28 degrees was recorded in the same deserted place. That would be cold, not warm at all for a summer day in June. There has to be global warming, that is too cold for that time of year. You’ll lose your garden, crops will freeze. Must have been la nina years.
On this date in 1917, a record low of 35 ° F was recorded. Good thing it has been warming the past 100 years, we’d be burning even more coal!
Good thing coal has been burned for the last three hundred years or so, been warming the earth enough to prevent crop damage caused by cold weather in June. Provides electricity plus warms the planet. You get a two-fer!
We need a war on cold weather, not coal. Coal keeps you from freezing on a cold winter day. Just call it old sunshine and coal is exonerated, its place firmly ensconced, you can take that to the bank, even if it is just the river bank.
Coal, good old sunshine captured by the earth, has been a blessing in disguise and all people can do is curse the stuff Mother Nature was kind enough to provide. The ungrateful fools don’t know what’s good for them. ?
Don’t blame humans for taking advantage of Mother Nature’s bounty, blame Mother Nature, she formed that good old sunshine into coal, nobody else, sure wasn’t me, I can tell you that. She is so gracious offering all she has and all we ever do is make her pay through the nose and curse her when what we need isn’t enough. It is a travesty of a mockery of a sham. Be kind to your web-footed friends.
Coal has always been a diamond in the rough and it is better if it stays that way, harumph.
Set up LED lights during the night above solar photovoltaic panels, you can generate electricity 24/7.
LED bulbs are said to be 213 percent efficient*, it is a win win again and again.
Today is the official Shoot The Messenger Day!
*A claim I heard on a radio program, don’t ask me.
R. Walter- This is great stuff, I had a little bit of coffee coming up out of the nose even. This could be in a series titled “little known secrets on the applications of thermodynamics”-
“Set up LED lights during the night above solar photovoltaic panels, you can generate electricity 24/7.
LED bulbs are said to be 213 percent efficient*, it is a win win again and again.”
I can a future where we wear backpacks that are miniature greenhouses, and our exhaust respiratory CO2 is hose vented into it for carbon capture. In it we grow herbal mixes- hemp, basil, and chia seeds. Are you registering this Caelan?
RW, if you recycle your methane exudations into a personal burner you will get all the heat you want. Downside is you will show up on infrared satellites.
Gonna crib this one too, GF.;-)
I’ll be your ghost writer.
GF,
If it ever sees actual physical print, you get a free autographed copy, postage paid, no handling charge! So will at least a couple of dozen others here, all they need do is provide me with an address to send it to.
Caelan,
This includes YOU TOO, assuming you don’t manage to get the paper mills and the presses and the post office and FEDEX etc shut down before I finish, lol.
EVERY body gets a free copy if it gets posted as blog entries, which seems likely.
Getting a book published commercially these days is tough, too many authors, too few buyers of serious books.
In the meantime, many thanks to everybody who points out errors and blind spots in my thinking.
ANY REGULAR here who passes thru my neck of the woods is invited to have dinner and drinks on me, if time permits. If time is no problem, visitors are mostly welcome, depending on how my old Daddy is doing.
The Weekly Petroleum Status Report just came out. US C+C production fell by 39,000 barrels per day to 8,677,000 barrels per day.
That is quite a drop for one week. I know there are those who say these weekly reports are not accurate and don’t really mean much. I used to say pretty much the same thing myself. But when it happens over and over, week after week, then there is just no denying that US crude oil production is declining alarmingly fast.
And yet, oil drops…
That’s why I’ve commented on last post that vast majority of people posting here are (kindly) not smart. It’s sooo obvious that it will be low price, not high price, that will mark peak oil (peak energy). Imagine oil at 500 usd/barrel, and we won’t have PO in 50 years.
Ron,
It is interesting to see also ‘other supply’ decline by 39 kb/d, fuel ethanol alone 51kb/d.
Net imports surged by almost 40% year over year – albeit from a low base last year. However, the four week average increased 18% from last year. Net imports are most important as these will weaken the dollar and increase the oil price again. So, the forces for a higher oil price are already in place.
Hi Ron,
The weekly data can be different from the monthly data over long periods. Often the monthly data gets revised, probably when the EIA realizes it has underestimated Texas output and then revises the monthly data higher.
Chart below shows the weekly 4 week average and monthly EIA data for US C+C in kb/d from Jan 2011 to the present. This chart is the reason I think the weekly data is best ignored.
Dennis,
The weekly production data correlate very well with the FED oil production index for May, which is down -8% year over year. There is no question that US oil production is in a steep downfall – falling roughly -2% per month – and this will the case for at least the next six months.
And this is the only way the oil price can ever go up again over USD 50per barrel as lower US production will weaken the US dollar and increase worldwide demand.
Hi Heinrich,
That is probably because that Fed index is based on weekly data, it is equally useless if that is the case. We just don’t have very good data for Texas, the drilling info data is probably closest, but Dean’s estimates are better than the drilling info estimate.
Hi Dennis, I found the following from Richard Heinberg’s post today. You may be interested:
A paper from Siemens Corporate Technology in Germany weighs the relative contributions of grid extensions and electricity storage to a hypothetical 100 percent renewable European grid, and finds that, with storage, renewables could supply up to 60 percent of power without additional grid capacity or backup, and 80 percent with an “ideal” grid.[26] These conclusions are similar to those of a National Renewable Energy Laboratory (NREL) study, which relies heavily on dispatchable biomass power generation to achieve the renewable target (about 15 percent biomass generation in 2050). They note regarding the grid that “electricity supply and demand can be balanced in every hour of the year in each region with nearly 80% of electricity from renewable resources, including nearly 50% from variable renewable generation, according to simulations of 2050 power system operations.”[27]
http://www.resilience.org/stories/2016-06-22/renewable-electricity-falling-costs-variability-and-scaling-challenges
The Grid be Black or White . Forget shades of Gray.
Short electrons for 16.66 milliseconds and something must give
Hi Political economist,
I expect there will be a need for additional backup, in the form of batteries, pumped hydro, and fuel cells (whatever is most cost effective) along with grid upgrades to get to 90% renewables or higher and I doubt this will occur World wide by 2050, though OECD Europe and North America and possibly China have a shot with proper policy, I think 60% is a conservative estimate.
The key is overbuilding capacity by at least a factor of 3 above average load and a widely dispersed interconnected grid over a wide area (all of Europe or North America interconnected with HVDC interconnects between regions). So if we need 5000 GW of wind and solar power, we build 15,000 GW of wind and solar capacity.
“So if we need 5000 GW of wind and solar power, we build 15,000 GW of wind and solar capacity. BINGO..” For a Autonomous building block – We may have 2-3kW of PV feeding a 600 Watt Down converter to get a Solid 35A @ 25V in a Batteryfree system. Don’t care about wasting PV watt-hours to have additional hours ( or capacity factor in Grid Speak) of reliable Power early and Late in the day on Cloudy days. STC PV Panel Ratings are just a Benchmark anyway .. If your worried about wasting electrons , add another driver and charge a LI-on PAK. PV Power is cheap, Stored power often many times the price. Off Grid PV Only Heavy lifting is done during daylight as much as practical. Most often Not hard to do.
Best to remember that natural gas power plants only have a utilization factor of about 50% and coal somewhat less. So the actual amount of power produced is well below their nameplate values.
I never calculate solar PV on nameplate, I calculate it on actual solar insolation, panel angles and efficiency.
Daily CO2
June 21, 2016: 406.53 ppm
June 21, 2015: 402.68 ppm
You know posting these numbers smells of deception considering it’s known Earth has already got 15% or so greener due to the extra CO2 aka plant fertilizer; scientifically the process is called ‘ CO2 fertilisation’ and is viewed positively by most true climate researchers. Read here… http://www.csiro.au/en/News/News-releases/2013/Deserts-greening-from-rising-CO2
DJW, you may be reading his motives incorrectly, Duncan may be highlighting humans success in providing a hospitable environment for our species for 1000’s of years into the future. I think he should be applauded. With out our successful efforts to replenish earths atmosphere with CO2 we were destined, as human and climate history shows, to the experience our ancestor endured which including starvation, war and disease. Have a toast to celebrate our success ??
https://wattsupwiththat.com/2016/06/22/climate-and-human-civilization-for-the-past-4000-years/
Hi Texas tea,
If you are concerned will future ice ages, perhaps we should save the fossil fuel until atmospheric CO2 drops to under 350 ppm, in about 10,000 years.
I think this an excellent idea!
What smells even more is your apparent lack of any systems thinking skills. Please crack open a few books on plant physiology and ecology. Your knowledge seems to be sorely lacking in these areas. You also don’t seem to understand nonlinear dynamics and things like feedback loops.
You can start at the two links I posted up thread.
http://peakoilbarrel.com/world-energy-2016-2050-annual-report/#comment-573507
Survivalist posted a good link on corn polinization:
http://peakoilbarrel.com/world-energy-2016-2050-annual-report/#comment-573651
And OFM has a good post as well:
http://peakoilbarrel.com/world-energy-2016-2050-annual-report/#comment-573500
Thanks Fred Magyar, I will read them. My comment was rash. I’m new at this and also still unfamiliar with a lot of the science behind climate, so I guess I should do some more reading before commenting.
Pretty much carp fishing on valium.
We are so screwed.
“A crucial concept visited throughout The World After Cheap Oil is that of the ‘energy trap’.…
Oil is transportation only – as long as the EROI of natural gas and coal is OK the games can go on. Look at canadian oil, some of it has an EROI of 2.
Alternative energy or fusion(nuclear doesn’t has the big potential) has to be started now, to take over when these reserves are gone. We only have this one bullet, and it must hit.
And yes, we will have more worker in energy industrie and have to pull them from advertising, law battles and spin doctoring or other productive parts of our industry now (I mean there is enough capacity for more people working in energy industry without anyone really missing the other jobs).
Here in Germany there are more people in tax consulting than in coal + oil industry – get real. An EROI of 5 for alternative energy + fusion would be completly ok if the economy has the time to adopt. More people cleaning solar panels and less people designing silly commercials. We have enough unemployed, too.
Enough oil for creating plastics and drugs will be here for centuries and more – you don’t need much for it, compared to transportation.
” Look at canadian oil, some of it has an EROI of 2.”
Well that is the problem because it makes economic environment very unstable. It is no coincidence that when production of oil sands and shale reached nearly 50% of the NA production everything becomes very unstable. Other oil producers did not do a single thing and world oil industry started to unravel on its own at some point of very little oversupply. There was no recession in 2014 and there was no customer line ups for Leafs in the store either. So it was self inflicted unravelling. But today glut is getting close to be over and oil consumption is still increasing. In 1-2 years it will be oil consumers turn to experience how unstable the economic system is due to low EROI.
I’ve read EROEI’s of 1.3 for some of the Canadian oil.
*Discretion Advisory Alert: Show contains segments of riot porn*
@Fernando Leanme:
FYI, this show (often) has some news/views on Latin America. Give a little pet to your pigeon for me.
Well you can choose to watch that crap or this instead. BTW these people have a pretty good grasp of the laws of thermodynamics and entropy…
Solar Impulse – Help me make it through the night
https://goo.gl/L0Qs6Y
The guys in your video, surrounded as they are by ‘artificiality’, seem caught (as you do too) in a kind of technofetishistic fog, complete with equating a woman, via the song apparently, with the plane.
Who needs a real lover when you have an electric vehicle to unwrap, and caress, ay? Eww?
Who needs a bed when one can ‘make it through the night’ surrounded, all alone and at a distance, in cold, dead technology?
Who needs a real friend when one has AI?
Who needs natural evolution when one has gene drives?
Who needs stability and nurture when one has ‘disruptive technology’?
And so on…
I am sure these guys have lots of friends and acquaintances.
Apparently these men have achieved a level of consciousness that does not involve the constant hedonistic handholding and consoling you seem to need. Let go your mother’s apron strings and explore the world.
It’s scary, and you may not make it but it’s far better than hiding in a dark cave listening to your buddies fart and snore all night, fearful of what might find you. It takes courage to explore, no matter how you do it. So man up.
Your post-adolescent prose aside, you do not, nor can you, properly ‘explore the world’, umbilical-corded to your technowomb; shrouded in your reality-decoupled ‘tourist bubble’ (likely one of the last places you will appreciate your buddy’s ‘bubbles’, incidentally).
To properly explore the world, you need to actually interact with it, ‘viscerally’, which naturally involves removing your domesticated form from its manufactured surrounds.
Technology has to be truly democratic and to make sense in part by being true to its whole point; namely, to actually improve quality-of-life without harming it for others in the process. In this regard, we, as a species, have yet to ‘man up’.
(If Fred wants to elaborate in this regard, for example, with respect to his Solar Impulse, hey, great.)
So only being naked running around without any technology is your version of exploring the world. Been done already. We are way beyond that, though feel free to feel the arctic breeze on your bare skin or to explore deep waters without scuba gear.
actually its is the perfect song for alarmist:
“I don’t care what’s right or wrong,
I don’t try to understand.”
“Yesterday is dead and gone
And tomorrow’s out of sight.
And it’s sad to be alone.”
“Yesterday is dead and gone
And tomorrow’s out of sight.
Lord, it’s bad to be alone.
Help me make it through the night.”
?
Hey, If you think the people behind the Solar Impulse project are alarmist that’s fine. I’m sure they couldn’t care less! Why don’t you look up their backgrounds or check out out the corporations who are sponsoring them. BTW, Switzerland is a pretty advanced country. Ironic that they have the LHC there as well. I’m pretty sure they understand thermodynamics there.
they also have guns under every bed. Fred check your newspaper Walmart may have some coupons and they may be having a sale on a sense of humor, you should stock up?
Methinks the Swiss are remarkably sensible people. If we hand a rifle under every bed in this country, and every man, and WOMAN TOO, knew how to use that rifle, we could put two thirds of our cops to doing useful work, and shut down most of our prison industry.
The guards and cops could be usefully employed planting in flowers in public places if we couldn’t find any thing better for them to do.
Of course there would still be a few people dumb enough, and mentally off kilter enough, to kill a spouse or rival boyfriend, etc. Not many.
A universally armed society tends to be a very POLITE society, lol. I believe Robert Heinlein is famous for saying so in one or another of his excellent sci fi novels.
We would still need the last third of the cops to patrol the highways and get kittens out of trees, etc. LOL.
The wild West was far safer than the streets of any city now. Very few people actually died of getting shot. Most died of disease or falling off horses.
Worth noting that the Swiss also make sure everyone is properly *trained* with their guns. And they issue bullets to every house for military service, but they *count them* every year to make sure you haven’t used any without authorization!
It’s a very orderly society. Ultra ultra law abiding.
They also have direct democracy — more initiatives and referenda than almost anywhere else. Which may account for the respect for the laws.
These guys are flying across oceans on solar power. Darkness does not stop them.
Meanwhile back on earth the Moaning Myrtles are saying we can’t ever have solar power run our houses, cars and industries. Pathetic.
Meanwhile back on earth the Moaning Myrtles are saying we can’t ever have solar power run our houses, cars and industries. Pathetic.
My thoughts exactly!
So what. They landed on the moon too. There should be a Marian colony by now.
What prevents us from realizing our true potential appears to be our species’ ‘pathos’, and perhaps the moment Fred’s Solar Impulse becomes truly democratic is the moment we may begin to approach its realization.
In the mean time, solar power, electric cars and industry may be destined toward impermanence. Their time may already be winding down.
Fred’s Solar Impulse
LOL! I wish!
I think you mean Martian colony. Why? I see no real use in making Martian landings and colonies. There is a lot of real estate there, but it’s not breathable, too cold, too little sunlight and the gravity is too low. A dead planet.
We are heading for our true potential, you just seem to not understand that there are steps in between that must be taken first.
That flight achieved nothing except for fanning the flames of technocopian wet dreams. There is zero practical applications for what they did and no you cant compare this to the wright bros and extrapolate out to what flight has now become.
I am all for engineering a better future but please can we remain in the real world and avoid fantasy vapor visions?
There is zero practical applications for what they did and no you cant compare this to the wright bros and extrapolate out to what flight has now become.
You are misunderstanding the goal of the flight. It isn’t about a comparison to the Wright brothers and it isn’t even about pioneering technologies for flying! Read their mission statement on their website before making a fool of yourself!
The goal of the flight is to showcase solar and battery technologies and show that if it can power an airplane flying days and nights over the Atlantic and Pacific oceans then it sure as hell can power a house or a car down on the ground.
You argument that this has zero practical applications is ridiculous. I think they have better engineers than you could possibly imagine!
Z E R O practical applications for …. extensions of the senses. Autonomous Drones monitor pipelines for vandalism or leaks. The Baggage aboard the Solar Impulse was clearly them Homosapiens. PV powered Military drones fly indefinitely, try that with hydrocarbons !zero practical applications! Non Carbon based units need Photo voltaic food – Batteries included or not.
“That flight achieved nothing except for fanning the flames of technocopian wet dreams. There is zero practical applications for what they did……..”
It achieved something for me. It gave me an idea.
On my late fathers homestead (I’ve inherited it) I want to put in solar PV to make the place self for electricity. The main consumer is a refrigerator that cycles it’s compressor motor on and off throughout the day and night. I would prefer not to invest in batteries, seeing as how technology is changing so much and prices are falling fast so, one option is to use grid tied micro-inverters. Problem is that the utility has replaced our ancient analog meter with a modern, digital one that will end with me having to pay for power that is fed to the grid. so, when the fridge motor is not running, I will be paying the local utility for power I am delivering to them!
Looking at how Solar Impulse managed their energy gave me an idea. I can put the fridge on circuit that is controlled by a photo cell, switching it off at nights. I can then turn the thermostat way up (colder) so that, the motor runs all the time when the fridge is on. When the fridge switches off at night it would be way colder than required and gradually get less cold over the course of the night.
Solar Impulse starts the day at low altitude using just enough power to maintain altitude, When the sun starts providing power they charge the batteries first, then when the batteries are fully charged they “store” the solar energy as altitude, climbing aggressively as long as there is excess power from the sun. As the power from the sun declines they reduce power to the motors to the point where they start loosing altitude. They allow this to continue till they reach a desired altitude and then increase power to the motors to maintain altitude. Rinse and repeat. They have not had to do a forced landing because they ran out of “juice” as far a I know.
As far as I can discern, one of their missions is to inspire people to think up ways they can use clean energy in their lives. Score 1.
On another front, they expand the horizons of what people think is possible, now that they have crossed the planet’s two largest oceans on solar power alone. If solar cell efficiencies continue to improve along with battery energy density, maybe one day we will see a small aircraft that, uses battery power for take of and solar power to cruise. The technology in SI2 is essentially at least 3 years old so, what will a similar effort look like in a couple years time with lighter, more efficient cells, batteries, motors and electronics? Maybe someday, at summer solstice, someone who has been inspired by what these guys did, will fly a solar powered plane over the Atlantic from west to east, taking off from Lisbon, Portugal at sunrise and landing in New York at sunset, after flying for 19 plus hours at about 180 mph (290 km/h), cruising under power from the sun.
Bingo, you got it mon! 🙂
BTW, you might want to consider double insulating your fridge and using the freezer to make lots of ice in sealed containers when the sun is shining and putting them in the fridge during the night.
Kind of the refrigeration analog of going to high altitude during the day for Solar Impulse and then using less power overnight when they are cruising on batteries. I’m sure anyone with half a brain and a very basic knowledge of physics can come up with lot’s of other ideas to more efficiently use solar.
The argument that solar doesn’t work because the sun doesn’t shine at night and batteries can’t provide enough power is obviously bogus. If you run your batteries down you are doing it wrong.
If you fill up your refrigerator with jugs of water to the extent you can, and chill it way down, you can actually unplug it for a day or even two whole days, lol, without it getting warm enough to allow your food to spoil.
Another trick is to remove ice from the separate freezer compartment if your fridge has one, and put it in the non frozen section. This works like a charm, if it is not too full of food. Use rectangular plastic containers of the sort milk comes in, and allow enough space for the water to expand without rupturing the container, no mess. RECTANGULAR containers STACK tight.
Since the grid price rates are very high in your country, you may find it is economical NOW to buy just one or two good batteries and charge them with pv, and use them to run LED lights, your computer, your music, etc to the extent possible during the dark hours.
Edit, I see Fred beat me to it, but that’s ok!
I actually do that with my fridge and I have monitored my consumption by plugging my fridge into a KillaWatt. It makes a difference.
Don’t forget Internal Defrost heaters. Wire them to Run only during Daytime. Chest Freezers / Fridges are the way go. Use a fraction watt-hrs.
Chest freezers have a hot outside only separated from the cold inside by a too thin layer of insulation. Piss poor idea. What is the fastest way to defrost a chest freezer? Empty it, leave the top open and turn it on. The heat from the outside soaks through the insulation and sloughs off the inside ice in minutes.
NAOM
Yair . . .
Before the days of solar power we ran on generator power in a remote area on the Gulf of Carpentaria . . . ambients well over for days on end
To save fuel and wear on the Listers we kept our fridges and freezers full of food or water and the engine only ran when we were at home at night and needed the aircon to survive.
The main thing is to preserve the cold by having good seals and not opening doors.
Cheers.
You might like this!
https://www.newscientist.com/article/2094954-ikea-of-energy-delivers-clean-green-solar-power-plant-in-a-box/
IKEA of energy delivers clean, green solar power-plant in a box
By Richard Kemeny
Here’s a bright idea for flat-packing. A German start-up has figured out how to cram an entire solar power plant into a shipping container. It has sent its first kits to off-grid villages in Africa, where they provide a new source of clean, affordable electricity after just two hours of assembly.
More than 620 million people in sub-Saharan Africa have no access to electricity, a situation that can keep people in poverty. And population growth means this number is rising. Those with access tend to rely on inefficient diesel generators, chugging along with crippling financial and environmental costs.
Despite that, diesel is standard for off-grid energy. “If there’s no diesel, there’s no electricity”, says Rolf Kersten of the start-up, Africa GreenTec in Hainburg, Germany, which shipped its first solar generator to Mali in December last year.
Cheers!
It need not be so, if DOE had listened to NAS in the early days of the automotive stirling effort
http://ntrs.nasa.gov/archive/nasa/casi.ntrs.nasa.gov/19830017354.pdf
Says that of auto crank stirling had been switched to free piston – hydrostatic, stirling would have been better than diesel.
One of the authors, Jack Saby had been my boss there, and I had a high opinion of him. Very unfortunately he soon retired, went to fix his house, fell off ladder and died.
Unlike diesel, stirling is omnivorous and will run well even on untreated biosolids.
” Problem is that the utility has replaced our ancient analog meter with a modern, digital one that will end with me having to pay for power that is fed to the grid.”
If your jackass utilty is behaving this way, you should install a non-feedback setup for the solar panels Are you in New Mexico? Because I’ve heard their utility was doing this.
Instead of grid-tied, do what I’ve heard referred to as “grid-assisted” — control system design (diodes, etc.) prevents any power from ever feeding back to the grid. The solar panels are taken as the first source of power, with the grid connection switched on only when the panels don’t provide enough power. Excess solar is curtailed.
Worth noting, this sort of charge-you-to-give-them-power scheme is pure loss for the utility. They should want your excess solar power. But some of them are being dumbasses.
I am in Jamaica, hence the handle. I am priming myself to get into the business of energy audits and installation of solar PV systems so, I have a pretty good idea of what products are on the market and what they can do. My issue is that grid tied systems are the most simple, least expensive systems to install. Even simple “zero feed” systems require adding a meter to detect when the system is about to feed the grid, adding cost to the system.
The ideal system would be a load shifting system that, stores energy in batteries rather than feeding the grid and then draws down the batteries before drawing from the grid. Such systems exist off the shelf but, I would like to see battery costs fall a bit more before taking the leap, I fear the day I buy batteries, is the day some significant breakthrough on the battery price/performance system is announced. 😉
The regulatory environment in Jamaica is affected by the fact that the utility was privatized in 2001 so the government has to be very careful about things that might alienate the investors. The civil servant who was largely responsible for formulating the national energy policy, used to work in system control (the nerve center) at the utility and I think he is having a major problem wrapping his head around the idea of distributed generation (how do you “control” it?). I’m sure some people around here would say he is just being pragmatic.
LONDON, June 21 (Reuters) – “Peak oil demand” has become a fashionable concept among climate campaigners but the evidence suggests oil consumption is growing at the fastest rate for a decade and shows no sign of letting up.
Global oil consumption increased by nearly 1.9 million barrels per day (bpd) in 2015, the largest annual increase since 2004, apart from the post-crisis bounce recorded in 2010.
Most forecasters predict consumption will grow by another 1.5 million bpd in 2016 and a similar amount in 2017, which would make it the strongest sustained period of growth since 2004-2006.
http://www.rigzone.com/news/oil_gas/a/145200/Kemp_Global_Oil_Demand_Shows_No_Sign_of_Peaking
The Oil Glut Is Over, Says World’s Most Powerful Oil Man
http://oilprice.com/Energy/Energy-General/The-Oil-Glut-Is-Over-Says-Worlds-Most-Powerful-Oil-Man.html
its morning again in america ??
So where is all this extra oil going to come from?
This looks like oil prices will crash upwards soon.
Investing in deep sea oil is cut strongly, on land only projects of doping old fields (fast cash) are financed – since rust never sleeps this can get a explosive mixture.
At the moment we have the production increase of project which have been started with 100$ oil – when we have 100$ oil again we have only projects started with 30$ oil in mind. And this won’t be many.
Prices will do a rollercoaster the next 10-20 years I think, with a cycle on investing on high oil prices and companies going belly up on low prices.
And naturally demand will not peak at this low prices now – demand peaks at high prices.
Maybe a rollercoaster for price, but I doubt so much for supply, which is heading lower and lower. Since 2010 discoveries have been steadily decreasing despite high investment in the high price years. Worldwide undeveloped proven reserves are hard to estimate but any that there are now will comprise of projects that weren’t profitable to develop when oil was $110 in 2014 and the oil companies starting cutting budgets to protect dividends. A lot of what is coming on line now are older, usually heavy oil or deepwater, projects that had been around for some time waiting for an oil price under which they could be made to pay. It is notable that the three of the projects that IOCs are fast tracking now are very recent discoveries – ExxonMobil in Guyana, BP and Eni gas in Egypt – not projects that have been waiting in development hell for years. National oil companies are maintaining production by accelerating proven developed reserves with in-fill drilling, EOR etc., that is not a long term sustainable strategy but makes sense if the alternative is social collapse and regime change. Similarly for companies acceleration makes no sense economically unless IRR is very high (acceleration only gains because of the time value of money), but if bankruptcy threatens then the effective IRR is high whatever actual interest rates are, but again it’s only a short term mitigation.
Hi Texas Tea,
As long as you like oil prices at $50/b or less demand may continue to increase, but my guess is that supply will not. Wouldn’t you agree?
Dennis,
In general demand will continue to grow below $50 and supply will deplete. I mentioned up thread that I believe will need at least $70 to stop the decline in supply and maybe higher. (We are probably in overshoot with regard to how much in supply has been taken off the market.) To increase production without turning on the credit faucets again, well above $100 as debt service and dividends will eat up a great deal of cash, at those levels demand will either flatten or decrease.
I subscribed to the belief that most major pup cos will take the time and be rewarded for cleaning up their balance sheet rather than the growth of production over the next couple of years. The perception LTO can provide just in time delivery is fantasy in the next couple of years. The world oil market needs 1.5-2 million barrel a day over capacity to prevent spikes relating to unforeseen supply disruption, I am afraid that cushion may have been removed from the market in the out years during this downturn.
One reason for my optimism as it relates to near term oil and gas prices here at home?
Hi Texas Tea,
Even at $70/b supply will not meet demand, but as prices go to $100/b demand growth will slow down (but probably not stop). My guess is we will need $125/b to slow demand down noticeably, but it will depend on the future cost of EVs and plugin hybrids which is hard to guess.
I’ve come to the conclusion that demand for oil is quite inelastic in the short term. In the long term, however, it’s quite elastic and *anything over $40/bbl* is high enough to drive people to alternatives. ($40/bbl is roughly $2/gal gasoline in the US.) The reason this only happens in the long term is that switching to an alternative means buying a new car, replacing your heating system, retooling your factory…
Hi Nathanael,
“anything over $40/bbl* is high enough to drive people to alternatives”
I agree with your conclusion about the elasticity of oil, but I believe oil at just over $40 is really not a driving force for alternatives. I would guess that oil over $75 is a more realistic number that drives alternatives. Of course CO2 is a driver for a small population at any price.
“Corals Are The Sad Story That Can Change The World”
“Experts say we need to care about climate change. The ongoing coral carnage may be what makes it real.”
http://www.huffingtonpost.com/entry/corals-climate-change-the-world_us_576acdece4b065534f48888e?section=
Morning in Texas America is cancer for the environment and humanity
Maybe they have not read what the expert researchers say.
http://www.sandiegouniontribune.com/news/2016/mar/20/sd-me-scripps-coral-reef-health/
Whats your point? The article you link to says a small % of very remote coral reefs have been able to be managed but they know they can’t do it for ever. They are just “buying time” until we fix the AGW thingy.
The 2016 OPEC Statistical Bulletin was issued today, for those interested:
http://www.opec.org/opec_web/en/publications/202.htm
It has some drilling and well data for some places not available elsewhere, and this year a lot of sad looking graphs concerning OPEC countries’ finances.
bentekenergy.com just published some interesting numbers about DUC wells, which came down from 2700 in November15 to 1745 in April. In the March/April period 265 inventoried wells came online, whereas the Marcellus draw has been 200 wells, which had 470 inventoried wells left in April.
My interpretation is that companies do not get new funds easily and have to bring wells online for cash. If this trend persists, Marcellus inventoried wells will be depleted soon. No need to say that this will accelerate production declines, which will finally bring a price recovery – especially for natgas.
Heinrich you are probably aware of this but may find it of interest.
http://www.geckoicapital.com/commentary?tableid=340&itemid=313
texas tea,
Thanks for the link. It is also my view that there is a strong parallel to 2012.
However the current situation is even more interesting as the US electricity mix has changed significantly due to declining coal and higher renewable resource use for electricity generation. I am already curious how this will work out.
Power burn for this Monday has been 36 bcf/d, which is an all time record for June and nearly an all time high. So, for July/August, there could be a power burn of over 40bcf/d and we could see for the first time a stock draw during the summer. My estimate for this week is a inventory build of just 30 bcf for the week.
In case anyone can make this on Sunday:
(sponsored by the Energy Exchange, free registration)
Energy + the Economy – A Roundtable Discussion
Sunday June 26, 12:30 – 5:00 pm
University of the District of Columbia, David A. Clarke School of Law
4340 Connecticut Ave NW, Room 214, Washington DC 20008 [map]
In conjunction with OurEnergyPolicy.org and the 2016 joint conference of the International Society of Ecological Economics and International Society of Biophysical Economics
Join us for an in-depth, interactive discussion with leading experts about the state-of-knowledge regarding how shifting energy trends will affect the broader economy.
Featuring
Carey King – Assistant Director, University of Texas Energy Institute
David Daniels – Chief Energy Modeler, U.S. Energy Information Administration
Steven Kopits – President, Princeton Energy Advisors
Charles A.S. Hall – Co-author, Energy and the Wealth of Nations
Plus
Drinks + Banter – Saturday, June 25, 5:00 – 7:00 pm, Nanny O’Brien’s, 3319 Connecticut Ave NW, Washington, DC. Enjoy food, drink, and lively conversation with friends and colleagues, old and new.
http://energyx.us6.list-manage1.com/track/click?u=e230969c7ec1dec75cc347eaf&id=087e413f33&e=eafb77bbf4
Any chance the talks will be posted somewhere at a later date?
No clue. But it’s billed as a roundtable, rather than talks, so I doubt it. Perhaps Jan Mueller at EnergyX could answer that.
http://www.wsj.com/articles/u-s-oil-output-to-get-boost-from-gulf-of-mexico-1466703667
Google headline if you don’t have access.
Not sure if that is enough to stop the bleeding in US production. And then there is the rest of the worlds decline.
Orlov on negative interest rates:
https://cluborlov.blogspot.co.uk/2016/06/the-money-cult.html
Interesting analysis— not quite sure i buy all of it.
(Somewhat oil related)
Siemens is proposing overhead catenary electric systems to move tractor trailers around Germany.
http://qz.com/714381/siemens-says-it-can-power-unlimited-range-electric-trucks-using-a-150-year-old-technology/
And just think, when they are stopped in a traffic jam, they will use almost no power. Unlike ICE trucks that have to keep running.
Doable for the Germans, they are sensible engineers, and Germany is a relatively compact country with a good highway system already.
Such trucks will have to have small ice engines or batteries sufficient to operate the last few kilometers to and from a major highway with the overhead lines.
Damned expensive to install, damned cheap and clean to operate once built out.
Chickens and eggs, which comes first, the lines or the trucks capable of making use of them?
The batteries are already good enough for operating 10-20 miles, easily. I hope there is more progress on overhead cat for the highways.
Looks like Brexit is happening:
http://www.bbc.com/news/politics/eu_referendum/results
Then what?
Right now oil is down -$2.44.
Now -$3.39
Wow!
Slow relocalization as the global-industrial BAU brain loses connections in a relentless, irreversible process of sociogeopolitical Alzheimer’s/Dementia…
Brain ?
It is the victory of democracy over an incompetent and arrogant political elite. Germany will be the only country staying within the EU. Then they can do what they want.
However there will be still a free trade agreement, but no political union. Phew. We are saved from the Berlin bureaucrats. Since Friedrich the Great, there is a small political and bureaucratic elite in Berlin, who wants to dictate the World in the most brutal fashion. Merkel, Honecker, the European Commission… are just puppets. Having done historically a lot of damage, they fortunately always fail at the end. Luckily they were stopped quite early by the British democracy. Thank you Britain.
Heinrich,
There are deeper reasons. Brexit is just confirmation that British elite concluded that there are no further benefits in promoting their interest through EU. In the 90’s they were pretty much on the same page with Berlin in plundering Eastern Europe that emerged from communism. So they were partners in crime at that time covered under EU flag. So there are no ideological differences between elites in London or Berlin or Paris or Washington or Moscow or Beijing. It is all $ signs in their eyes.
So what Brexit means today is that globalism (aka cheap human and natural resources exploitation) for the elite reached cul-de sac. So it is back to isolationism and waiting for new shuffling of the geo political cards. Americans will get their choice in their version of Brexit in November. It is obvious which political camp supports isolationism and who supports expansionism. And I think after the votes are counted, the results will be the same as in British voting. It is always about business. US liquid gas can be delivered to Portugal and France, smell the price atmosphere in Europe, and they will return the gas back home next morning. So it is sensible that isolationism wins at this point.
I don’t get the connection between a popular vote and a small number of British elite. The change was made in a democratic fashion, not by a small council or group of politicians.
I also do not see how countries dependent upon imports of commodities and exports of finished products can be isolationist without imploding economically.
Your 1st question. Popular vote is very easily manipulated by elite with issues based on fear and emotions and not reality. Let’s say just one issue of refugees/immigration in UK vote. If the refugees are real issue than Greeks, Italians, Germans would voted themselves out of EU long time ago because they hosted way more refugees than UK. But they did not voted themselves out because the refugees are not real issue for the elite in these respective countries. So the elite in these countries still cling for EU as better (read more profitable option for them) than they would have as individual countries. Britain’s elite on other hand would have to compromise on many issues by staying in the EU, for example finance & banking. Not all of the UK elite agree that “leave” option would be in their best interest (e.g Richard Branson) but majority that opted to “leave” was stronger at this point.
2 question:
You have to view terms “isolationist” and “expansionist” just in terms where the bigger return for the buck is. For example drilling uneconomical shale “gas” to ship aka piss away to Europe is supported by “expansionist” for their very narrow geo-political reasons. “Isolationist” just says “hey that is just crazy we are just pissing away resources and not making any money”. It is very sensible? No?
Ves says: “In the 90’s they were pretty much on the same page with Berlin in plundering Eastern Europe”
I guess that I slept through the 90’s. After the Berlin wall fell, I seem to recall Berlin spending 100’s of billlions of $’s to rebuild East Germany. And, the West heavily invested in Eastern Europe which significantly improved most of the Eastern Europe economies.
” I guess that I slept through the 90’s. After the Berlin wall fell, I seem to recall Berlin spending 100’s of billlions of $’s to rebuild East Germany.”
That investing of 100’s of billion of $ after the wall fell is very similar to investing of 100’s of billion in shale – just an illusion. It was more about of buying productive assets in the east in order to be to be closed next morning to make a room for West German products. It is the same game with shale. Someone has to make enough “room” in the market so shale can grow with their product. But the problem is “conventional” producers, let alone Russians and Saudis, are not listening. So Yes, you were asleep 🙂 We were all asleep.
The financial world over reacts , then later finds that the world is not ending and re-invests again. I doubt if this will change much at all. The markets needed to readjust downward anyway.
Will the UK ally itself more strongly with the US?
Will Scotland leave the UK and become part of the EU again?
A veritable soap opera of political plays.
I think most people is making a wrong lecture of the Brexit. Although it could not be predicted that the Brexit would win, given how close was the result, the general tendencies could be predicted.
After conventional peak oil of 2004 the world has radically changed but this is not perceptible to most. The 2008 financial crisis was the consequence of the end of cheap to extract (high ERoEI) oil and debt saturation. As neither of the problems has been (can be) solved, we have entered a different economic world. Recovery has been skin deep. The middle class is battered, the working class has seen its purchasing power eroded, and there is high unemployment/low participation while jobs migrate to Asia. All this is taking place during the best part of the economic cycle, so there is a lot of anger. The welfare state is under assault as there is less wealth generation. At the same time a peak in immigration provides a convenient scapegoat.
When the economy goes bad, the politics goes bad too. Political troubles are growing in Venezuela, Brazil, and the South of Europe, while populism is on the rise. All this is to be expected. Heterogeneous national or supranational structures weaken and crumble under economic problems. Renewed regional nationalism in the UK, Spain, and even Italy is a logical consequence. Belgium doesn’t look like it will hold either. At the same time is a feast for political extremism and populism which compounds the problem.
The business cycle is close to finish. It started in 2009 and reached its peak in 2013 and has been downwards since. The Brexit will undoubtedly contribute to its end in another global crisis that can be as strong or stronger than the one in 2008. The European Union has a lot of headwind coming. In the end the euro will not survive, at least in its present form, and we can anticipate further reductions in the EU, whether voluntary or forced.
We are going to see things that we could not believe were possible just a decade ago. It’s the end of the world as we know it. And the energy descent is both cause and consequence.
http://qz.com/714622/saudi-arabia-has-declared-an-end-to-its-oil-war-with-the-us/
Long day and have company, somebody read it closely at tell us how much is gold and how much is bullshit.
Once again, Saudi Arabia is hinting that it’s peaked. Proof will come when prices go up while Saudi production goes down.
Are we supposed to be in ‘counter-intuitive mode’, though, post-peak, where, as production goes down, so do (the average of) prices (over time)?
Beautiful Arabic Surface/Cheerio Inner-Moon
I would think “proof” of peak would be declining production.
Forever.
Regardless of decreed price — and have no illusions, if they are past Peak, price WILL be decreed.
Let’s see. We will get a declining production now, since already 1000 billions of dollars in oil investment are cancled.
So the question is: How high is the next oil price rally, and how much investment will it draw?
They can tell me anything – but not oil production increasements on shrinking CAPEX worldwide.
WTI oil futures -5.4%, NIkkei -3%, Sterling -9.3%, euro (vs US$) -3.3%. Weeeeeee!
The word of the moment is LEAVE.
I have a new update on the Eagle Ford region, here.
I now include also condensate production, and production from a couple of hundred wells drilled in nearby formations, such as the Austin Chalk.
Enno:
EFS decline takes my breath away.
2014 wells from their peak in 12/14 have fallen by now to likely under 300K BOPD, from 997 K just 18 months ago.
I’d love to see some EFS payout statements.
Payout; what’s that?
Jeffrey Brown and I guessed five years ago that only about 30-35% of Eagle Ford wells drilled down here in S. Texas would ever pay out and I am now thinking that’s being optimistic. In my opinion nothing drilled since January of 2014 will ever payout and why there are still 23 rigs or so still running down here in that stuff is beyond my wildest imagination. Everyone except EOG has more or less fled for the Permian Basin where there is not enough realized production history yet to stem the tide of new hope, and the flow of new money.
Mike
For Dennis, no way to respond upthread.
There is no FUNDAMENTAL reason public schools need be underfunded if vouchers are made available, and the law making vouchers available specifies in some workable fashion that the parents who choose to keep their kids in public schools get a certain minimum level of funding on a per pupil basis, adjusted for inflation and all that sort of consideration.
I have personally known many bright kids who were totally fucked over, almost every last one of them a minority kid by the way, because they were compelled to attend ROTTEN schools run by entrenched bueracrats, staffed by incompetent and unmotivated teachers, etc. I was in the biz, personally. Just let my professional license lapse for the last time within the last ten years.
I didn’t actually teach in those rotten city schools, but I lived in the immediate vicinity of some of them, and since being a rolling stone tradesman off and on, I got to know many of the people who lived in the city, and sent their kids to these schools as a matter of NECESSITY.
I hate to sound like a complete cynic, but at least half of the people who are teaching in American classrooms today ought to be fired out of hand.
OFM
“I hate to sound like a complete cynic, but at least half of the people who are teaching in American classrooms today ought to be fired out of hand.”
with a statement like that that I may need to pay more attention to your essays, that is a real gym of truth and enlightenment ??
Like texas tea, I agree with OFM. However, we have shot ourselves in the foot again. I would venture to say that “diversity” will suffer if we fire the ones that should be fired. So, it will never happen.
Attrition might happen. I envision classrooms with a big screen TV. Expert Instructors give a previously taped interactive video instruction, that can be used over and over, and updated. The students have a gaming device [for lack of a better word] that allows them to answer questions as the lesson proceeds. A robot monitors the class. I believe that much of this is in the works.
I would venture to say that “diversity” will suffer if we fire the ones that should be fired. So, it will never happen.
So basically you are a xenophobe and a racist, eh? Living in this world must really suck for you.
Thanks for proving my point!!
Yeah, what exactly is your point? That being racist is an acceptable point of view. Love to hear your argument explaining it.
I did not know that you were that stupid. I will not waste my time.
Panama Canal to open amid shipping downturn
Canal Administrator Jorge Luis Quijano said Wednesday the shipping market is cyclical and will rebound. There are already 162 reservations for large-ship voyages through the new locks through December, and the new locks are expected to earn between $400 million and $450 million in their first year of operation.
“Things won’t stay at zero. The world will continue to grow,” Quijano said. “Eventually there will be a rebound and the good thing is that we are prepared to take advantage of that when it occurs.”
Quijano said the current economic downturn may last one or two years.
“We believe that the United States will see significant growth in the future for its new export capacity for natural gas and oil,” Quijano said. “That is what we are betting on, and that is why I feel so optimistic that the canal will do well.”
Oh boy!
“Things won’t stay at zero. The world will continue to grow,” Quijano said.
The scientific community finds that significant evidence contradicts the Expanding Earth theory, and that evidence used in support of it is better explained by plate tectonics:
Measurements with modern high-precision geodetic techniques and modelization of the measurements by the horizontal motions of independent rigid plates at the surface of a globe of free radius, were proposed as evidence that Earth is not currently increasing in size to within a measurement accuracy of 0.2 mm per year.[18] The lead author of the study stated “Our study provides an independent confirmation that the solid Earth is not getting larger at present, within current measurement uncertainties”.
HAR!
Source Wikipedia
https://en.wikipedia.org/wiki/Expanding_Earth
The actual physical dimensions of the Earth may be more or less constant, I doubt it is swelling up like a balloon left out in the sun,
……. BUT I THINK I remember reading that the MASS of the Earth is actually increasing VERY VERY slowly due to there being a constant rain of small to medium sized particles such as micrometeorites, etc, being swept up as the Earth orbits the sun.
I can’t remember the estimated figure , but it supposedly runs into a few tons per day, more than is lost by a minute fraction of the atmosphere blowing off in the solar wind, etc.
Don’t remember where I got this image but it is of a micro meteorite. I added the false color. Supposedly it is iron oxide.
Here is the image…
Well, I dunno Fred, I’ve seen a lot of micrometeorites and they’ve all had a glassy texture. That looks more like something salvaged from the floor of a Chinese restaurant. 🙂
You are probably right!
But I did find the source. As I mentioned the false color was mine. I also created a scale bar from their info so I could calculate the volume and measure surface feature on it. Hey, some people follow the Kardashians, I have ADHD and compulsively read all kinds of science papers. 🙂
https://cosmosmagazine.com/geoscience/ava-and-meteorites-unveil-ancient-earths-atmosphere
But after collecting micrometeorites embedded in limestone that formed around the end of the Archaean aeon (four billion to 2.5 billion years ago) near Port Hedland, he and his team saw the tiny space rocks contained certain types of iron oxide minerals – which, if Earth’s atmosphere was oxygen-free at the time, should not have existed. “I twigged to the fact that this was telling us about the chemistry of the upper atmosphere,” he says.
The current rate of loss of atmosphere to space is about 285 tons per day, which more than compensates for the gain in meteorite dust.
Mr. Market is getting sucker punched repeatedly today.
Matters none, financial chaos comes and goes, everyone manages to continue the tough slog come what may.
As long as there is enough oil and gas for today, you can’t worry about when the well goes dry, just drill for more or find a different source of energy to keep you on the go, if not, too bad.
Just making it all go the best you can, without electricity, oil, machines, the lollapalooza of resources, it will all stop now.
Resources and usable energy are first on the list, finances a distant last. Too much energy pumped into money matters, not enough attention on how it all gets there.
The Baker Hughes Rig Count is out. Oil rigs down 7, gas rigs up 4.
Rigs are so much more efficient now; so that means we lost more oil with these 7 rigs?
You can’t lose what you never had. I suppose you can say if 7 rigs more were running they would have been expected to produce X oil which would be available to offset X depletion. Still having rigs in the grass is not the same as losing production.
This is late, but what the heck:
” BlueTwilight on March 5, 2013 – 4:12am Permalink
We here at TOD are familiar with Carlos de Castro’s calculation of Global Wind Power Potential (The Oil Drum, September 5, 2011). http://www.theoildrum.com/node/8322
In my opinion he made several errors in his calculation that produced his low power conclusion.
From your link, Draft: Global solar electric power potential: technical and ecological limits,
http://www.eis.uva.es/energiasostenible/wp-content/uploads/2011/11/solar-energy-draft.pdf
I see that he has also done a similar analysis for PV. I see numerous bad assumptions.
1. PV installations are not limited to land. Shallow water and floating installations, which allow easy tracking, are possible. Ships can use PV panels to provide some of their power.
2. PV installations are not limited to ice free land although Antarctica would be a bad site and is reasonable to exclude.
3. He considers only centralized PV systems and ignores urban areas which excludes all rooftop installations. His performance ratio, f2, of 60% is far too low for a local rooftop system.
4. He cherry picks sites with bad insolation, 3 in Germany (> 50 degrees N) and 1 in Canada (Sarina 43 degrees N). One is in Spain (Olmedilla at 39.6 degrees N) and another is in Portugal (Moura at 38.2 degrees N) presumably with better insolation, but their data in Table 2 suggests something is amiss. Insolation is a function of weather and latitude which he does not include.
5. Land occupation, f3, is a function of latitude which he ignores because he considers sites biased at higher latitudes where rows must be spaced farther apart. He includes the unused land area around the parameter of the PV station as though that inefficiency in land use is unavoidable. For example, Moura’s layout is inefficient. In a build out to maximum potential, land would be used more efficiently. These are ridiculous assumptions for calculating maximum global PV potential.
6. Performance ratio includes PV cell degradation which does not seem to apply to polycrystalline cells.
7. In table 3, his estimated average value for electrical power density of 3.4 We/m2 is a bit low for an average. For example, although my shed roof is 17.84 m2, not completely utilized, laid out inefficiently, batteries reduce my efficiency and I am not using MPPT charge controllers, its current actual average electrical power density is 5.6 We/m2. I could add at least 3 more KD-140’s without altering the inefficient layout increasing the average electrical power density to 8.6 We/m2. These power densities assume the power is produced for 24 hours/day. These values would be even higher if I was located at the equator.
8. Geographical Surface Potential….
In summary, his analysis of global PV potential is filled with errors and personal biases just like his analysis of global wind potential.”
http://www.theoildrum.com/node/9841/949779