The North American Baker Hughes Rig Count came out Friday. The decline continues. Baker Hughes gives an oil and gas breakout for every basin and state with five years of historical data.
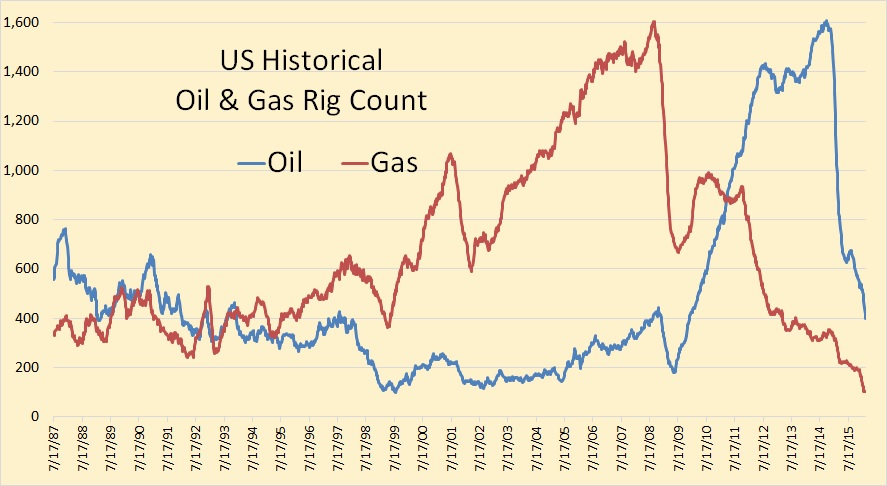
Baker Hughes has twenty eight and one half years of historical data for total US rigs but only five years for individual basins. Gas rigs peaked in August 2008 at 1,606 rigs, over six years before the peak in Oil rigs. On February, 26, gas total US gas rig count stood at 102, a decline of over over 93%.
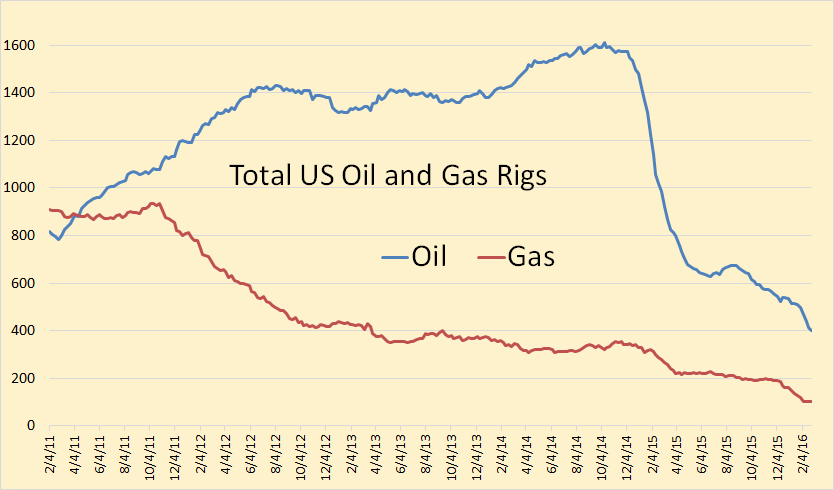
A closer look at the total US total rig count.
October 10, 2014 1,609 rigs
February 26, 2016 400 rigs
Percent decline 75%
In figuring the percent decline for each basin I have use October 10 as peak, the week US rigs peaked even though all basins did not peak on that week.
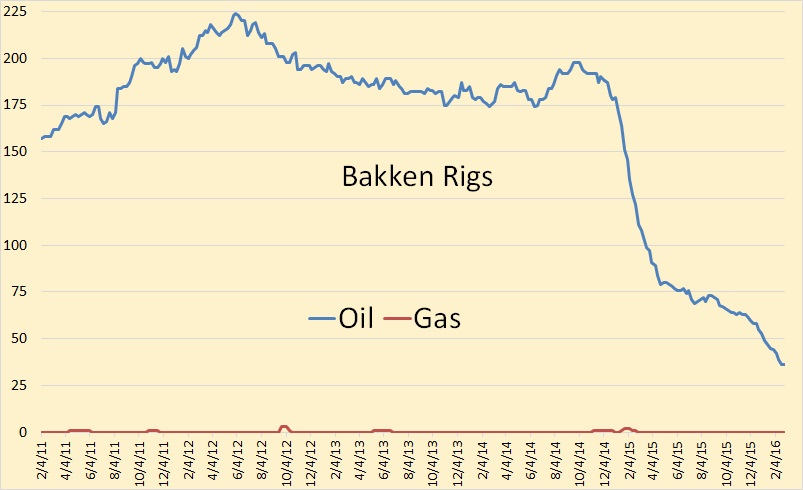
Bakken
October 10, 2014 198 rigs
February 26, 2016 36 rigs
Percent decline 82%
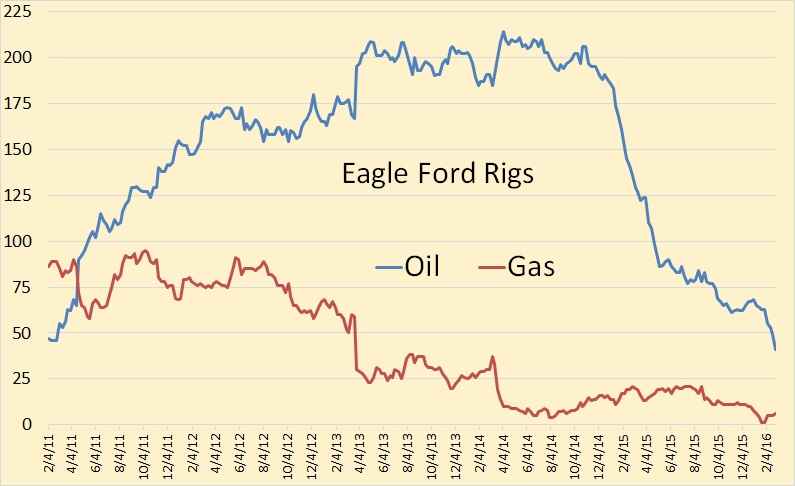
Eagle Ford
October 10, 2014 202 rigs
February 26, 2016 41 rigs
Percent decline 80%
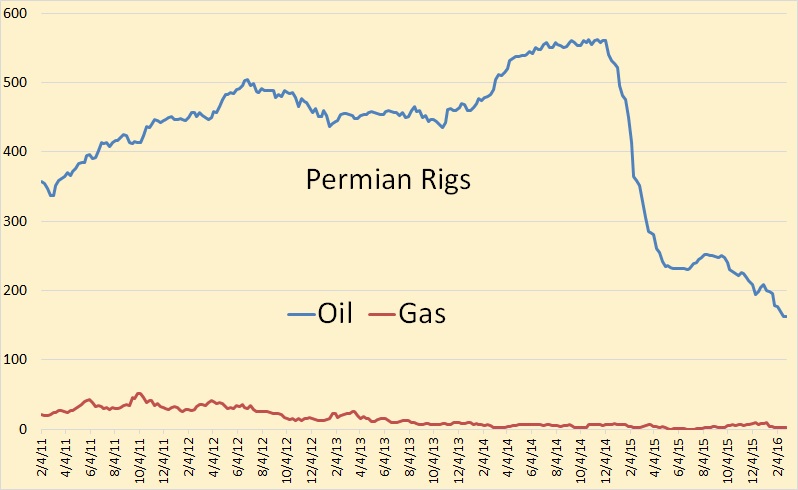
Permian
October 10, 2014 554 rigs
February 26, 2016 162 rigs
Percent decline 71%
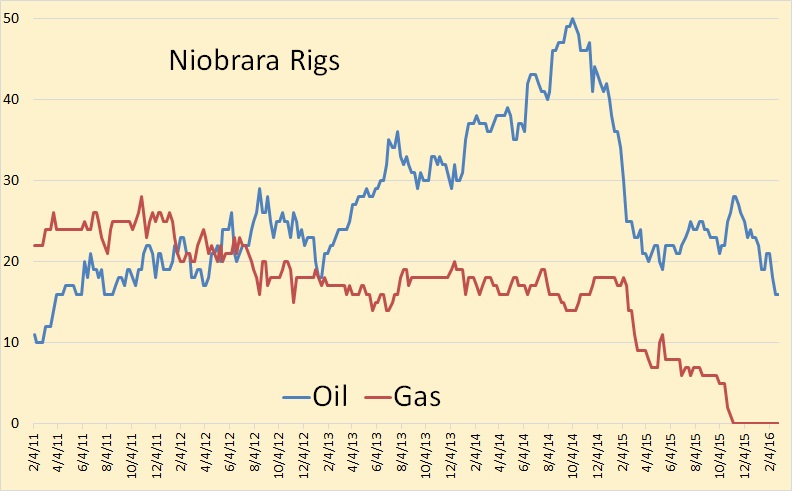
Niobrara
October 10, 2014 50 rigs
February 26, 2016 16 rigs
Percent decline 68%
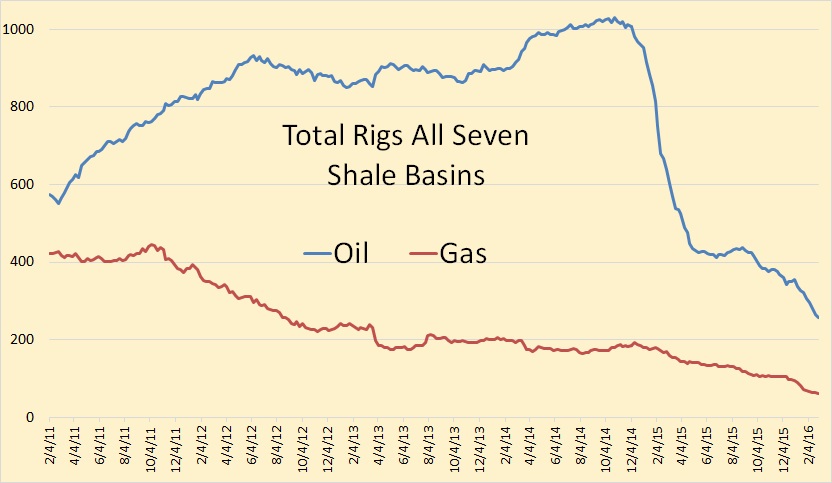
Total rigs all seven shale basins
October 10, 2014 1,028 rigs
February 26, 2016 257 rigs
Percent decline 75%
Note: There are shale (LTO) wells outside the seven shale basins and there are conventional wells inside the shale basins. So the above chart and the one below should in no way be taken to represent shale versus conventional. But they are somewhat of a guide. Wells drilled in the shale basins are, by a wide margin, light tight oil wells, except for the Permian that is. But outside the shale basins it is not so clear. I have no idea what percentage of wells drilled outside the shale basins are LTO wells, but the percentage is not small.
One more point to note. This past week horizontal rigs declined by 19 while vertical rigs increased by 8… whatever that means.

Total rigs outside shale basins
October 10, 2014 581 rigs
February 26, 2016 143 rigs
Percent decline 75%
In the shale plays a drop in the rig count does not mean a drop in well completions. And except for the Bakken, we have only a vague idea how many wells are being completed each month. We know that the inventory of DUCs, (drilled but uncompleted wells), is quite high. But if so, why are any shale wells being drilled at all? Well here is one reason:
DUCs in a Row for 2016: It’s Anybody’s Guess
Jeb Armstrong, Vice President of Energy Research for the Marwood Group, doesn’t expect most producers to have a large inventory of DUCs. Instead, he sees the backlog as a matter of circumstance rather than a way of loading up on potential volumes. “The only reason why I can see a company willingly drilling DUCs is because they have a rig contract that’s too expensive to cancel,” he said in an email to Oil & Gas 360®. “Might as well keep the rig operating and plow the capital into the ground than pay a penalty to the rig owner.”
Raymond James analysts shared a similar viewpoint, noting a certain dynamic on the oilservice industry. “Lower returns and crimped cash flow lead operators to slow activity and conserve cash in any way possible,” the note said. “Since many of the land rigs had longer-term contracts and the frac crews didn’t, the quickest way to conserve cash is to drill but not complete.”
But wells are obviously being completed. In fact more wells are being completed than being drilled but we obviously don’t know just how many. And…
DUCs to Prolong Shale Boom Hangover
Many prognosticators of oil and gas markets have found themselves on the wrong side of US production calls throughout the shale era after failing to understand and model the risks associated with operational momentum. Increases in well productivity brought higher potential returns, and every company in the oil patch scrambled to gain the assets, people, and infrastructure to grow production (and hopefully cash) in the future. As supply growth outpaced demand, prices sank, but production hasn’t responded with an equal intensity. Why doesn’t production respond accordingly? The same reason you can’t turn around an aircraft carrier on a dime, momentum.
The momentum of the shale boom can be seen in the large overhang of drilled but uncompleted wells (DUCs) sitting out in the field today, looming over the market and weighing on any potential oil price recovery…
Until the number of DUCs returns to levels more aligned with historical working inventory levels (3-6 months of drilling), we expect their threat to loom large over the market and have a dampening effect on any near-term price recovery. But their longer term impact could loom just as large. If producers steer too much capital away from drilling, and instead harvest DUCs to maintain production and cash flow in 2016, the human capital behind the rig fleet could be lost to other industries, making service cost inflation all but guaranteed when US supply growth is again needed. It looks like this hangover will be felt for years to come.
Conclusion
The decline in the oil rig count cannot, in the near term, be directly linked to a decline in oil production due to so many DUCs. But eventually it must. Steep declines in oil production must eventually follow steep declines in the rig count. And as we see a drop in production we will see a corresponding rise in prices. This, in turn, will cause an increase in well completions, knocking the price back down again.
So don’t expect any quick recovery of either oil prices or production. Yes, it looks like the hangover will be felt for years to come. And in the meantime peak oil will be in the rear view mirror. But no one will notice for years to come.
Why would they have DUCs? Because, they are maybe profitable wells at a higher price. How is that going to affect this lower for longer nonsense?
There are always DUCs. There have always been DUCs, even when the price was well above $100 a barrel. In fact the inventory of DUCs grew every year that the price of oil was in the $100 range. And the number of DUCs reached their peak while prices were still high. There are DUCs because there is always a delay between when the drillers finish their work and when the frackers start their work. And the number of DUCs grew, during high prices, because there were more wells being drilled than wells fracked.
Higher prices will bring on more completions, bringing on more production, knocking prices back down again, keeping prices lower for longer. Right or wrong, that is simple logic. It is not nonsense.
Though higher prices will only bring on more completions if there is money to pay for them, which is not a given.
That interrupts the logic, and is not to be considered. It is not important that upstream companies are out of bucks, and nobody will lend them any. Drilling will continue to be done with cash available until which time, the coffers start filling. May take some time to put into completing those wells that are only profitable at 80. Be quacking for quite a while. However, that interrupts the logic of lower for longer, so it is not to be considered.
You don’t have to be an economist or a CPA to figure out how difficult it will be for oil companies to again be growing at this point. It is mostly going to be funded by internal cash flow. Let’s assume that EIA’S estimate of the average Eagle Ford’s EUR to be 168,000 bbls, and somewhat meaningful. So, maybe the average first year’s production to be 75,000 bbls. At 100 a barrel, they recover the cost of the capex, plus a little more. They can drill another well with positive cash flow. Probably describes the average DUC. At 80 a barrel, they are in negative cash flow. Probably, a profitable well, but negative cash flow. They did not make back enough money to drill a new well the first year. Later, next year, but not by the end of the year. So amount available for capex goes down. At 40, they may, or may not recover the cost of the well. If the DUC is an average Eagle Ford EUR, then it could sit for quite a while if lower for longer is the logic.
That is the main reason you won’t see large scale ramp ups on production until it stays over 70 for a while. A large percentage of the area is average, or less than average.
Oil Production Vital Statistics February 2016
Thanks for the article and charts Euan. I find the Middle East OPEC rig count data going back to 1995 very interesting. It looks like 2011 saw a surge in the Saudi, Kuwait, UAE, Qatar rig count (from roughly 60 to 150). Crude oil production from those four doesn’t seem to show much increase over the time period that the rig count has more than doubled. Kuwait is flat to down, KSA is flat to up, Qatar is down and UAE is flat. I assume that all of that drilling activity is infill drilling and that this perhaps might contribute to some steeper decline curves in the future than if the infill drilling had not taken place. It seems OPEC Middle East is drilling like mad to stay flat.
Anybody know the OPEC Middle East rig count split between oil and gas rigs?
Anybody have any historical data on how infill drilling contributes to steeper future decline rates in conventional fields?
Thanks for the post Ron.
Couple of comments:
– I think the rig count is an important metric to follow. However, some adjustment is needed to correct for the fact that rigs are more efficient now in drilling wells. Probably several reasons for this (better rigs, crews, methods, pad drilling, drilling in a closer area, etc). E.g., in ND in 2012 every rig on average drilled 0.8 well per month. In 2014 this was 1.1, and in the last few months it was 1.4. I agree with you that the rig count eventually has to impact production (it will be with some delay, and corrected with the above factor).
– Shallow showed a comment from the Hess CEO that another reason to keep drilling was to keep at least some experienced production staff in the company.
– Another reason why production hasn’t fallen as rapidly as some expected was that newer wells produce a bit more in the first couple of months, followed by a steeper decline. This can be seen from the production profiles from the different shale areas. This is more like a one-time gain however.
– Some companies apparently do intend to drill more wells than complete them in 2016. Continental Resources plans to drill 73 wells, and complete 26 (net) wells in 2016. Note that in 2015 they actually reduced the number of wells waiting for completion by 35. Completion is about 2/3 of the total well cost.
Completion is about 2/3 of the total well cost.
Thanks Enno, I did not know that.
Imagine the production profile if they could complete every single well in the fracklog on the same day, vs if they complete one a day for the next 11 years.
These are obviously absurd examples, but just to make the point that really what we would like in order to accurately predict production is a ‘frac crew count’ rather than a rig count, and to agree with what you say above.
Re: Survivor Bias in Calculating Decline Rates
Enno,
Following is a link to, an excerpt from, a question I posed on a prior thread. It’s my understanding that you are attempting to correct for survivor bias, in regard to decline rates, by dividing annual production by the original number of producing wells. I constructed a simple model which seems to show that this makes no difference. It seems to me that one is calculating rates of change in total production in both cases (total production or total production divided by original number of wells).
http://peakoilbarrel.com/texas-oil-production-still-on-a-plateau/#comment-560963
Jeffrey,
I don’t use the well count. For each vintage group, for each exact year on production, I sum the latest 12 months production, and compare it with the total (again over all relevant wells) 12 months production of the prior year on production.
For example, to calculate the decline rate of the 2008 vintage group, in year 4, I calculate the total production these wells had in their 4th year of production, and compared it to the total production from the same wells in year 3 on production.
I have excluded wells that appear to have been refracked from the whole set, to try to establish the natural rate of decline.
As I noted in my comment, I agree that this works for volumes, but not for rates of decline, i.e., there is no difference between rates of change for total production by vintage year versus total production by vintage year, divided by the original number of wells.
Following is an excerpt from my comment linked above:
The exponential year over year rate of decline in total production from 2012 to 2013 was 22%/year (natural log of 336/420).
If we divide the 2012 and 2013 production by 10, i.e., the original number of wells completed in 2010, the exponential year over year rate of decline in production was also 22%/year (natural log of 33.6/42.0)–as the number of producing wells on the lease fell by 75%.
So, again, unless I am missing something, it seems to me that the rates of decline chart you showed reflects the rates of decline in total production by year, without any weight given to survivor bias.
Are you disputing this?
The only way I see to address the survivor bias issue is to show the number or percentage of plugged/inactive wells by year, on the same chart as the year over year rates of decline chart. On the example I showed, the plugged/inactive percentage would be 0% in 2010, rising to 90% in 2013.
Jeffrey,
I understand your example, but I don’t see an issue regarding survivor bias. The 22% is the decline number I am interested in, as it reflects the total decline that can be expected for that group, for that year.
In any case, it’s a non-issue for now, as not many wells are dropping out yet (about 1% of wells a year). Let’s leave it at this.
I agree that the 22% decline number reflects the decline from the wells still producing, and the percentage of plugged/inactive wells may or may not be material in regard to survivor bias. But that is not the issue. It doesn’t matter whether 1% of the original producing wells or 50% of the original producing wells are plugged/abandoned at a given point in time.
This is a math question.
If production for a group of wells (not my model wells) completed in 2010 declines by 80% from 2010 to 2015, while the percentage of plugged/inactive wells (completed in 2010) increases from 0% in 2010 to 50% in 2015, are you seriously asserting that there is not a survivor bias issue? Or for that matter, if the percentage of plugged/inactive wells increases from 0% in 2010 to 1% in 2015.
In any case, why not include a chart showing the percentage, by year, for the plugged/inactive wells along with the chart showing decline rates by year? For example, 100% of the wells completed as oil wells in 2010 had some level of production, and what percentage of those 2010 wells were plugged/inactive by year, as time goes on?
Probably the best way to show a survivor bias chart is to show the number of wells showing some level of production as time goes on, expressed as a percentage of total number of wells with reported production in the reference year. That way, the slope of the curve would be in the same direction as the slopes of the decline rates. For my example, the survivor percentage by year for my 10 well model would be:
2010: 100%
2011: 70%
2012: 40%
2013: 10%*
*2013 and subsequent years until last producing well is plugged.
Of course, when the survivor percentage hits 0%, production = zero.
An interesting question would be projected half-life, to-wit, how many years would it take for the survivors among a group of wells completed in a given year, e.g., 2010, to be reduced to 50% of the original number?
As noted above, the observed half-life for the 2007 vintage wells completed on the DFW Airport Lease in the Barnett Shale Play–the wells that Chesapeake asserted would produce “for at least 50 years–was about five years.
Hi Jeffrey,
As Enno points out for the Bakken/Three Forks after 8 years about 1% of 2007 wells that were not refracked have been permanently abandoned. The average 2008 to 2012 well will be shut in at about year 15 if they are profitable to produce at up to 7 b/d of output. This will depend on oil prices in 2023, which are hard to predict.
Dennis,
Are you now arguing that the survivor bias is not material, whereas you previously, and repeatedly, asserted that there was no survivor bias in regard to rates of change calculations? Following is a link to the original question, followed by three of your comments:
http://peakoilbarrel.com/texas-oil-production-still-on-a-plateau/#comment-560612
*In regard to my model
Hi Jeffrey,
As I said before get the spreadsheet and present whatever you think is important.
I am arguing that there is no survivorship bias, and even if there were it is not important because there is so little of it.
Or in short, I agree with Enno Peters, and will also try to leave it there.
Following is my original question, followed by Enno’s response. My point was and is that Enno’s approach is a pointless exercise in regard to rates of change, since he is, in both cases (with or without attempted survivor bias adjustments) simply calculating rates of change in total production.
And here is the question that Enno has still refused to address:
“the percentage of plugged/inactive wells (completed in 2010) increases from 0% in 2010 to 50% in 2015”
This is a hypothetical assumption. The real number of plugged wells is low and therefore it can be ignored
The 50% abandonment number in five years was based on a real life case history in the Barnett Shale Play, the 2007 vintage wells on the DFW Airport Lease that Chesapeake asserted would produce “for at least 50 years.”
As I said, it doesn’t matter whether one assumes a 50% or a 1% abandonment percentage in five years, this is a math question.
Are you guys incapable of answering a math question?
Enno and Dennis have repeatedly asserted that that there is NO survivor bias.
In any case, at least for people who do not reject fundamental mathematical principles, it’s when, not if, that survivor bias becomes a factor in regard to year over year rates of change calculations.
Hi Jeffrey,
Lets say output was 500 kb/d in 2010 from 500 wells and in 2015 these same 500 wells were producing 100 kb/d, but only 250 of the wells were producing. If I use 500 wells in the denominator for both 2010 and 2015 to find the output of the “average” well then in 2010 the average well produced 1000 b/d and in 2015 the average well produced 200 b/d.
There would be survivorship bias if I claimed the “average” well produced 400 b/d in 2015 and that is not what I do.
So I don’t see any survivorship bias. As long as we include all the wells in the data (including those abandoned) survivorship bias is eliminated.
Hi Jeffrey,
Could you define survivorship bias?
Perhaps Enno and I understand this term differently from you.
Enno and I consider output from the entire play or in my case I will often construct a hypothetical “average well” where the average well profile is equal to total output divided by the total wells completed.
You are correct that this is a question of arithmetic.
Let’s say 50% of the wells were abandoned and initially there were 100 wells completed. If we take total output and divide by 100 to find the average well profile, then for this hypothetical average well there is no survivorship bias.
There would be survivorship bias if I divided output by the number of producing wells to find the average well profile, but that is not what is done, I use 100 in the denominator even if there are only 50 wells producing (in the example above.)
Survivorship bias is only an issue of one uses producing wells rather than the initial number of wells completed when calculating average well output. The denominator is held fixed regardless of the number of wells plugged.
Dennis,
I am not sure what JB’s beef is.
Included in your model is that the wells have declined to the extent that they aren’t contributing much to the total.
It is possible that he is not including in his math a hyperbolic or diffusional decline per well?
That’s what’s great about having access to all the Bakken oil data. For once, we can actually do accurate depletion modelling and book-keeping. Using convolution techniques, one can keep track of wells coming on-line and generate cumulative production curves that match the actuals — just by using an empirical per-well decline model.
The painful truth may be that this approach is sophisticated enough that it is not taught in any petroleum engineering or reserve engineering textbooks. But then again, why would they teach this, since it has nothing to do with maximizing production efficiency. It’s simply something that needs to be done by oil patch outsiders interpreting how fossil fuel reserves decline.
Hi WHUT,
If there is someone that gets the math, it would be you, yes the output of the wells at the end of their lives is low.
Mr Brown seems to think when a well profile is presented for wells completed in 2010, that we take output and divide by the number of producing wells.
If that is what we did there would be survivorship bias, but we don’t do that.
If there were 1000 wells completed in 2010 we take output an each year (or month) and divide by 1000 wells, no matter how many wells are actually producing.
That eliminates survivorship bias when an average well profile is calculated, unless I am missing something.
Hi Jeffrey,
You said:
I agree that the 22% decline number reflects the decline from the wells still producing, and the percentage of plugged/inactive wells may or may not be material in regard to survivor bias.
The 22% decline rate reflects the decline rate of all wells completed not only the wells still producing.
Let’s say 1000 wells were completed and output was
100 kb/d (example chosen for simple arithmetic rather than realism) in the first year, let’s also assume that 1 year later output fell to 80 kb/d from the initial 1000 wells, but that 100 wells were plugged and abandoned.
No survivorship bias
year 1 output is 100 b/d for average well
year 2 output is 80 b/d for average well
a decline of 20% for first year
Survivorship bias
year 1 100 b/d for avg well
year 2 89 b/d for avg well (80,000b/900 producing wells)
a decline of 11% for first year
I don’t use the number of producing wells, I use the total wells completed in the denominator no matter how many wells are producing, that eliminates any survivorship bias.
The answer to your question in bold is yes that is exactly what I am asserting.
Hi Jeffrey,
As long as one uses 10 wells in the denominator for all years to construct an “average” well profile there is no survivorship bias, if one used the number of producing wells in the denominator there would be survivorship bias.
I use your model above to find a NSB (no survivorship bias) average well profile and an SB (survivorship bias) average well profile. Chart below.
Price is too low to allow wells to live long. It’s as if the ground moved up.
As noted up the thread, I showed that dividing annual production by the original number of producing wells (10 wells in the model I showed) to correct for survivor bias has no effect on rates of change calculations. In both cases, one is simply calculating the year over year rates of change in total production from surviving wells, and as noted, it’s when, not if that it becomes a material factor.
Dennis had the following response in one of his previous comments:
How does one respond to people who reject fundamental mathematical principles? More importantly perhaps, why should one waste one’s time responding to people who reject fundamental mathematical principles?
I think it’s time for another grizzled oil patch veteran to bid you guys adieu. Good luck with your continuing efforts to, in effect, to assert that 1 + 1 = 3, because it feels like a better answer.
Hi Jeffrey,
No we are not using surviving wells in the denominator, this is what you fail to see. We use the total number of wells completed in the denominator.
Hi Jeffrey,
Which mathematical principles are being ignored?
We complete 10 wells and track output of those 10 wells over time.
Average output for those 10 wells is total output divided by 10. It doesn’t matter if 9 of the wells have zero output, the average output is still the total output divided by 10. Please point out the mathematical error in this reasoning.
Hi Enno,
Please keep up the good work and please keep providing us with great data on the LTO plays. I am convinced that it is you that understands the basic arithmetic here. There is no survivorship bias as long as all completed wells are included in the denominator of any average well calculation. If we reduced the magnitude of the denominator so that it matched the “producing wells” rather than keeping the total wells completed number constant (regardless of how many wells had been abandoned), then there would be survivorship bias.
There are those that fail to understand this fairly basic point.
Jean Laherrere had a post on POB that indicated a 20 to 30 month lag between rig count and production, during the expansion phase. Empirically the curves seemed to match but I don’t get why the delay is that high or the correlation so close. However if true it would suggest production is going to fall off of a cliff over the next 2 to 6 months.
http://peakoilbarrel.com/bakken-oil-peak-jean-laherrere/
“Another reason why production hasn’t fallen as rapidly as some expected”
Rats can chew thru a PV Source circuit and you have barbecue but Future Energy Production is not Jeopardized. With an unconventional well It’s my understanding that the Resource may be affected if shut in or altered. Perhaps in the environment, E&P’s “can not afford” to take this risk (??)
Enno,
Thanks for your comment.
Baker Bughes in 2012-2014 issued well count for key U.S. oil and gas basins.
Using the well count and rig count, they have calculated the number of wells drilled per 1 rig per 1 quarter and year.
Unfortunately, this product was discontinued in 2015.
Below are their numbers for the Williston basin:
Debt swaps become a tough sell for cash-strapped U.S. energy firms
The deepening slump also means that producers need to offer more attractive terms – higher interest payments and more collateral – to win over investors and avoid the brutal equity wipeout that happens in most bankruptcies.
The two biggest operators in the Bakken, WLL and CLR has said that they will not complete any wells that they are drilling in the Bakken until oil prices are in the mid $40s.
Both companies have a few rigs drilling there.
Sharp decline in oil demand predicted according to Oilprice.com article.
“But BNEF sees EVs displacing 2 million barrels per day (mb/d) of oil demand as early as 2023. That is just the start. The real pain will come after that point as EV sales start to skyrocket. BNEF estimates that EVs could capture 35 percent of the market by 2040, which would displace 13 mb/d. For an oil market currently in tatters because supply is exceeding demand by a meager 1 to 2 mb/d, the destruction of 13 mb/d of demand should be unsettling, to say the least. EVs present an existential threat.”
http://oilprice.com/Energy/Energy-General/Electric-Vehicles-Could-Soon-Reduce-Oil-Demand-By-13-Million-Barrels-Per-Day.html
I don’t think that Bloomberg New Energy Finance or OilPrice has a good handle on the peak oil problem, but this is landmark prediction from mainstream corporate America as to the potential of EV’s . Imagine if they added in the high mpg ICE’s that are bound to be produced in competition (or through necessity) to EV’s, the projected demand would be even less. Add a carbon tax system and the demand for oil will drop further.
Rough and ready arithmetic without even a napkin indicates that in order for electrified cars to displace a couple of million barrels of oil per day, somewhere in the general neighborhood of ten million will have to be on the road and in regular use, depending on assumptions about how much they are used.
If the price of batteries declines sharply, as expected, and as soon as expected, I can see that many pure electrics and plug in hybrids on the road in 2023. Some countries will continue to subsidize them directly , and others will subsidize them indirectly via higher fuel taxes or import taxes. A few localities may simply mandate electrics only for new car sales.
Here in the Land o the Free and the Home of the Brave, we tend to forget that most other countries tax the hell out of gasoline and diesel fuel, and the cost of charging in those countries is small, compared to the cost of a tank of gas. So the incentive to save on fuel costs is still there in many places .
Most of us don’t believe it will ever happen, but the social fabric of this country is changing at such a fast rate that a number of formerly unthinkable things have come to pass over the last few decades.
An increase in oil taxes is no longer entirely out of the question in the USA.
Urban folks who don’t drive much will not kick much about a higher gasoline tax if the money is earmarked for mass transit, so as to reduce the traffic they have to deal with.
More and more people are giving up driving altogether, and will be ready to vote a higher tax on gasoline since they are not going to be paying it.
I wouldn’t kick at all if my state doubled the state tax, so long as the revenue are spent on road maintenance, or on mass transit. The savings in vehicle wear and tear and time would be a bargain for me, even though I don’t drive much any more.
And even though I never take a bus or subway these days, the more people that do, the cheaper gasoline will be.
With more and more non driving poor people, politicians may eventually find it expedient to use some fuel tax money to subsidize general revenues, rather than the other way around, using general revenues to maintain and build roads. Give it ten more years, and you may see it happening, in some states and some localities.
The price of Lithium Carbonate needed for batteries has gone from 6,000 per ton to $14,000 per ton in the last year. Any increase in demand will send the price of batteries up not down.
This guy says $6,000/ton in 2016 for “big 3”.
http://investingnews.com/daily/resource-investing/energy-investing/lithium-investing/lithium-price-2016-joe-lowry/
Also, we’re dealing with about the same situation as the LTO-patch,
hype and boom leading to excess supply soon enough.
The same has happened with silicon for pv cells.
Once manufacturers realized that there was continued demand, they ramped up production.
The exact same will happen with raw materials for batteries.
Anecdotal evidence to be sure, but when I got home today there was a young woman on an electric bicycle standing by my parking spot talking on her cell phone. So I said hello and chatted a bit. She has no intention or need to buy an ICE vehicle. More interesting was that her battery pack was homemade from recycled laptop batteries. She charges her batteries at home but she talked about getting a charger with foldable solar panels that she could take with her to both charge her bike battery and smart phone. I have a hunch that there are a lot more of her generation who are not going to be using a lot of gasoline to get around in the near future. That means more and more demand destruction for oil.
Fred, bicycles are good for some areas, but deadly in the icy weather that lasts up to 5 months in my region.
Considering that a Toyota Camry uses only 7 horsepower to drive at 60 mph on a level road, I think that four wheeled low horsepower vehicles may become all the rage in the future. 20 to 30 horsepower is all that is needed for a personal vehicle if properly designed and not overloaded. I can see 10 horsepower electrics being practical for personal and local transport.
They will certainly not need nearly as much material or build energy, while being highly conservative on fuel or electricity.
Fishin’
They have to simplify the cars and lighten them up, big time. Right now, our 2009 Yaris is, (in my opinion) at least twice as heavy as it should be. We had to order hand crank windows, beilieve it or not, but air bags are mandatory.
Jeez, I woke up today and got going with life by 5:30. It was 7 deg and raining. Supposed to be a high of 11 deg. It is now 3 deg and sleeting blowing 45 kts. I just lit the woodstove in the shop and am waiting for our spring to arrive. Not biking weather at all!!
https://goo.gl/56s3I1
Cycling to work in winter (Oslo, Norway)
More anecdotal…12 years ago I worked with the #1 bike trailer company in the world, which was a Co-op by the way, and we made more recumbents than anyone. Bought out and dismantled by a huge private equity firm now none of it is happening.
Opened a small restaurant across from the University and got heavily involved with localization, transition, sustainability, local food production, etc. We set up a bike exchange and maintenance center where I helped people electrify bikes with hub motor retrofits. University started an ev challenge project with national races. The excited young folks made it all so worthwhile.
Turns out the whole thing was simply a fad, I doubt there is more than 2 or three ebikes still on the road, 90% of the localization efforts are dissolved, sustainability group still meets regularly but the only thing sustained is their group meetings. We have gotten a few more local farmers to plant more food crops but only when they can get a reasonable contract for there crop which is tough as the same bean or grain can usually be shipped in for much less.
Due to the economic vibrance of the University and the fact that Oregon is the #1 state in the nation where people are moving into we now have massive building boom, cost of living increase, 5 times the traffic of 10 years ago, and more monster trucks and suvs than you could imagine. We used to be a biker friendly community now you take your life in your hands.
I am not just countering your cheeriness with doom, I am simply reporting what is happening everywhere I go here on the west coast. My daughter is in the Tempe Arizona area and it is very much the same except that no one rides a bike. I brought her bike out to her when we moved her and she said she was literally laughed at when people saw it. Granted it is too hot to ride most of the time but still. Her boyfriend has dropped out and partnered with some friends to flip properties as real estate is booming.
I don’t doubt what you observed but I estimate it represents about one tenth of one percent or less.
Thanks for the post, Ron
This chart from Rystad Energy indeed shows that the number of DUCs was rapidly increasing during the shale boom, when oil prices were around $100. It has peaked in late 2014 and was decreasing since then
If the number of DUCs is almost unchanged for the last 9 months it implies the number of completions is falling in lock step with the number of wells being drilled. Drill rigs are becoming more efficient on average, but it still implies a very rapid fall-off in production in the coming months.
If no wells are completed in 2016, output in the Bakken drops by roughly 40%per year in the first year. Not a very realistic scenario, though. If an average of 35 wells per month are completed, the drop is about 25%/year. If 60 wells per month are completed, output drops about 20%/year and 70 wells completed per month results in about a 15% drop in Bakken/Three Forks output.
I have no guess about how many wells will be completed, but somewhere between 0 and 70 new wells per month on average for 2016 will probably cover it.
Bakken rigs down to 35, with one to lay down/stack.
McKenzie county, makes up 19 of those 35 rigs.
Mountrail and Williams are at 5 and 4 respectively,with Williams about to go to 3!
Dunn Co at 6.
I have to agree with Ron, This sharp downward trend has to have a direct effect on the Bakken oil production, in the shorter time frame,rather than the longer term,
From Reuters:
U.S. shale’s message for OPEC: above $40, we are coming back
Mon Feb 29, 2016
http://www.reuters.com/article/us-usa-oil-shale-idUSKCN0W20JH
For leading U.S. shale oil producers, $40 is the new $70.
Less than a year ago major shale firms were saying they needed oil above $60 a barrel to produce more; now some say they will settle for far less in deciding whether to crank up output after the worst oil price crash in a generation.
Their latest comments highlight the industry’s remarkable resilience, but also serve as a warning to rivals and traders: a retreat in U.S. oil production that would help ease global oversupply and let prices recover may prove shorter than some may have expected.
Continental Resources is prepared to increase capital spending if U.S. crude reaches the low- to mid-$40s range, allowing it to boost 2017 production by more than 10 percent, chief financial official John Hart said last week.
Rival Whiting Petroleum, the biggest producer in North Dakota’s Bakken formation, will stop fracking new wells by the end of March, but would “consider completing some of these wells” if oil reached $40 to $45 a barrel, Chairman and CEO Jim Volker told analysts. Less than a year ago, when the company was still in spending mode, Volker said it might deploy more rigs if U.S. crude hit $70.
While the comments were couched with caution, they serve as a reminder of how a dramatic decline in costs and rapid efficiency gains have turned U.S. shale, initially seen by rivals as a marginal, high cost sector, into a major player – and a thorn in the side of big OPEC producers.
Nimble shale drillers are now helping mitigate the nearly 70-percent slide crude price rout by cutting back output, but may also limit any rally by quickly turning up the spigots once prices start recovering from current levels just above $30.
The threat of a shale rebound is “putting a cap on oil prices,” said John Kilduff, partner at Again Capital LLC. “If there’s some bullish outlook for demand or the economy, they will try to get ahead of the curve and increase production even sooner.”
Some producers have already began hedging future production, with prices for 2017 oil trading at near $45 a barrel, which could put a floor under any future production cuts.
While the worst oil downturn since the 1980s sounds the death knell for scores of debt-laden shale producers, it has also hastened the decline in costs of hydraulic fracturing and improvements of the still-developing technology.
For example, Hess Corp., which pumps one of every 15 barrels of North Dakota crude, cut the cost of a new Bakken oil well by 28 percent last year.
What once helped fatten margins is now key to survival in what Saudi Oil Minister Ali al-Naimi described last week as the “harsh” reality of a global market in which the Organization of Oil Exporting Countries is no longer willing to curb its supplies to bolster prices.
While Deloitte auditing and consulting warns that a third of U.S. oil producers may face bankruptcy, leading shale producers say their ambitions go beyond just outrunning domestic rivals.
“It’s no longer enough to be the low cost producer in U.S. horizontal shale,” Bill Thomas, chairman of EOG Resources Inc, said on Friday. “EOG’s goal is to be competitive, low-cost oil producer in the global market.”
Thomas did not say what price would spur EOG to boost output this year, but said it had a “premium inventory” of 3,200 well locations that can yield returns of 30 percent or more with oil at $40.
Apache Corp, forecasts its output will drop by as much as 11 percent this year, but said it would probably manage to match 2015 North American production if oil averaged $45 this year.
One reason shale producers can be so fleet-footed is the record backlog of wells that have already been drilled but wait to get fractured to keep oil trapped in shale rocks flowing.
There were 945 such wells in North Dakota, birthplace of the U.S. shale boom in December, compared to 585 in mid-2014, when prices peaked, according to the latest available data from the Department of Mineral Resources. Their numbers are growing as firms like Whiting keep drilling, but hold off with fracking.
Some warn that fracking the uncompleted wells can offer only a short-term supply boost and a sustained increase would require costly drilling of new wells and therefore higher prices.
“It’s going to take a move up to $55 before we see anyone plan new production,” says Carl Larry, director of business development for oil and gas at Frost & Sullivan.
To be sure, it is far from certain whether oil prices will even reach $40 any time soon. Morgan Stanley and ANZ expect average prices in the low $30s for the full year.
Some analysts also warn resuming drilling quickly may prove hard after firms laid off thousands of workers and idled more than three-quarters of their rigs since late 2014.
In fact, John Hess, chief executive of Hess Corp last week took issue with labeling U.S. shale oil as a “swing producer.” Hess told Reuters in an interview that U.S. shale firms should be rather considered as “short-cycle” producers, which might need up to a year to stop or restart production.
And even scarred veterans of past boom-bust oil cycles are not sure what will happen once prices start to recover – during the last big upswing a decade ago, shale oil did not even exist.
“We are a little concerned that this time there is one dynamic we’ve never had previously,” said Darrell Hollek, vice president of U.S. onshore at Anadarko Petroleum Corp.
—————————————-
Some analysts also believe that drilling/completion activity in the U.S. will rebound in the second half of the year, as oil prices reach $40-45. See, for example, US rig count forecast by Raymond James (chart below). BTW, their energy analyst expect WTI to reach $50 by the end of 2016.
AlexS. This talk is pure desparate talk, and nothing more.
A group of us have been analyzing the Statements of Future Cash Flows in the 10K’s recently released by some of the large shale players, including EOG, CLR, WLL, PXD and CHK.
The assumptions made in the reduction of future production costs are questionable. Here are the revisions from 12/31/14 to 12/31/15 for these companies:
EOG
2014 $51.533 billion
2015 $32.061 billion
CLR
2014 $25.799 billion
2015 $10.869 billion
WLL
2014 $20.772 billion
2015 $12.344 billion
PXD
2014 $18.223 billion
2015 $11.475 billion
CHK
2014 $17.036 billion
2015 $7.391 billion
The only thing I have been unable to determine is whether any drilling and completion costs are included by these companies in “future production costs”
I would note all break out “future development costs” and all have greatly reduced numbers from 2014 to 2015, which makes sense given large budget cuts.
In any event, it is worth noting the future estimates of these companies in the 10K and how radically they have changed from 12/31/14 to 12/31/15.
Further, it is noteworthy that if current oil and gas prices are plugged into the 12/31/15 future cash inflows, there is little positive to negative future net cash flows.
In summary, the claims are not backed up by the company SEC filings, IMO. Also, the large long term debt incurred in prior years cannot be ignored either, IMO.
Here is a repost of CLR’s snake oil sale press release and calculations for PDP reserve adds for CLR and what that implies about EUR’s in the Bakken. If correct, breakevens for the Bakken is much higher than $55.
Sorry, 850K. From CLR’s Q4 press release:
“Given its plans to defer most Bakken completions in 2016, Continental expects to increase its Bakken DUC inventory to approximately 195 gross operated DUCs at year-end 2016. The year-end 2016 DUC inventory represents a high-graded inventory with an average EUR per well of approximately 850,000 Boe. At year-end 2015, the Company’s Bakken DUC inventory was approximately 135 gross operated DUCs.”
From an analyst named Frank, who posts on Yahoo. His calcs look right to me.
“Look at the 10-k reserve and production data – proved developed only of course.
In the Bakken
They added 180 net wells in 2015
They produced 38 mm BO and 47 mmcf ng or 46 mm boe
Reserves declined 15.5 mm BO and ng reserves increased by 16.2 mmcf or 2.7 boe
Therefore reserves declined by 13 mm boe
So adds from new wells was 46-13 = 33 boe from 180 wells. That is 185k boe per well. A little shy of 800k.”
EUR is total expected production from a well during its lyfe cycle, not annual production, especially as these wells were producing less than a year in 2015.
But 850,000 boe EUR still looks overoptimistic
AlexS. Shaleprofile.com is a good place to test the EUR claims, IMO.
See also
http://seekingalpha.com/instablog/121744-mark-anthony/1354531-the-real-bakken-shale-well-decline
I know. The EUR sabove are calculated from the change of PDP reserves adjusted by a year’s production, divided by wells completed. That should give you the amount of reserves added per completed well.
But 850,000 boe EUR still looks overoptimistic
It’s not overoptimistic. It is simply a wild dream that is achievable in 8 years on very few wells. 450,000 gross bbl EUR is more probable overall in the Bakken outside of sweet spots ( or around half of this estimate. )
Some people use 300,000 for their models: three year total 150 kbbl times two)
From an old post
http://peakoilbarrel.com/bakken-1st-24-hour-prod-validity-verified/#comment-475905
The EIA in its Annual Energy Outlook 2015 has a much more conservative estimate of the Bakken wells average EUR: only 203,000 bbls. But this includes a lot of potential (marginal) wells in the periphery of the play that may never be drilled.
Alex,
The EIA in its Annual Energy Outlook 2015 has a much more conservative estimate of the Bakken wells average EUR: only 203,000 bbls.
This is not an estimate. This is a death sentence.
$30* 200,000 = $6 million.
Or in academic language EROEI close to one.
Or, if you wish, EIA certification that Bakken is a Ponzi scheme producing “subprime oil”…
This is how they calculate technically recoverable resources, not economically recoverable.
shallow sand,
Thanks for your analysis. I read all your posts.
I totally agree with you that shale companies’ financials do not justify a rebound in activity even if oil prices rise to $40, $45 or $50.
Hi AlexS,
I agree we will need somewhere from $60 to $80/b. Perhaps costs for the core areas are even lower than this, for the average Bakken/ Three Forks well n North Dakota before the price crash breakeven was between $70 and $80 per barrel, I do not know how much this has fallen over the past 12 to 18 months. Shallow sand would have a much better idea about current break even in LTO plays.
Dennis,
I think shale companies need between $60 and $80 to increase production volumes, while being cash-positive. This implies a moderate growth, not 30% p.a., like in 2013-14
Individual wells in the sweet spots may have much lower breakevens, but cash breakeven at corporate level is always higher.
That said, some companies may start increasing drilling / completion activity at $45-50, even though that would mean burning more cash
Hi AlexS,
I am not sure what would be gained by increasing completions if it is going to increase cash burn.
However I do not understand why the completion rate has remained as high as it has since prices first crashed in late 2014.
One potential explanation is that in core areas the breakeven oil price might be lower, but I doubt it is as low as $30/b except perhaps for the best 1% of the wells.
It seems to me that the smart oil companies will wait for oil prices to reach at least $65/b before increasing their well completion rate, but there don’t seem to be many smart companies in the LTO plays (except perhaps XTO and Statoil).
Dennis,
For many years investors in US E&P companies had rewarded growth over capital discipline. Investment banks’ analysts were ignoring financial risks associated with the shale sector’s growth model. The MSM was cheering the shale boom.
This has created a corporate culture, which is very difficult to transform even in a sharply deteriorated oil market environment.
Therefore, I expect many shale companies to return to growth as soon as oil prices reach $45-50.
This contradicts a normal logic, but this is how these companies are used to work.
Hi AlexS,
Maybe so. I wonder if all the bankruptcies might change the culture a bit. It sure will make finding money to burn more difficult and investors may look beyond the investor presentations to the 10k and the bottom line and reward fiscal discipline.
Hard to know for sure. The banks may pull back and the bond investors may require very high interest rates and industry behavior might change as a result.
Dennis,
a quote from and article:
“once the entire U.S. shale space goes bankrupt, it will emerge debtless only to start drilling and pumping anew prompting the Saudis to continue to ratchet up the pressure in an endless deflationary merry-go-round.”
http://oilprice.com/Latest-Energy-News/World-News/BP-Claims-That-Oil-Storage-Limit-Is-Far-Nearer-Than-We-Realize.html
Hi AlexS,
If the entire Shale industry goes bankrupt, they will have trouble with financing new wells in my opinion. So increasing output will be difficult without financing.
If the assets are bought by companies using there own cash (no bank or bond financing), they will not throw money away on wells that will never break even.
Wouldn’t they solve the financing problem by hedging output?
If future prices are high, you can guarantee a profit for most of the well’s output.
Hi Nick,
Hedging only gets the job done if you can hedge at a price higher than breakeven. If the spot price is $50/b. You would need to be able to hedge at $75/b or more for the average well to break even, in practice this is not likely to happen.
Currently the futures price in Dec 2018 is $10/b above the April 2016 futures price.
So possibly if oil prices reach $65/b hedging might be an option, below this maybe not. (I have ignored transaction costs in this example.)
That makes sense, but I was talking about financing: whether banks or investors would finance new drilling. Wouldn’t hedging solve that problem?
Many oil producers failed to hedge in the last several years, due to overconfidence. They won’t repeat that mistake soon…
Hi NickG,
I am no expert on hedging (very far from it).
I would think the extreme price volatility makes it more difficult to hedge.
In any case all problems could easily be solved by hedging then the price of oil wouldn’t matter, I am fairly certain that is not the case. Hedging reduces risk, but there are costs involved. Oil prices under $50/b as currently forecast by many public agencies and private firms out to 2017 are going to sink the LTO industry leading to many defaults on loans and bonds.
How do you think this affects the availability of financing for LTO firms in the future? Would you expect financing might be more difficult in such a scenario?
You don’t think a hedge means you are paid in advance for output, I hope. It is either a futures contract, a swap, or a set of puts and calls (costless collars). Essentially a contract to sell oil at a certain price at a future date.
It does not help a company that needs cash to drill a well now with the needed cash, this money you either have or you borrow.
This is probably a stupid question, but don’t you need a rig to complete those duc? Or do they have their completion already run and only await the frac-job?
No, you don’t need a drilling rig to complete a DUC. They are awaiting fracking and then the installation of a pump and other hook ups.
Pretty sure 6 million pounds of sand took quite a while to get to the site. And huge swimming pool quantities of water ditto.
Completion is not a wave of the hand. Probably have to compete with others waiting for fewer and fewer trucks.
I beg to disagree, from experience as a rolling stone with time wearing a hard hat. There are almost for sure more fracking crews and more equipment available than there is work.
The ones that work cheap enough are no doubt busy as hell. If the price of a frack job goes up a little, assuming such jobs have been cheaper than usual recently, then folks who recently parked their equipment and laid off their men will go back to work on a week’s notice.
Jobs in the oil fields are scarce as hell now, and most of the people who have been laid off in the last year no doubt have not found new jobs in their industry. You can bet most of them are ready to go back to work asap, and quite a few of them are probably willing to start a few bucks cheaper than they were getting a year ago.
Being a rolling stone, I could usually find SOMETHING that paid ok,when I wanted to work, because I could work in three or four different trades as a journeyman, master of only two, but passable at the other two, and ok in a pinch in a couple more. Most trades people can’t do that, and when they have to go outside their specialty, they have to take second class pay for a year or two while getting up to speed.
I have no idea how flexible fracking crew workers are. The truck drivers could go to work anywhere. Ditto any pipefitters, welders,industrial electricians.
Ditto laborers, but most likely at much lower pay rates for the laborers, because back home, there is usually a lot more competition than on the road living out of the suit case.
In any case the odds are high that most of the laid off people are making less on any new job than they were before, and ready to go back to fracking.
EIA’s Petroleum Supply Monthly:
U.S. oil production in December 2015 was 9,262 kb/d,
65 kb/d higher than the EIA’s forecast in the February Short-Term Energy Outlook (9,197 kb/d)
The EIA continues to underestimate US oil production in its forecasts.
AlexS,
adjustment was -200k/day
stocks change -195k/day
US production in December was 9.062kb/day when adjustment for unaccounted for oil is factored.
Moreover, stocks actually declined in the month of December at a rate of 195k/day.
Dan,
Adjustments refer to the balance of supply (production + imports), consumption, exports and stock change.
Adjustments do nor refer to oil production.
Oil production was 9,262 kb/d, 65 kb/d higher than forecast in the EIA’s February STEO (9,197 kb/d)
AlexS,
if consumption, exports, imports, and stock change are held constant than production had to be lower. Of the five parameters that go into the formula, the most difficult in terms of estimating is production. Thus, holding others constant production had to be lower to have a negative adjustment.
Dan,
The EIA apparently calculates oil production, using data for consuption, imports, exports and stock change only in they weekly estimates.
Their methodology for monthly numbers is completely different.
The EIA uses surveys of key producers for 15 states and statistics from state oil regulators for other states. Then the EIA adjusts these numbers according to their methodology.
But this is not the adjustments you can see in PS Monthly.
Besides, consumption, exports, imports, and stock change are NOT held constant; they are also constantly revised.
Alex,
One percent (probably the most charitable estimate of error margin for EIA STEO ) for 9,262 kb/d will be 93 kb/d
From this point of view your statement does not make any sense. Those two values are equal within the margin or error +-93.
likbez,
The 65 kb/d difference between the most recent estimate for December 2015 published on Feb 29 and previous estimate issued on Feb 12 is a fact
How can a fact make no sense?
My statement is that the EIA has been constantly underestimating US oil production volumes and therefore had to revise upwards its previous forecasts.
Thus, the estimate for September 2015 has been revised by 480 kb/d between September STEO and today’s Monthly Production Report (MPR).
Compared to 480 kb/d, 65 kb/d is not much, but there might be further revisions.
EIA’s US monthly oil production estimates for 2015: from STEO Sep.15 to MPR Feb.16
Alex,
I’ve seen a couple of articles about how Oklahoma’s production statistics were understated for some time due to reliance on an old computer system and manual adjustments which never made the released data. This data was incorporated into the EIA production data until recently when they switched to reliance on surveys of producers and discovered the differences.
Generally there was said to be an understatement of Oklahoma production by around 100 kbopd for a lengthy period. This may be part of the reason for the understatement you noted.
An article on the EIA production change.
http://www.upi.com/Business_News/Energy-Industry/2016/02/12/EIA-revises-Oklahoma-oil-production-higher/8641455284577/
Article from Daily Oklahoman about the understatement
http://newsok.com/article/5478761
dclonghorn,
Yes, the most recent revision was for Oklahoma. Earlier, there were also revisions for Texas and some other states.
These are revisions of historical numbers. They may be more modest in the future, as the EIA new methodology (based on producers’ surveys) appears to be more accurate than that based on the data obtained from state-level agencies.
What’s important, the EIA has also been very conservative in its forecasts.
The chart below shows that over the past 5 years the actual US total liquids production was almost always higher than initial forecasts.
This may change in 2016, as the EIA forecast for this year from the January 2015 STEO was higher than in most recent STEO. But this is due to much lower prices: In January 2015 the EIA was projecting the average WTI price for 2016 at $71, and current forecast is only $37.6
U.S. total liquids production estimates and forecasts:
from STEO January 2012 to STEO February 2016
While revisions in US production numbers reflect the unexpected high growth in LTO production, the EIA has also been extremely conservative in its forecasts for some other non-OPEC countries.
Russia’s total liquids production estimates and forecasts:
from EIA STEO January 2012 to STEO February 2016
I bet the EIA has yet to revise its numbers for Russia for the last several months.
Two other sources, IEA and JODI, show a growth trend.
(JODI apparently uses a different barrels/ton conversion rate)
Russia C+C+NGLs production estimates:
EIA STEO February 2016, IEA OMR February 2016, JODI
Hi AlexS,
I believe you have shown in the past that JODI is reporting crude only for Russia and leaving out condensate and NGL, or the numbers would match up if that is what they are doing (based on my recollection). I also believe you have shown that the IEA data matches the Russian Energy Ministry data.
This suggests that the Oct 2015 EIA World estimate might be low by 200 kb/d. The EIA data is 10.14 Mb/d of C+C for Russia in Oct 2015, what did the Russian Energy Ministry report for C+C output in Oct 2015?
I found a report suggesting November output was 10.8 MMb/d in November, October might have been about 10.7.
So World C+C output might have been about 600 kb/d higher in October than reported by the EIA, roughly 80.7 Mb/d
In fact if all of the difference in the EIA and IEA liquids estimate was due to different estimates of Russian C+C, then all but 100 kb/d of the decline in World C+C from July 2015 to Oct 2015 would be eliminated and there would be roughly a plateau in World output over that period.
I agree with Ron and AlexS that we can expect a decline in US output, possibly on the order of 1000 kb/d from December 2015 levels for US L48 onshore by December 2016. This may be offset by increases in OPEC output (about 500 kb/d). Overall World C+C may fall between 500 and 1000 kb/d in 2016.
Dennis,
For Russia, JODI separately reports crude production (which excludes condensate) and NGL production, which includes condensate.
The EIA also classifies most of Russia’s condensate production as NGLs.
The IEA’s estimates for both C+C and NGLs are very close to Russian statistics.
The chart above shows C+C+NGLs numbers from the 3 sources, so their estimates can be compared.
And this comparison shows that since mid-2015 the EIA’s data did not match other sources. This was also the case in the past, and the EIA ultimately had to revise its estimates for Russia. The revisions are simply delayed by several months.
If we look at C+C only, the most recent numbers from the Russian Energy Ministry are:
Thanks. Interesting that JODI’s numbers are different (are they reporting NGL in barrels of oil equivalent maybe)?
Alex,
My statement is that the EIA has been constantly underestimating US oil production
IMHO you are missing possible correlation of “misunderestimation” of US oil production with “cheerleading” of oil price slump. Please note that this is not about some “wild” conspiracy theory 🙂
As unforgettable Bush II said:
and
The same is true about EIA estimates of the USA oil production. May be there is such a specialty “misunderestimator” for government employees 🙂
If we assume error margin 1% for EIA data that means that EIA data should be rounded to two meaningful digits before making any conclusions.
That makes minimum meaningful difference 100,000 bbl. Everything below that should be considered to be statistical noise.
In other words EIA operating with four meaningful digit on the data with error margin at or above 1% is just a sophisticated form of deception of (mathematically challenged) public creating an impression of precision were it does not exists.
And if the addition is below the error margin it can’t be considered statistically meaningful because the value 9,262 is in reality an interval from 9.162 to 9.362 within which the precise value lies.
I generally try to use two significant figures, e.g., global C+C production increased from 74 million bpd in 2005 to 78 million bpd in 2014.
Per EIA Petroleum Supply Monthly, GOM production increased from 1521 kbopd in Nov. to 1633 kbopd in Dec. An increase of 112 kbopd. US production excluding GOM was 7784 kbopd in Nov. and 7629 kbopd in Dec. a decrease of 155 kbopd, approximately 2 percent of Nov. production.
GOM production continues to have long lead time production coming in. US ex GOM is dropping.
Lower 48 states onshore: a decrease of 157 kb/d,
including North Dakota: -27 kb/d; Texas: -65 kb/d; other states: -65 kb/d
Even though there could be upward revisions, December was likely a turning point.
I expect declines to accelerate in 1Q16
Even though there could be upward revisions, December was likely a turning point. I expect declines to accelerate in 1Q16.
I concur.
Alex, DCLonghorn,
Nice charts, and good points, thanks.
Thank you, Enno
“The EIA continues to underestimate US oil production in its forecasts.”
I think they have a tendency to underestimate in rising conditions, but will overestimate in falling conditions.
http://cdn.oilprice.com/images/tinymce/2016/ThisSC2.jpg
from this article:
http://oilprice.com/Energy/Energy-General/Is-The-EIA-Too-Optimistic-On-US-Oil-Output.html
Their weekly estimates appear to lag actual inflections by 2-3 months.
Pemex lost $32 billion last year. That is more than the GDP of Latvia, Cameroon, Paraguay and 89 other countries. It is 2.5% of Mexican GDP.
The CEO has issued a statement slashing costs:
http://www.pemex.com/en/investors/investor-tools/Presentaciones%20Archivos/Message%20CEO_i_160229.pdf
I’d interpret that to mean we should expect 4 to 8% decline rates in their production from here on.
http://www.zerohedge.com/news/2016-02-29/mexicos-oil-giant-posts-record-32-billion-loss-cuts-crude-price-forecast-25
The global economy seems to be tottering on the edge even with cheap oil. If the price had stayed at $110 and these losses had been covered by OECD consumers where would we be (or well will we be if the price does recover eventually) – I guess even more debt until the bubble really does pop.
The rig count is getting clipped at a fairly fast rate in the Bakken. It’s starting to look like the Black Knight in Monty Python’s Holy Grail. Just a flesh wound.
Rig count graphs have/are close to sharkfin shape.
*https://www.youtube.com/watch?v=WHE1dM4hYCw
Mercenary Song by Steve Earle, a great song.
Copy and paste after the asterisk.
R Walter
The rig count graph shows a highly inefficient approach, quadruple the rig count gets less than double the production gain. Then it falls off due to unsustainable economics.
Unless government and the laws get involved, the market will tend to weed out the less efficient producers in the long run. That old game of competitive edge.
But what happens when the big game starts to fall apart, all the stuff that people want which requires the use of oil? What happens when the sales, production, and shipping drops out?
When people are keeping cars for 20 years, not driving so far and not buying a whole lot of unnecessary junk?
A deck of cards can last decades for a family at no cost. An ipod, iphone, iwhatever for each member of the family has to be replaced every few years at large cost along with the big monthly bills to feed the info/entertainment/communication machines. What happens when this virtual house of cards and cars starts to fall apart? What would happen if people and families started playing board and yard games together again with no need for power or high tech manufacturing facilities?
Could civilization be transformed by the simple use of a checker board or Monopoly game? Or maybe the kids will start playing outside again and there will be one car per family (or less).
Didn’t that family or group horseshoe or wiffle ball game have a greater importance because it did not happen every day, 24/7? It was special, something one might remember. People getting together rather than sitting alone watching their TV or video. Putting the fun back into sports might ruin a whole business machine, but it might make for a better life, instead of militarized school sports. Might make for a lot less depressed and anxious people too.
I know, it’s a recipe for economic disaster, using less and getting more out of life in an economic world that demands MORE, MORE, MORE, RIGHT NOW.
More is not more, when it comes too easily. My old Grandpa told me that he got just as excited at the sight of an ankle and calf when he was a young man as I ever did at the sight of an equally attractive girl in a micro mini skirt, and I have no doubt he was dead on correct.
STUFF is good, up to a certain quantity. But it does not buy happiness, so long as you have about as much as your peers. Having less tends to lead to unhappiness due to our being so status conscious.
Haha, that is funny about your Grandpa!
“Stuff” has a real, objective value, up to a certain point.
Outhouses are miserable, even if you have the best one in the ‘hood. Running water makes life easier, regardless of it’s status value. A washing machine makes life much easier, even if it’s a Sears and everyone else has a German expensive model.
I agree that after a certain point you don’t get more satisfaction from stuff. A lot of people are on a consumption trap. See Maslow’s hierarchy of needs…
R Walter,
Bakken. It’s starting to look like the Black Knight in Monty Python’s Holy Grail.
Brilliant comparison !!! Simply brilliant.
And the KILLER Rabbit is:
A: HAL. B: KSA C: CITI. D: 350.ORG
http://www.forbes.com/sites/arthurberman/2016/02/29/what-really-controls-oil-prices/#3aca881b71e4
Here is a short excerpt from this article, in which Berman basically argues that the price of oil is controlled by the level of storage at Cushing. I agree at least to the extent than the price correlates closely with storage at Cushing.
xxxx
For oil prices to increase, Cushing inventories must fall. That means that both U.S. tight oil production, chiefly from the Bakken play, and Canadian light oil production brought by pipeline to Cushing must decline.
Bakken production was consistent in 2015 at about 1.2 million barrels per day. Canadian oil imports to the U.S. decreased from April through July 2015 and may have contributed to the fall in Cushing inventories that lead to a $15 per barrel increase in WTI prices. At the same time, decreased production from the Eagle Ford and Permian basin tight oil plays would free up storage in the Gulf Coast that might allow more oil to flow out of Cushing.
xxxx
Now here are a couple of points. Just how is it that so called traders can control the amount of oil that goes to Cushing, or leaves ? The traders can control NEITHER PRODUCTION NOR CONSUMPTION. The end user, the overall economy buys and pays for as much oil as it WANTS, at any given price. The lower the price, the more the economy will buy, everything else held equal, but changes in consumption just don’t happen overnight. Of course the end users buy as cheap as they can, and so does every middle man in the industry, from the truckers, railroaders, and pipeline operators to the independent retailer.
Ron nailed it. Producers do not determine price, but their PRODUCTION determines price. Nobody is going to pay any more for crude than he has to, and there is just too much crude arriving on the market for it to sell at a higher price. Ron understands. Berman understands. He says too much oil on hand means a low price, and he is certainly smart enough to know where crude oil comes from, lol.
The price will go up, when deliveries to refineries and tank farms goes down, or when the economy picks up enough to buy more oil at a higher price.
I am waiting for somebody to explain to me precisely how great white shark companies such as Exon and Saudi Aramco are duped into allowing middlemen to make big profits on their sales to refineries, or how they get a big cut out of refineries sales to wholesalers, or wholesalers sales to retailers, or retailers sales to end users. How are these traders supposed to be able to dictate prices to truckers or railroads or pipeline companies that transport oil?
Now there IS a diamond cartel that controls the supply of diamonds, and thus the price, on the market by buying up excess supply. There are farm commodities that are sold under the control of marketing organizations that control supply, and thus control price. THAT sort of price control WORKS. Such organizations are invariably dependent on the long arm of government for their very existence. Otherwise, they wouldn’t last very long at all.
OPEC at one time was a creditable, capable organization that could control the price of oil, by controlling ENOUGH production to put the supply at the level that fetched the desired price.
Saudi Arabia at one time could produce enough EXTRA ,at least temporarily, to flood the market,and drive the price of oil DOWN. I am not sure they have that much spare capacity any more, but the Saudis could sure as hell drive the price UP by cutting production a few million barrels a day, assuming the rest of the producers don’t have spare capacity enough to replace such a hypothetical Saudi cut.
CONTROL, CONTROL , CONTROL.
You simply cannot control the price of a commodity unless you control the supply and distribution of that commodity. You can maybe force the price up or down a little,for a while, but in the end, supply and demand determine price.
OFM,
From the previous Ron’s post discussion:
http://peakoilbarrel.com/oil-price-and-its-effect-on-production/#comment-561326
http://peakoilbarrel.com/oil-price-and-its-effect-on-production/#comment-561368
This article is a little on the long side, for those of us who are into sound bites, but folks with more patience will find it illuminating, and maybe even find a little something in it to improve their personal morale, if they are feeling really down about the future.
http://www.scientificamerican.com/article/world-s-richest-man-picks-energy-miracles/
A note on “OMG Cushing is filling up hysteria” or negative correlation of oil price with Cushing recently discovered by Art Berman:
That’s what happens when good people get into bad company due to lack of employment opportunities caused by shale oil price crush 🙂
I wonder whether this is Erik “know everything” Townsend (a retired software entrepreneur turned hedge fund manager; see http://www.macrovoices.com/podcasts/MacroVoices-2016-02-25-Art-Berman.mp3) or somebody else 😉
Compare with
http://peakoil.com/consumption/httpwww-zerohedge-comnews2016-02-26theres-feeling-bits-ice-cracking-all-once-big-new-threat-oil-prices
rockman on Sat, 27th Feb 2016 7:56 am
rockman on Sat, 27th Feb 2016 9:39 am
I forgot to insert the word “inversely” between cushing storage and oil price, in my comment, but the correlation is perfectly obvious.. The correlation between Brent and WTI is also close and obvious, not inverse.
Now it is ancient and undisputed day to day common place knowledge that commodity prices are generally quoted in terms of some “benchmark ” or another, which is used in day to day communications about the market to indicate prices.
When local farmers in my neighborhood sell their corn, the price is virtually always a little higher than the price you see quoted on the commodities market news for corn. This is because my area is a net corn importing area, and shipping is not free. So local growers get a premium- which is REMARKABLY CONSTANT, on average in relation to the going market price. Oil prices are reported, and understood, to be much the same. Oil is “benchmarked” at Cushing, and the price will be up or down elsewhere from that price, due to day to day commercial realities.
Shortages and surpluses can happen in given areas, so prices do not necessarily track the benchmark consistently as a result. Oil can be bottlenecked in some places, and due to lack of transportation capacity, sell for a LOT less than it ought to, locally. It can be in short supply in another place, and sell for more than it ought to, due to transportation bottlenecks.
But as a general thing, the price at any given location usually follows the benchmark up, or down, consistently, as the price changes. This is because there is a relatively free market in oil, and in most places the transportation infrastructure is adequate.
It is not necesary that most of the storage capacity actually be in Cushing. The industry could use the price of the same grades of oil at Houston just as easily, where they would be a little higher, due to more transportation expense getting the oil there.
Prices of a given commodity track together all over the world, so long as trade in that commodity is relatively free, and transportation is readily available.
Now the QUESTION is not whether Cushing is the main and most important storage site for crude, but rather WHAT THE SELLERS OF CRUDE ARE WILLING TO ACCEPT. If they will accept the price at Cushing, then they know just about to the dime how much MORE they could get at a refinery which needs their oil, if that refinery is four hundred miles farther away, assuming crude moves from the Cushing area towards that refinery. A refinery CLOSER that Cushing to producers who would otherwise ship to Cushing ought to be able to negotiate a discount about equal to the saved costs of shipping ,and thus buy a little cheaper than the Cushing price.
Now the fact that we still import oil is well known to us all, and Rockman has forgotten more about oil I could ever hope to learn, but the fact remains- BUYERS DON’T pay any more than they have to, and so long as producers are willing to sell for thirty bucks quoted at Cushing, the price won’t go up. A lot of those producers might be getting only twenty five, after paying five bucks shipping costs.Some others, closer to the refineries than Cushing, ought to be getting a little more than the quoted Cushing price.
Whatever the price may be, it will go up if and when , and only if and when, producers stop delivering all the oil buyers want oil at that price .
I believe Rockman will agree with this bold (pun intended ) statement.
The fact that overseas producers are willing to deliver at this price doesn’t change the calculus.The fact that we are net oil importers does not change the calculus.
And so far as the word “glut” is concerned, it is an emotionally loaded code word, which has no place in a serious discussion of economic theory . The word does not appear in any of my standard economic texts in the chapters devoted to production, consumption, and price in competitive commodity markets. A professional economist writing a text says something along these lines.
” When producers of a given commodity that has been selling at a given price increase production, the price can be expected to fall. If the commodity is one that displays extreme price inelasticity , such as OIL, then a relatively small increase in production can be expected to result in a substantially lower price. Conversely, a modest decrease in production can be expected to result in a substantially higher price. ”
It is understood that everything else is held equal, if not always so stated, in these “snapshot” descriptions of market behavior. When the discussion switches to consumption, the same pattern holds. If the commodity is one that is highly demand inelastic, then a small drop in consumption results in a large drop in price. A slight increase in demand , with production held equal, results in a large increase in price.
When the quantity of oil delivered to market starts falling off, at any given price, the price will GO UP soon afterward, every thing else held equal. Of course the price might also go up with the same quantity being delivered, due to demand picking up, and more buyers bidding for the same barrels of oil.
Ron said it well, and in only a few words.Producers do not set the price of oil, but their (aggregate ) production does determine the price of oil. ( everything else held the same )
New clean energy deals were widely expected to stall last year as the price of oil and other fossil fuels declined around the world. Instead, growth in the clean energy sector beat expectations, delivering the best year yet with a record US$367 billion invested globally in clean energy.
That’s one of the surprising trends identified in A Year for the Record Books, the latest report in Clean Energy Canada’s annual Tracking the Energy Revolution series, which identifies clean energy market trends globally and in Canada.
The report also highlights other significant developments in 2015:
– Canada experienced a 46 per cent decline in investment —from US$7.4 to US$4.0 billion—compared to 2014. Canada ranked eighth in global investment.
– The top-five destinations for clean energy investment dollars were China (US$110.5 billion), the United States (US$56 billion), Japan (US$46 billion), the United Kingdom (US$23.4 billion), and India (US$10.9 billion).
http://blueandgreentomorrow.com/2016/02/29/clean-energy-investment-soared-in-2015-despite-fossil-fuel-crash-analysis/
– More money was invested in renewable power (US$367 billion) than in new power from fossil fuels (US$253 billion)
http://www.rrc.state.tx.us/oil-gas/research-and-statistics/production-data/texas-monthly-oil-gas-production/
Texas goes from 399,315,095 barrels in one year of production in 2009 all the way to 1,161,024,209 barrels in 2015.
Looks close to a tripling of production from 2009 to 2015. Gotta go for the gusto.
Must be contributing to the ‘glut’, in other words, ‘we have to refine this oil into all of the diesel fuel we can and get it shipped to Europe as fast as we can, that’s where the money is’. Gotta follow the money, that’s where the money is. It’s a no brainer.
Or some such verbiage.
Or, refinery ‘glut’. The gasoline can be sold at a bargain price, those crazy Europeans buy diesel at any price, they could care less about that gasoline. har
Europeans pay through the nose for diesel fuel only to subsidize low gasoline prices for US consumers! double har, so har again.
Had Texas maintained production at 400,000,000 barrels per year, the price would have stabilized to a higher low. A 700,000,000 barrel per year drop in production would be steep.
400,000,000 barrels per year at 75 usd per barrel is 30,000,000,000 dollars.
1.161,024,209 times 25 dollars per barrel is 29,025,600,000 dollars.
Just too much oil production in Texas by two times. Texas at a 1.3 million barrel per day production level might bring back 75 dollar oil.
dclonghorn, and anyone else interested.
California Resources Corporation released earnings today. They disclosed they plan to neither drill nor complete a well in 2016. They stated that they believe their base decline rate to be 10-15%. They produced 102K barrels in Q4 2015. That is their net. I think gross they produce about 20% of oil produced in California.
Interestingly, Denbury Resources, who has operations in different area, but like CRC, has primarily secondary and tertiary recovery, but of different kinds (CO2 v steamflood being the major one) is forecasting 10-15% reduction in production from 2015. Again, forecasting minimal to zero new wells.
Of course, decline is different than shutting in production.
I’d say this crash will pretty well end much hope of conventional onshore in US regaining 2014 levels. Added to the inevitable future declines in GOM, US onshore LTO will have to carry the day.
Highlights:
At current prices, CRC expects that available liquidity plus expected operating cash flows will be sufficient to fund its capital program and 2016 commitments.
The Company recently received 100% approval from its bank group to amend its credit facilities
The amendment requires cash in excess of $150 million be applied to repay outstanding revolving loans, reduces the revolving commitments to $1.6 billion and imposes certain other restrictions.
“Expect to see us(CRC) demonstrate financial discipline to maintain sufficient liquidity through 2016. We plan to continue building economically viable drilling inventory, while managing our activity consistent with our principle of living within cash flow.”
Capital investment was $401 million in 2015 Vs. 2016 capital investment plan of $50 million
Approximately 30% of 2016 crude oil production hedged in excess of $50 per barrel
I hope CRC makes it. I think they unfairly got stuck with too much debt and are a victim of the shale bubble.
I am not critical of CRC, just pointing out what they say their base decline is with no new wells.
For personal reasons, I hope CRC makes it also. I would say their more of a victim of market conditions and economic prices swings.
After a second listen of yesterdays conference call and review of 10-K, CRC make it clear that they can survive 2016 with an average price of $28 Brent. Clearly many were putting CRC in a coffin at $.30 a share last week. It also seemed the banks are working closely with CRC to survive this current down turn. It must be in the best interest of the banks for CRC to be the managers of the assets.
If you owe the bank a little money, the bank owns you. If you owe the bank a lot of money, you own the bank.
I think CRC did a good job yesterday of clearing up the uncertainty of the near future. Which shows in todays trading price.
Just so it is clear, this “Todd” is not Todd of TOD.
“Old Todd” use to be “New Todd”, until New Todd started posting as Todd. Now Todd is “Old Todd” if any of you care.
RIP “Old Todd”
Just so we are all clear:
I have been posting on the POB as Todd since it’s inception. It is inappropriate to use someone else’s name as was the case here. Further, since I was a very frequent poster and had a couple of articles on The Oil Drum as Todd, I don’t want someone using my “name” such that there is confusion both here and there (archives).
I hope New Todd continues using that name.
Thanks,
Todd
“Todd, I love you man but you need to take things a little less seriously and just roll with the tide.”
Darwinian on August 10, 2010
Old BAU- can I quote you on that support piece you posted for Trump on the New BAU site?
Pseudo-Hickory
Hickory, let me help you:
Donald Trump has a narcissistic personality disorder in which a person is excessively preoccupied with personal adequacy, power, prestige and vanity, mentally unable to see the destructive damage they are causing to themselves and often others.
Symptoms of this disorder:
1. Has a grandiose sense of self-importance (e.g., exaggerates achievements and talents, expects to be recognized as superior without commensurate achievements).
2. Is preoccupied with fantasies of unlimited success, power, brilliance, beauty, or ideal love.
3. Believes that he or she is “special” and unique and can only be understood by, or should associate with, other special or high-status people (or institutions).
4. Requires excessive admiration.
5. Has a sense of entitlement, i.e., unreasonable expectations of especially favorable treatment or automatic compliance with his or her expectations.
6. Is inter-personally exploitative, i.e., takes advantage of others to achieve his or her own ends.
7. Lacks empathy: is unwilling to recognize or identify with the feelings and needs of others.
8. Is often envious of others or believes that others are envious of him or her.
9. Shows arrogant, haughty behaviors or attitudes.
I will be voting for HRC
Thank you
Okay, which Todd is the conspiracy theorist Todd that believes in “Chemtrails”. That is, the belief that all commercial and perhaps even military jets are putting chemicals into the atmosphere to… to … well I am not sure what they are doing it for but conspiracy theorist say it is a giant conspiracy to poison the atmosphere for some reason or the other.
Well, I am not at all sure what the fuck they believe except chemtrails ae real and it is a conspiracy by… someone or the other.
That would be me 🙂
Your Republican Brother-In-Law Bullshit Todd
Old Todd, have you ever heard the phase “if you don’t use it you lose it theory” ?
Regardless of our age, we would all love to have a thriving sex life. Men and women reach their sexual peaks between their late teens and early 20s, before it slowly starts to decline with age. Typically, sex is a sign of health, but if we stop having it on the regular, can we really lose it if we don’t use it?
The short answer is “yes.”
Sex is like a muscle; if you don’t exercise it, it’s gone. As April Masini, relationship expert and author, explains, the incidence and frequency of sex revives our sexual health.
Erections are key when it comes to preserving male sexual function. A 2008 study published in the American Journal of Medicine found men who reported having sexual intercourse once a week were half as likely to develop erectile dysfunction (ED) as men who had sex less frequently.
http://www.medicaldaily.com/use-it-or-lose-it-how-age-hormones-and-masturbation-predict-sexual-health-329366
To be very clear, this is the Todd of TOD, January 18, 2009:
I am very negative about the future.
I believe there will be a rapid collapse, although I prefer the term “devolution” or “cascading defaults”, within the next few years. Probably, in 2-5 years.
I don’t live my life based upon what other people think.
I cut the wood on our property.
I have a 32”, a 24” and 2-16” ones. Then I have 2-16” and a 6” electric chainsaws that I could run off the PV system or the gas generator.
And, naturally, I also have an assortment of wedges and splitting mauls.
http://campfire.theoildrum.com/node/4979
Please don’t confuse Old Backwoods Todd with New Wall Street Todd. Not that any of you who remember Old Todd would. In addition, Old Todd seems like he does care about what others think of him. So with that in mind, New Todd is going to retire his Todd screen name and doesn’t want to be confused with Old Todd.
Peace Todd
I am confused. Perhaps Todd should use his last name or call himself TOD Todd. or we could have todd1 todd2 todd3?
Hi Dennis,
Well, this has certainly been interesting. But, we all have better things to do so it’s time to let this all go down the memory hole. If I hadn’t posted on POB with that name early on, I wouldn’t have responded at all and used a different “name” were I to start to post now. Since I hardly ever post here I’ll worry about it later.
FWIW, my paternal grandmother asked that I be given that name to honor Robert Todd Lincoln because one of our family members had been his law partner. At the time, there were no other “Todd”s (this is going back over 70 years). I spent most of my life saying that, “No, Todd isn’t a nickname.”
Life is interesting.
Peace,
Todd
“we all have better things to do”
Really Todd ? What “better thing” do you have to do ? Please tell us. You even said yourself, “this has certainly been interesting”. You got off a few comments and saved your screen name. You got what you wanted. Now come back to the party and enjoy yourself. Your even the guy who ran a weekly email news letter for a while. I know you can do it. Now it’s time to get off again regularly. Pardon the pun.
And remember, if you don’t use it. You lose it.
A new post from Matt
http://crudeoilpeak.info/peak-oil-in-the-south-china-sea-part-1
Excellent info Matt!
If anyone has been thinking coal use is on the way down, have a look at figure 13.
The iea projects the southeast ‘asean’ countries to nearly triple there coal use over the next 25 years.
This doesn’t include india and china, but they are on similar trajectories.
Hi Hickory,
Coal consumption from 2015 BP Statistical Review for China+ India. Looks like a an S shaped curve to me (logistic possibly or high order hyperbolic). Bottom line the rate of increase has been slowing since 2007 (if not for the GFC and recovery) or since 2011.
Yeh, hopefully its topping out, rather than just pausing.
I was making the point earlier that it is premature to be dancing around the grave of coal since the consumption has gone up by about 1/3rd in the past 10-12 years.
Also, if the world, or significant portions of it, slip further into poverty- well,
poor people will burn coal rather than simply disappear. That holds true whether they are in Kolkata, Kiev, Detroit, or Vladivostok.
The best cure for coal is prosperity.
I agree. Though coal will become more expensive as it peaks so other forms of energy (like natural gas and renewables) will replace it.
1/2 My usual end of the month comparison b/t the latest EIA Texas data and my corrected RRC data: #crude+#condensate
2/2 My usual end of the month comparison b/t the latest EIA Texas data and my corrected RRC data: #naturalgas (I have the impression that EIA underestimates a bit Texas production data)
Thanks Dean,
“I have the impression that EIA underestimates a bit Texas production data”
Therefore they are revising upward their previous estimates.
Thus, Texas oil production estimate for November released yesterday was 4 kb/d higher than the previous estimate. The estimate for October is 6 kb/d higher than the estimate released at the end of January and 13 kb/d higher than the estimate made at the end of December.
What is the difference between the EIA’s current estimate for December and your corrected estimate?
Hi Alex
here are the latest data:
Dean EIA
Jan 2015 3406801 3373000
Feb 2015 3500731 3462000
Mar 2015 3599070 3644000
Apr 2015 3543403 3589000
May 2015 3467772 3524000
Jun 2015 3430518 3460000
Jul 2015 3438749 3452000
Aug 2015 3408019 3413000
Sep 2015 3423941 3415000
Oct 2015 3421529 3404000
Nov 2015 3432135 3405000
Dec 2015 3439111 3340000
Thanks, Dean
almost 100 kb/d. That’s big!
Thanks Dean,
Nice job as always. One question: now that the RRC is less busy because of the slowdown in drilling, and they started to use an electronic system for producers to submit production info, is there already any evidence that supports adjusting (reducing) the correction factors?
Thanks, Enno. As for the correcting factors, their time evolution is reported below:
https://pbs.twimg.com/media/Ccc2LsjWAAAPhdP.jpg:large
as you see, they have not shown any particular change in their behavior recently and have remained stationary. This is why I can (still) use their simple average as a simple robust proxy of the the real correcting factors needed to correct the original Texas RRC data
P.S. Unfortunately, after two posts on POB, the system does not allow me to post additional images, this is why I had to use an external link
Thanks Dean, that’s very helpful. I’m also busy with the Texas data now, and this helps me to better understand the accuracy of the data. I’m very curious to see these factors evolving in the coming months, as I would expect them to go down over time due to the 2 reasons stated above.
Thanks for highlighting this issue. I will definitely post also the evolution over time of the correcting factors: if I will note that a structural break is taking place, I will definitely have to change my methodology to accommodate for it .
Reuters’ summary of U.S. shale companies production guidance for 2016.
Note that this is oil & gas production in boe.
I guess that the decline in oil production will be steeper.
Factbox: U.S. shale firms see 5.6 percent decline in 2016 oil, gas output
Tue Mar 1, 2016
http://www.reuters.com/article/us-usa-oil-forecasts-factbox-idUSKCN0W33GT?mod=related&channelName=globalEnergyNews
For the first time in two years, U.S. oil companies are beginning to forecast stagnating, or even lower, production. Still, their forecasts are less severe than most estimates.
According to a Reuters analysis, based on forecasts from 18 shale oil-oriented firms released over the past several weeks, oil and gas output is expected to fall 300,000 barrels or equivalent per day (boepd) this year, which equates to a 5.6 percent decline from 2015.
The U.S. Energy Information Administration expects overall U.S. crude oil production to decrease by 700,000 barrels per day, or 7.5 percent from 2015 levels.
Not accounting for production from Alaska and the Gulf of Mexico, EIA expects overall production to fall nearly 11 percent.
Reuters calculations show that production is expected to decline by about 6 percent if eight of the 18 companies that have operations outside the shale patch are excluded.
Only two of the 18 firms analyzed by Reuters expect to produce more in 2016. This is in sharp contrast to last year, when increased efficiencies and lower service costs helped companies ramp up output even at lower levels of spending.
Production at the same companies rose nearly 10 percent on average in 2015, after factoring in a fall in output at 7 companies.
Below is a compilation of the 18 companies’ production forecasts for the year.
All figures are Reuters estimates or calculations based on company data. Midpoints were used in cases where company disclosed a forecast range. Most companies forecast percentage change for 2016; Reuters calculated 2016 output estimates based on reported 2015 data.
Additional details from Reuters:
http://www.reuters.com/article/us-usa-oil-production-analysis-idUSKCN0W33GR
Apache Corp (APA.N) would “rather leave those barrels in the ground” and wait for prices to rebound than finish the fracking process, Chief Executive John Christmann said last week. Apache expects production, nearly two-thirds of which is onshore in North America, to fall by 7 to 11 percent.
Yet the overall declines may still appear unusually shallow given the scale of spending cuts.
Many producers are still managing to coax ever-more oil from each new well, tempering the reversal in production even with only 400 drilling rigs deployed nationwide, one-quarter of the peak of 2014, according to Baker Hughes data.
EOG Resources Inc (EOG.N) expects to boost output from new wells in the first four months by 50 percent for each foot it drills, chairman and CEO Bill Thomas told analysts on Friday. EOG expects its oil production to dip by only about 7.6 percent this year.
“The resilience (of U.S. shale) has been extraordinary, a tribute to technical expertise,” Neil Atkinson, head of the International Energy Agency’s benchmark Oil Market Report, said last week. The agency expects U.S. production to rebound to record highs within just a few years. “Anyone who believes the U.S. revolution has stalled should think again.”
Until this year, energy firms have been able to sustain output thanks to increased efficiencies and more targeted drilling. In December, shale powerhouse North Dakota pumped some 1.15 million barrels per day, barely 2 percent below its April 2015 peak.
Now, the “precipitous” fall in rig count is beginning to outpace efficiency gains, said Brian Kessens, Portfolio Manager at Tortoise Capital Advisors. The anticipated declines show that there is a limit to how much companies can squeeze out of their oilfields without drilling and completing new wells.
Whiting Petroleum (WLL.N), the biggest producer in North Dakota, last week forecast its output would drop by over 18 percent, the most among the surveyed firms, as it set out to cut well completions and slash its capital budget by 80 percent.
The only driller to anticipate an increase this year, Pioneer Natural Resources (PXD.N), can do so largely because of its most extensive hedging among shale firms. Concho Resources (CXO.N) and Halcon Resources Corp (HK.N), which have also hedged substantial parts of their production, both see output slipping by less than 5 percent.
All in all, output data so far and forecasts suggest this year’s declines will be relatively modest, raising questions whether the retreat will be deep and long enough to support a sustained recovery in oil prices.
“Non-OPEC supply needs to fall more broadly before the market gets rebalanced and prices recover in a durable way,” Raymond James analyst Pavel Molchanov said.
While individual company forecasts offer the clearest view of supply from those closest to the oil wells, in sum they are a less than perfect gauge.
The companies in the survey represent only a portion of U.S. crude production, which reached a near record of 10 million bpd last year, and most offer no separate forecasts for crude oil, natural gas or other related liquids. Privately-held companies, which do not report forecasts, may get hit harder.
Projections from the half-dozen larger firms in the group are bolstered by other large overseas or offshore non-shale projects, which often produce crude for years without the need for new wells.
Marathon Oil Corp (MRO.N), for instance, sees a 6-8 percent decline in overall output, but warned its big shale plays in the Bakken, Eagle Ford and SCOOP areas would drop by the “low teens”.
Occidental expects a 2-4 percent rise this year as overseas projects offset a “slight” decline from domestic wells.
Yet its oil-rich Permian Basin shale properties, source of one-sixth of its output, are still expected to pump more this year – even as it cuts back to only two to four rigs.
BTW, the IEA expects US LTO production to decline by 600 kb/d in 2016 and 200 kb/d in 2017.
They project an increase of 1.5 mb/d in 2018-2021
Total U.S. C+C production is expected to increase by 1.3 mb/d between 2015 and 2021, despite a decline in 2016-17.
source: IEA Medium-Term Oil Market Report
Hi AlexS,
Unless oil prices rise to $80/b or more by 2018, I don’t expect the IEA forecast will be correct. I do not know what oil prices will be in 2018, but I believe you think $80/b in 2018 is a little too optimistic. If oil prices get back to $75/b we might see LTO output levels get back to the April 2015 peak by 2020. Permian and Eagle Ford output have been pretty resilient so far so I may be too pessimistic.
The IEA expects $80 by 2020
Alex,
The IEA expects $80 by 2020
All this idiotism with drilling while having negative cash flow will eventually stop.
And unless supply of “free money” is somehow restored it can be resumed only when the price go above approximately $80 per bbl. Because for non-crazy investors this is a real, not MSM fantasy land break even point for shale producers if you calculate all the costs (and they are not static: the higher oil price is, the higher the costs). OK, +- $10 depending on the area.
Think about it as “shale conundrum” or Catch 22 situation. Price zone $30-$79 for shale now is like winter camp on iceberg for the crew of the ship which went under crushed by Arctic ice. Rescue is very uncertain.
And about the value of EIA price “forecasts” of three and four (2020-2016=4) years ago ( AEO 2012 and AEO2013). Are they really worth electrons with which they are painted on our screens ?
The $80/b price (at minimum) by 2020 seems reasonable, if output is low (2015 level or less) prices may be higher than this, if output is higher (82 Mb/d average C+C output in 2020) oil prices might remain under $75/b, it depends on oil demand which depends upon the state of the World economy.
If average World real GDP growth from 2016 to 2020 averages 2%/year or more, and the rate of oil use per unit of GDP growth follows the 1997 to 2014 trend there will be plenty of oil demand (4.5 Mboe/d higher in 2020 than in 2015).
Oil supply shortages are more likely to be an issue by 2020 than lack of demand. This implies that oil prices are likely to be higher rather than lower, even $100/b (or more) is a distinct possibility unless oil supply is far more resilient than I imagine.
What about this? 😉
Hi Verwimp,
If oil prices remain $30/b until 2020, that scenario might be correct.
If there is a Great Depression that starts in 2016 and continues until 2020, that might do it. There are those that believe that is a likely scenario, I think we may see another Global Financial crisis, but cannot predict when it will occur.
We might see a Global Political Crisis next time.
Hi Verwimp,
Anything is possible, I just don’t think that likely until 2030 maybe when peak fossil fuels becomes evident to most.
Do you expect a Global political crisis similar in magnitude to 1930 to 1945 in the next 10 years?
If yes, what is your estimate of the likelihood of that happening before 2025?
I read that CLR will return to activity if prices reach $45. At least that is the headline.
Assuming 200K gross barrels of oil from a CLR Bakken well in 60 months, 160K net with 20% royalty, with a $7 discount to WTI, per CLR recent 10K, such a well will only gross $6 million dollars in 60 months.
So after 60 months CLR will still be over $1 million short of reaching the cost of the well, BEFORE, considering 10% severance tax, OPEX, G & A and interest. Also, none of the land acquisition, permitting , seismic, etc is considered.
Why do the MSM ignore this. It seems so elementary to me.
Bakken LTO needs $80 WTI, minimum, to be a good investment. Just do my 5th grade math. Don’t need any exotic presentations to figure this out.
SS,
Don’t pay attention to headline. They are just part of deception game. Shale production is adjusting, US on shore is adjusting. Today I have briefly scanned that Russian paper is stating that Russian big oil have a meeting today where among the topics are “freeze” (previously discussed with Saudis, Qataris) and even some possible cuts. Pieces are coming together although it looks like at snail pace from the perspective of someone like you that is caught in this bullshit politics. But it is coming.
Ves,
Don’t pay attention to headline. They are just part of deception game.
This is not typical business as usual and a regular level of MSM deception with corrupt jornos bought by powerful interests. This is something more then that. The level of cheerleading of low oil prices is really deafening. Elementary logic is ignored in most such articles. Which makes them pure propaganda. which looks a lot like war propaganda to me. Guided by the same principles:
and
Pieces are coming together although it looks like at snail pace from the perspective of someone like you that is caught in this bullshit politics. But it is coming.
I also hope so. But it looks like there are powerful forces behind the current drop. And they will not give up easily.
likbez,
I agree that narrative “everyday oil price forever” is getting deafening. But as Mr Juncker, former EU comish said during Greek bailout saga “When it gets tough, you have to lie” 🙂
Thinking along the lines that Shale companies would retire their loans would fall into narrative of thinking that Greeks are going to pay off their debt or that US student loans would be paid off. These are mathematically impossible things to do. So if these are impossible things to do why everyone is constantly circling to prove something that is mathematically impossible to do?
ShallowS,
Bakken LTO needs $80 WTI, minimum, to be a good investment. Just do my 5th grade math. Don’t need any exotic presentations to figure this out.
Exactly!
Bakken oil production is more like mining coal than it is drilling for oil (“Red Queen effect”). All company operating in this areas have crushing debt levels. Obtaining revolving credit line when prices are below $80 might become very difficult as Bakken has the highest marginal cost of production. So this slump will last longer for Bakken then for other plays.
Also “carpet bombing” drilling is new and might have some additional effects that we now can’t predict. I would give three years on restoring investor confidence.
Thanks Shallow for digging thru these filings and Uncovering what should be clear !
Fernando posted this yearly cash flow matrix ROI for the Powerwall which shows that Energy stored via Electro-Chem can not compete yet with the Delta of baseline vs peak power rates. When I point this out to people this they think I’m clueless. Anyway – Need something like this for wells in different plays or companies to point out the Insanity. Perhaps I missed it or i’m actually clueless.
Longtimber.
What format would make it most simple in your opinion?
I harp on present value of future cash flows because the SEC requires companies to disclose this annually. Admittedly, that approach does not seem to get much traction. I have never seen any business reporter write a story about long term debt to PV10, despite PV10 being a common metric used in the industry.
I have also taken Enno Peters production information plus cost information put out by the companies themselves to show 60 month undiscounted well economics. To me it is easy to understand, but again, I see no one really give that much attention.
I would note, I haven’t had anyone refute either method, the retort is usually,
“Shallow, you are ignoring advances, such as EOG’s Riverview well.”, or something similar.
I’m open to suggestions. Maybe the fact that companies are reporting record losses is enough??
PV10 is what we have to work with, matter of getting the Data to speak.
Now seems like a horse race across a mile wide river with some over exposed in specific plays. Simple Matrix of Cash Flows over well life is a Story with Assumptions block tells much.
This was posted upstream, and covers the “Bottom of the Barrel” Club.
http://seekingalpha.com/article/3896416-e-and-p-bottom-barrel-club-16minus-2-tanks-nothin
It would be instructive to look at where Tesla is focusing their marketing efforts for the Powerwall, Australia, Hawaii and Germany, all jurisdictions where economics and/or regulations/incentives make the economic case far different than that of the lower 48. My bet is that they will continue to focus on these areas and maybe add some areas in the Caribbean (Puerto Rico, Dominican Republic, Jamaica) that have electricity prices similar to those in Hawaii. They don’t seem particularly interested in the lower 48, except for California, probably because they’ve run the numbers.
Three Big Shale Plays Decline Rate Going To a More Than One Million Barrels A Day!
Using Ron Patterson’s updated rig counts per play, I used that data along with production data from the EIA Productivity Report to calculate the expected overall decline rate per play.
All data is per month.
The Bakken has 36 rig running, and has a “New Well Production Per a rig” of 725 barrels per day, and a decline rate (“Legacy Production Change) of 58,000 b/d.
New production (rig times rate) is 26,000 b/d so the net decline rate (new – decline rate) is 32,000 b/d
Doing the same calculation for the Eagle Ford
Rig = 41
Production per rig = 800
Baseline Decline rate = 110,000
Net decline rate = 77,000’b/d per month
Permian
Rigs = 162
Production per rig = 425
Baseline decline rate = 83,000 b/d
Net decline rate = 14,000 b/d per month
Adding the net decline rate for the three plays we have an overall decline rate of 123,000’barrels a day per month.
That comes out to a yearly rate of 1.47 million barrels a day.
We are not at that rate today as it takes time for dropping a rig to effect production rates. I would expect to see thus overall rate by some time this summer. It is much larger than anyone is expecting.
You need to account for DUCs, the rig count used by the EIA’s DPR does not account for DUCs.
Also as fewer wells are drilled the legacy decline falls, don’t assume it remains constant, you will overestimate the decline rate if you do so. The LTO annual decline rate is not likely to be over 20% in 2016, so about 800 kb/d decline for all US LTO.
The LTO annual decline rate is not likely to be over 20% in 2016,
Dennis, it should be obvious that as completions decline and production declines that the legacy decline rate will decline also. However 20% per year seems totally illogical. Way out of any kind of reason.
The EIA’s DPR, which previously had legacy decline rates too high, has now brought them back into reason. I think they are now fairly accurate. Their per month legacy decline rates for March:
Permian 4%
Bakken 5.3%
Eagle Ford 9%
Just for the Permian that’s a 40% per year, for the Bakken about 50% and for Eagle Ford 70%. Now I realize they will not actually be that high because the legacy decline rates are falling, but…. 20% is beyond all reason.
Hi Ron,
The 20% estimate is not legacy decline it is total decline for the LTO output in the US. I doubt that there will be no well completions in the LTO plays in 2016.
Also note that LTO output has already started to fall through Dec 2015 (from the peak in April 2015). The 20% decline does not include the decline in output that has already occurred it is an estimate of the fall in output from Jan 2016 to Dec 2016. If average LTO output was 4 Mb/d in Dec 2015, I am estimating that output will be about 20% lower in Dec 2016 (or 800 kb/d lower) because there will be some wells completed in 2016. The likely range of the LTO output decline is 600 kb/d to 1000 kb/d and will depend on many factors including the oil price and the state of the economy (both of which are difficult to predict.)
Oh, sorry I just imagined you were talking about legacy decline. I will try to pay more attention in the future. Sorry. 🙁
A 20% decline in that scenario seems entirely reasonable.
Hi Ron,
I am often not clear, so no problem, I was looking back at an earlier comment and I would say this might vary between 15% and 25% based on a quick look at the Bakken and assuming that applies to other LTO plays (which isn’t necessarily true.)
If you and I agree it must be right 😉
Re rate of climate change
http://harvardmagazine.com/2016/03/science-of-history
“Climate change occurred much more swiftly than I had thought possible. ‘
I didn’t really think there was much doubt over the speed the climate can change. think about it, the sun came up this morning and the temperature increased. It will go down tonight, and the temperature will decrease. What this shows of course is how earth’s climate is always changing, whether or not over the course of a day, a century or 1,000 years or more. The real questions are how much man could be influencing any kind of background processes to any major degree and if so whether that justifies drastically altering any of our behaviors or cherished ways of life to the extent that we could end up ruining our livelihoods and small businesses. Now as for the impacts of climate change, I have to just think that we all impact climate change. I mean that about myself as well, for instance I’ve seen explained on science programs on TV how the heat my body produces impacts the earth’s overall temperature to about the same degree as when I jump I microscopically pull the earth towards me due to my mass. What I wish is the global warming researchers could acknowledge all of these facts in all the research & journal articles rather than only repeating the line “climate change is real” as if that alone is a successful strategy to accomplish anything.
The real questions are how much man could be influencing any kind of background processes to any major degree and if so whether that justifies drastically altering any of our behaviors or cherished ways of life to the extent that we could end up ruining our livelihoods and small businesses
And right there, in the creamy middle of that otherwise seemingly innocuous statement lies the essence of why otherwise perfectly rational intelligent people choose to deny reality! They will use every rationalization and excuse possible to pretend that change is not necessary! Unfortunately for them climate change is just one of many factors that are going to force them to change their cherished ways regardless. Just go ask some of the rednecks or truck drivers out in the Dakotas who have recently lost their jobs and can no longer afford their big pickups and toys!
Right! But what gets me is the crazy notion, apparently, that making and buying a super efficient fridge or freezer with all the thermal storage and so on, is in any way ruining our livelihoods more than buying the super wasteful one that we have been buying!
Or, a Leaf instead of that F-150. Gawd!
All we gotta do is put people like me and you, Fred, in charge for just a little while and then everybody is happy, well protected from the winds, and full of real good kelp, or whatever suits.
And every dead dinosaur stays decently buried.
OK, so some rednecks don’t get their bloated pickups. Put’em in the psychobaric chamber and change their heads to adore bamboo bikes.
Airplanes? Nah, vacuum tube trains, over hill and dale and ocean and arctic, while watching virtual reality whiz by at mach 3.
Hm, is there a mach in a vacuum?
And so to bed.
Hm, is there a mach in a vacuum?
Well, given that ‘Mach’ is a unit for measuring the speed of sound in air, I would say technically, No!
If there no air molecules to transmit sound there probably wouldn’t be a sonic boom either. But if we take it to mean only the actual speed then yes.
At standard sea level conditions (corresponding to a temperature of 15 degrees Celsius), the speed of sound is 340.3 m/s (1225 km/h, or 761.2 mph, or 661.5 knots, or 1116 ft/s) in the Earth’s atmosphere. The speed represented by Mach 1 is not a constant; for example, it is mostly dependent on temperature.
Source Wikipedia
Cheers!
I didn’t change my cherished ways, I kept my desire to make the world a better place, and bought efficient things rather than the old inefficient ones.
I now use about 1/4 as much carbon as I did a few years past, and am FAR MORE comfortable. And far more secure. I don’t notice when the grid goes down, as it does far too often in this little backwoods.
And all those nice little businesses are still there.
Well, I did give up flying, but that was long ago and totally unrelated to any sort of holier-than-thou. I was real happy to give up that 5000 miles+gastroenteritis syndrome of my earlier existence.
I didn’t change my cherished ways, I kept my desire to make the world a better place, and bought efficient things rather than the old inefficient ones.
Unfortunately most people who say they don’t want to change their cherished ways mean that they do not want to do what you did. They truly believe that the way they are living right now is just fine. They will give a thousand and one rationalizations why they don’t need to change and failing that, why doing what you have done just doesn’t work!
Be well Wimbi!
The price of a Powerwall or something about equal to it will probably fall by half in five or six years. Then such a battery system will be a decent deal, considering it will keep the fridge running if the power goes off on a hot day, saving maybe a couple of hundred bucks worth of groceries, and that sort of thing.
By then with purchased juice likely up twenty percent or more in nominal money, and the price of that purchased juice likely to continue going up three or four percent a year, a Powerwall or something equivalent to it, and a personal pv system will probably be a good investment based strictly on the dollars and cents aspects of the purchase-IF you can buy it with borrowed money at a very low interest rate.
I think the turn key price of a residential pv system in the USA will fall by half in terms of constant money withing five or six years. We Yankees ought to be able to do it by then for what Germans are doing it for NOW. 😉
You don’t need a Powerwall to keep food frozen. Chest Freezers with 15L of 10% ethanol /water mix and a Small PV system does fine. Let the Freezer coast thru the Night so no Battery is consumed. Large Efficient Thermally loaded chest freezer use less than 1kWh / day. I had them keep contents deep frozen for many days w/o power. Thermal storage is the best Battery. You can get 24V Freezers but they are pricy since they are not mass produced.
Ethanol can separate from the water and give a two-part solid/liquid slush mixture for a wide temperature range that doesn’t optimize the thermal storage at freezer operating temperatures. The optimal freezer thermal storage setup are plastic jugs filled with 32% food-grade propylene glycol/water. Freeze/thaw temperature 5 deg. F. By taking advantage of the latent heat capacity of the mixture to “melt” at the normal operating temperature of a freezer, you’ll realize the full 80 BTU/pound heat-of-fusion isothermal heat absorption potential through the melt-process.
On the plus side for the ethanol/water blend idea, though, you basically can mix up a batch of daiquiris and throw it in there and have a dual-function thermal storage system:)
Using thermal storage as a battery: Here in Redding, California, the local utility will replace your old commercial AC system for free if you let them put an “Ice Bear” on it to shift the AC load to the night time –
http://ice-energy.com/technology/ice-bear-energy-storage-system/
K O O L , In Sports dept of many stores you find all kinds of “ICE” cooler paks in all shapes. Walmart has some sized like 200mm long hot dogs that you can Matrix about the Freezer.
I am a big fan of thermal storage, and have posted about it numerous times as one of the ways we can adapt to using more wind and solar power on the grid.
And I do every thing the cheap way myself, since I don’t have a lot of money.
But the sort of people who buy Powerwalls don’t do much of ANYTHING the hard way. They have money, and are glad to pay for convenience, status, ego satisfaction, etc.
High dollar Powerwall batteries NOW are one of the keys to grid backup batteries later that are cheap enough and durable enough to actually be a good deal on a dollars and cents basis.
My personal belief is that the future of grid juice involves demand pricing and load shedding. A few million Powerwall type batteries scattered across the service area of an electric utility can go a long way towards allowing the utility to shed a late afternoon peak load sufficiently to avoid building or maintaining some coal or gas fired generating capacity, and so subsidizing these batteries makes sense for all of us, since all of us depend on the grid.
And since the heaviest afternoon peak loads occur in hot sunny places, the ac can be kept on with the homeowners own pv system most of the day.
Renewable juice is getting cheaper all the time, and I after studying this matter carefully for a long time, I am now convinced that so long as the current generation BAU lasts another five to ten years, plenty of people will find it advantageous to own their own solar systems, with storage.
There are ways to save money that do not involve actually collecting a subsidy or tax credit, when you do things for yourself. There are PLENTY of people paying thirty percent or MORE of their last few thousand bucks out as INCOME TAXES.
If you generate your own juice, you are for now at least not going to have to pay income tax on it. A hundred fifty buck electricity bill costs a lot of people I know well over two hundred bucks pretax money.
People in this situation can divert however much they save on purchased electricity into a tax free or low tax investment, or they can just spend the monthly savings, after paying off their pv system with batteries.
The amount of money involved might not be very much, from one month to the next, but it adds up over time, and if it is paid toward the cost of the pv system, the system can be paid off years sooner.
The renewables revolution has now progressed to the point that fifty or a hundred dollars a month , either way, can make or break the deal on a pv system on the basis of dollars and cents, if you live in a sunny place, and pay a moderate to high rate for your juice.
Wonder why payoff is all that much of a deal, when most people I know with PV never had a big fraction of their annual cost of living for electricity, any which way it comes.
So, what’s the deal with a small fraction of a small fraction?
I bought my PV because it’s my hobby to do that sorta stuff and I like to brag to my friends.
For business, same. I had a small R&D business for many years. Electricity was not a major fraction of the budget. Salary was the biggest by far, as would be expected for a bunch of prima dollas.
Of course, for places like wallmart, things might be different. That may be why some of them have a huge array on that big flat roof.
Wimbi hits the nail on the head. As least for the current situation.
My electricity bill is always under $50 a month and often down near $30 and I do sometimes use air conditioning.
When I finish my thermal refit of the house, I will add PV. Not for payback (although if you look at the whole economic picture, payback is not even an issue) but to provide power for an EV and backup power to a battery system. Probably more for independence than money savings.
HVACman Is there an advantage of using propylene glycol/water solution over a salt/water solution?
A salt-water mixture at just the right % could work at around nominal 0 deg. F. Because of problems maintaining a uniform % solution, the temperature range that is is “slush” – with both liquid and solids – is pretty wide, so you don’t get as much isothermal heat storage. That doesn’t matter too much for the typical hand-crank ice cream maker, though!
The “sweet spot” for salt/water mixture is about 23% salt. That is the minimum freeze-point – about -5 deg. F.
Fahrenheit used the freezing point of this salt/water mixture as his basis for establishing zero degrees on his scale. But he apparently screwed up his measurement, as he was off a few degrees.
https://van.physics.illinois.edu/qa/listing.php?id=1722
Looks like Russian bear after being hit in the head and robbed at gun point starts slow awakening from hibernation. The honchos of Russian oil companies are now officially onboard for the freeze and some of them want more drastic measures. They have a discussion of “stabilization of Russian economy” (which means stabilization of oil prices) with President Putin, which means that Putin got his marching orders from oil oligarchs, some of which wants “quid pro quo” from the government (not to increase taxes on oil despite budget deficit). Details are scarce. But previously hapless head of Rosneft Igor Sechin lamented about the situation he drove his company into, being completely unprepared to the oil price crush. May be he got promises of additional loans to keep the company afoot.
Generally Russian performance in this crises leaves to me the impression of complete incompetence on high level. Especially unimpressive is Alexander Novak – the Russian Minister of Energy. He speaks like a typical neoliberal. This is when more centralized economy should score points and they instead were taken for the ride and continued to buy the US Treasuries. Why not to buy Russia oil for the strategic reserve instead, like China did ? I think Russia still does not have any state strategic oil reserves (the only major country in such a position).
Russia is ready for the implementation of the freeze of oil production
Slightly edited Google translation
Izvestia.ru
President Vladimir Putin and the heads of major Russian oil companies discussed implementation of decisive measures to stabilize the Russian economy in view of increased volatility of world markets.
As a start Russia is ready to join the group of countries within and outside OPEC, which approved the proposal to freeze the level of production of oil in 2016 at January level. Such production limits can be implemented by a joint agreement of key countries, that is already was put on table on Feb 16, 2016 by Saudis, Russia, Qatar and Venezuela and now is at the stage of multilateral discussion with other oil exporting countries. The final decision is expected somewhere in March on a new meeting of Ministers of oil producing countries.
This meeting at the Kremlin was chaired by Vladimir Putin and was attended by all key representatives of the Russian oil industry — the Chairman of the Board of "LUKOIL" Vagit Alekperov, the General Director "Surgutneftegaz" Vladimir Bogdanov, the head of Board "Gazprom oil" Alexander Dyukov, the President of the company "Bashneft" Alexander Korsik, the General Director of Zarubezhneft Sergey Kudryashov, the head of "Tatneft" Nail Maganov, President of "Rosneft" Igor Sechin, the head of the Independent oil and gas company Eduard Khudainatov.
In addition, the Russian minister of energy Alexander Novak and the head of the presidential administration Sergei Ivanov, as well as aide to President Putin Andrei Belousov also participated in this meeting.
This year Alexander Novak held a series of meetings with Ministers of oil-producing countries. In February, the negotiations in the Qatari capital and it was proposed to fix the production at the level of January. In January, Russia produced 46,006 million metric tons of oil with gas condensate. This is 1.5% more than in January 2015. Average daily production amounted to 10.9 million barrels.
Before the meeting, when everybody was sitting at the table, Vladimir Putin held a short private consultation with Alexander Novak. After that Putin opened the meeting with the following statement:
CEOs of major Russian companies remained silent while journalists were present. Only the General Director "Tatneft" Nail Maganov and Chairman of the Board "Gazprom oil" Alexander Dyukov start grinning, because these companies in January of this year recorded a growth of production relative to January of last year (by 4.2% and 5.6% respectively, according to the Central Department of Control of Fuel and Energy Complex).
After those introductory remarks journalists were asked to leave the meeting.
The meeting did not last long. After the meeting ended, Minister Alexander Novak in a press conference said to journalists that all heads the Russian companies who were present supported this international initiative. He stated that:
Alexander Novak also noted that this freeze may not only reduce price volatility but also shorten the period of depressed oil prices to the end of 2016, when in his opinion oil prices can return to the $50-60 per barrel range. He noted that as of today 15 oil producing countries have publicly declared his readiness to sign the agreement.
According to the Minister, they represent around 73% of world oil production. The exact format of the agreement, in which the key is the method of monitoring of compliance, is yet to be determined.
The sighing of the freeze agreement can happen at another meeting of oil ministers in March. According to Alexander Novak, even if Iran does not join the agreement, the market will still stabilize, as Iran still has a very low level of production and can't increase it fast. Due to this countries-signers of the agreement can make an exception for Iran and increase its ceiling over the January 2016 level.
Freezing production at least will stop flooding the market with new volumes of oil in the delutionary pursuit of “market share”, commented on the event the analyst of FC "Discovery Broker" Andrei Kochetkov. It will more be influenced by the financial strength of companies and countries as well as the real costs of production from the depleting fields. On average, traditional oil wells lose 3-5% of production volume each year, he said. Accordingly, if the flow of new investments in the field slow down to a halt, the global market might lose another 3-4 million barrels per day of the production at the end of the year. This drop even if less drastic as stated will increase the pressure on oil prices said the expert.
There should not be any major problem for Russian companies with freezing the production of oil on January, 2016 level said the head of the analytical company of the Small Letters Vitaly Kryukov. We should not fear that this measure damage our fields, given that in Western Siberia production continues to fall, he said.
That, of course, might lead to less drilling in some places but will not affect the commissioning of new projects that were under construction. For example, LUKOIL is expected to launch new projects this year in the Caspian sea, but at the same time they are quickly losing the volume of production in Western Siberia.
The second topic discussed at the meeting with the President was the taxation of Russian oil companies. The heads of the companies have asked the head of state in the medium term, not to raise taxes and to keep the current system of taxation while the current turmoil with oil prices exist. In his after the meeting interview Alexander Novak stated that Vladimir Putin is now aware about the position of the heads of Russian oil companies on this subject, but this issue still needs to be discussed inside the government.
Bottom line:
Russian oil companies supported Russia’s agreement with Saudi Arabia and some other OPEC countries to freeze ouput at January 2016 (record) levels. There was no talk about output cuts.
January oil production (10.87 mb/d) was 1.8% higher than 2015 average (10.67mb/d).
No significant increase in Russian oil production in 2016 was expected anyway.
So there was nothing particularly important in this meeting.
“Why not to buy Russia oil for the strategic reserve instead, like China did ? I think Russia still does not have any state strategic oil reserves (the only major country in such a position). ”
This is ridiculous. Can you name a major oil exporting country which has strategic oil reserves?
Such reserves are an emergency storage, which is necessary for oil importing countries.
So there was nothing particularly important in this meeting.
I disagree.
Izvestia coverage is very fuzzy. It is even clear what actually was the main topic of the meeting (aka “measures to stabilize the Russian economy”). Was it actually about cuts and freeze was just a formal story presented to journalists? Why Pitin said “some of you have more radical suggestions” at the beginning? Could well be a preparation for the next round of negotiations with OPEC, in which cuts of production are to be discussed (remember earlier Iraq proposal to cut production?)
I agree with you that the freeze itself was a done deal and a “no-brainer” to which everybody in Russian oil agreed even before February 16 announcement.
My impression is that the level of the meeting signify that there was either an important “side” issue (distribution of possible “production cuts” between Russian oil companies), or problems within the Russian state, Russian economy, or some split within Russian oil elite, and Putin was called to help to iron out the compromise.
I doubt that Putin’s idea of spending his time is about attending useless/formal PR meetings with oil oligarchs, some of which he probably despise. Also I heard about some differences between Putin and Sechin, whom Putin implicitly accused of betraying the interests of Russian state in favor of self-enrichment, despite running a state owned oil company. Or at least putting company interests above the interests of Russian state.
Otherwise why this neoliberal Alexander Novak did not just do the same without any Putin involvement if there were no important issues to decide and everyone was on board? Although I doubt that he would manage to get heads of all major oil companies in one room as easily as Putin.
This is ridiculous. Can you name a major oil exporting country which has strategic oil reserves?
I am not an expert in currency trading but is not oil now became yet another convertible currency in which a county can keep part of its foreign reserves? Like Russia does with gold. It provides diversification from dollar with the potential upside.
Why buy dollars at the peak?.
I am not an expert in currency trading but is not oil now became yet another convertible currency in which a county can keep part of its foreign reserves?
I never heard that one before. But no, oil is not a currency and cannot be traded like a currency. Oil is a physical product and must be shipped via pipeline or ship or truck or whatever. Currencies can be traded via wire and converted from one currency to another via wire. (Or more correctly via satellite.) Nothing physical ever changes hands. And it all happens in milliseconds, not in days, weeks or months that it takes to ship oil around the globe.
Alex is right, it makes no sense for a country that produces 10 million barrels of oil a day to have a strategic oil reserve.
Ron Wrote:
“Alex is right, it makes no sense for a country that produces 10 million barrels of oil a day to have a strategic oil reserve.”
It might make sense if you need to take production off-line for maintenance,upgrades or an emergency. Or if you want to temporary cut exports (to move prices up) but not cut production. or if you suddenly wish to temporary increase production (ie another major exporters runs into a problem and you going to pick up the slack until the issue is resolved).
TechGuy,
Russian oil companies have commercial oil inventories. Their current volume is 44 million barrels. There are also inventories of refined products. That’s sufficient in case of emergency or any logistical issues.
Relatively high costs do not justify building and maintaining state-owned strategic storage capacity for an oil-exporting country.
Ultimately, if Russia decides to cut exports in order to support prices, there is no need to shut down producing wells or to put oil in storage facilities. Russian companies may just reduce drilling activity and production will decline. Oil will be stored in its natural reservoir with zero cost.
Currencies can be traded via wire and converted from one currency to another via wire.
Is not situation the same with the oil futures (aka “paper oil”)? Why Russian can’t trade futures backed by reserves and settled, say, in Vladivostok if it needs to convert oil into other currency?
Well, futures are not settled in Vladivostok, they are settled in Cushing. A futures trader cannot just pick the place he would like to make or take delivery from.
But all this misses the point. Russia can convert oil to currency any time it wishes. In fact it does exactly that to the tune of six or seven million barrels per day. Russia doesn’t need to mess with futures and settling up with the clearing house.
WSJ: Ex-Chesapeake Energy CEO Aubrey McClendon Indicted on Antitrust Charges
Justice Department alleges McClendon orchestrated conspiracy not to compete for oil and gas leases
I published a first interactive presentation on the shale oil production in the Eagle Ford.
Enno, Thanks!
Do my eyes deceive me, or is the typical EFS well falling below 100 bopd at month 18 and by month 60 is around 10 bopd?
It is my experience, plus info from an industry veteran conventional producer near Flatonia, that 75% NRI is the norm in the EFS.
EFS appears less economic than Bakken, on average, despite prime location to oil markets.
Shallow,
Thanks.
> or is the typical EFS well falling below 100 bopd at month 18 and by month 60 is around 10 bopd?
That’s correct. The 60 month number may still fluctuate a bit more, as more many wells still have to pass that point. I didn’t correct here for refracking, so all horizontal wells are included.
I don’t have information about well costs. I suspect them to be cheaper on average than in the Bakken.
Hi Enno,
For most Texas wells there are multiple wells on the lease with various starting dates. As far as I can tell it is pretty difficult to determine which wells are producing how much oil the way the RRC reports the data.
How have you dealt with this issue?
In my attempt to do this I either used wells on a single well lease or wells that started producing within two or three months of each other and just assumed each well produced equally in order to estimate a type curve.
Do you have numbers on how many wells were completed each year?
Enno,
Thanks a lot! Excellent presentation.
Just two questions/comments.
1) For Eagle Ford production by county, are you using raw data from the TRRC, or you apply a correcting coefficient?
2) You chart with EFS wells productivity is very similar to the chart below by the EIA. Both charts show relatively modest average well IPs
One difference is that, according to the EIA, IP rates for the wells completed in 2015 is slightly higher than for 2014 wells.
Source: “Initial production rates in tight oil formations continue to rise.” EIA, February 11, 2016
http://www.eia.gov/todayinenergy/detail.cfm?id=24932#
Thanks Alex,
1) Yes, it’s the latest raw TRRC data, without any adjustments.
2) Indeed very interesting to compare that graph with my results. What the EIA seems to be doing (not only for EF, but also clearly for the Niobrara, the Bakken and the Permian) is to include a much larger selection of wells than only the horizontal shale wells. I suspect they take all the wells in the counties of those basins. That explains both the larger total sum of production, and the average lower well productivity. That would then further also explain why their average 2015 well is performing better than 2014: probably because the collapse in vertical wells was more several than horizontal drilling, pushing up the performance of the average well, while actually, based on my results, the average 2015 horizontal well is so far performing a little worse. The difference is especially large for 2014 wells, where I exclude almost all vertical wells and focus only on all leases that have Eagle Ford somewhere in the field name.
Thanks Enno,
The EIA data may also be for a wider geographic area, like in the Drilling Productivity Report, whis has production statistics for the “Eagle Ford region”, “Bakken Region”, etc..
The shift from vertical to horizontal wells is especially important for the Permian.
The shift from vertical to horizontal wells is especially important for the Permian.
Yes, that may be very important but… This past week horizontal rigs declined by 19 while vertical rigs increased by 8. Does that mean anything?
Ron,
If only oil rigs are taken in consideration, last week the number of horizontal rigs dropped by 16 units, directional by 2 units, while vertical rigs increased by 5.
Share of horizontal rigs in total US oil rig count was 79%.
It has been fluctuating within the 78%-80.5% range since early December 2015 and within 74-80% range since January 2015.
So generally, the previously constant increase in the share of horizontal rigs is stalling, albeit not reversing.
That may reflect the fact that drilling activity in the shale sector is now falling at the same rate as in conventional production
The share of horizontal rigs in total US oil rig count
The increase in the share of horizontal rigs in total oil rig count was particularly rapid in the Permian basin.
However since January 22, the horizontal oil rig count there dropped 31 units (-18.6%), while vertical rigs only 2 unit (-7.4%)
Share of horizontal rigs in total Permian basin oil rig count
Thanks Alex, this is very useful background info when analyzing the production in the Permian.
Hi Enno,
Very nice thanks.
You might consider adjusting the overall output by using Dean’s data. Peak C+C output was about 1500 kb/d from the Eagle Ford.
To use Dean’s estimate, find % of Eagle Ford output of total statewide output using RRC data and then multiply by Dean’s estimate. I have his data if you are interested, just shoot me an e-mail.
In Dec 2015 Eagle Ford C+C output was about 1370 kb/d using this method and an estimate of 1090 kb/d for RRC reported C+C output from the Eagle Ford (read off chart at Enno’s blog). Eagle Ford output was about 39.8% of total TX C+C output based on 1090/2736 (eagle Ford C+C divided by statewide TX C+C) in Dec 2015 and Dean’s estimate is 3439 kb/d for TX C+C in Dec 2015.
Thanks Dennis,
Unfortunately I can’t apply a correction factor as Dean did. The reason is that I don’t just look at the grand total of production, but I provide the detailed monthly production numbers on well & lease level. On this level, it would not be correct to apply correction factors in the same manner, as that would overstate many of them, while still understating the ones that will be corrected later. E.g., production for a company that has supplied accurate info until December, would have its production severely overstated after applying the correction.
I think just one of the few things I can do is to exclude months that will still be heavily adjusted, and point people to this issue. I’m also trying to identify if there are some rules to identify leases that will be subject to major revisions (found no rules so far). With feedback from Mike, I have a little hope that the Texas RRC is improving its methods in this regard somewhat, with its new digital submission system. Let’s see if that affects these correction numbers in the coming months.
Hi Enno,
For individual companies and leases the correction factor would not be applied, an adjustment factor for incomplete data would simply be applied for the grand total of output, a correction slice at the top. This is not absolutlely necessary, but you might want to point out to users that the most recent month might be 26% too low (if the Eagle Ford data follows the characteristics of the statewide data.)
How was my 1090 kb/d guess from your chart of total Eagle Ford output in Dec 2015, roughly correct (to 3 significant figures)?
Hi Dennis,
> an adjustment factor for incomplete data would simply be applied for the grand total of output,
That’s not how the presentation works: it calculates everything from the detailed records directly. This is why the filters work so well. The disadvantage is that you can’t do something like you suggest, but I’m okay with that.
I would like a few months working with this data before making a call on how much adjustment should be roughly applied to this set of data. I do note that the magnitude of the decline is quite similar as what the EIA (drilling productivity) has for the EF as a whole. I would also not assume that the correction factors Dean applies to the whole of Texas are suitable for this relatively small subset (in # of wells). The wells in this set are much newer, higher producing, and in hands of bigger companies.
It’s an important issue, and I will come back to it in future updates.
Hi Enno,
I have used the method described in the past to estimate Eagle Ford output.
http://oilpeakclimate.blogspot.com/2015/06/eagle-ford-permian-basin-and-bakken-and.html#more
Jan 2014 about 1150 kb/d
and earlier
http://oilpeakclimate.blogspot.com/2014/05/eagle-ford-output-and-texas-condensate.html
Jan 2014 about 1200 kb/d
So the earlier estimate was a little too high (if the more recent estimate is correct for Jan 2014.
Note that in June 2015 the RRC had RRC C+C output at 1153 kb/d, so you may be leaving some Eagle Ford fields out of your database. There are 16 separate field you need to look at, but most of the output is from:
Eagle Ford 1
Eagle Ford 2
Briscoe Ranch
Sugarkane
Dewitt
Hawkville
Gates Ranch
Giddings
Aguila Vado
Southern Bay
For your data I get a little less than 900 kb/d for Jan 2014 (all counties and all companies). The RRC data in June 2015 for the 10 fields above (listed as being Eagle Ford play by the RRC) has 1153 kb/d (no correction applied) in Jan 2014. For crude only the output was 890 kb/d so perhaps I misunderstand your charts.
Do you report crude plus condensate or crude only?
For anyone interested this was answered in an email by Enno. He reports “oil” as the RRC reports it. This is the same as “crude only”, that is condensate is not included in his Eagle ford production estimates.
The last time I looked closely at Eagle ford data from the RRC (October 2015), about 20% of Eagle Ford C+C output was condensate. This % consensate has been slowly decreasing over time so I do not have an estimate based on the most recent RRC data (it might be higher or lower than 20% for July 2015).
Hi everyone,
The estimate I gave above is wrong. Enno’s data ends in July 2015 not Dec 2015 and there is a question about whether it includes condensate.
So I have no July 2015 estimate based on Enno’s blog, but using Eagle Ford data I gathered in Oct 2015 and Dean’s latest estimate I estimate Eagle Ford C+C output in:
July 2015 was 1437 kb/d
March 2015 was 1593 kb/d
Jan 2015 was 1548 kb/d
Jan 2014 was 1165 kb/d
Jan 2013 was 772 kb/d
Am still maintaining that the demand curve, even with crazy low prices, will be weak, and here’s data that says it’s already happening even before EVs make any kind of dent:
http://www.climatecentral.org/news/gasoline-use-slows-uptick-in-efficiency-20079?utm_content=buffer53463&utm_medium=social&utm_source=twitter.com&utm_campaign=buffer
Hi PatrickR,
For the World the correlation between oil demand and real GDP was linear between 1997 and 2014, perhaps this will change, but I think it unlikely at the World level at $30/b.
Higher oil prices may do it, but I believe it will require $100/b or higher. Much of the OECD puts high taxes on oil, so I may be affected by my US point of view. Much of the increase in demand will come from India and China and their tax policy on oil may be more similar to US policy than the average OECD policy.
The article basically says US demand will be flat for gasoline. The IEA predicts about a 1.2% increase in liquid fuel demand over the next 10 years. I doubt there will be enough oil supply to satisfy this demand forecast and oil prices will rise to $80/b by 2018 and probably to $100/b or more by 2020. Demand may still not be satisfied even at those price levels and there will be some demand destruction as public transportation and EVs and plugin hybrids replace some fuel use.
Dennis I know you’re still heavily committed to a high price scarcity model, but I really think you need to consider oil going the way of coal, and us abandoning it quicker than production rate does us, in the years/decades ahead.
By any measure there’s a great deal of oil available now and in the near future, the biggest issue is our huge rate of consumption. Relatively small changes to the rate of demand can swing price hugely.
Cheap and abundant electricity and actual pricing of pollution externalities would be more than enough to keep marginal barrels in the ground. It would be hard to model, but then models are not good at discontinuities.
Additionally pretty sure you’re wrong about GDP v oil; the oil intensity of OCED countries’ economies has been falling for years, and non-OCED economies have grown hugely on much less oil than th west did earlier. Will have to look for some numbers…
Cheers
Patrick R Wrote:
“Cheap and abundant electricity and actual pricing of pollution externalities would be more than enough to keep marginal barrels in the ground.”
Electricity costs are rising, not declining and will continue to increase until the economy collapses or the grid collapses.
Hi Techguy,
Wind can compete well with natural gas even in the US and the costs of solar are coming down rapidly. In the US real electricity prices have risen from 9.5 cents per kWhr to 10.5 cents per kWhr from 2000 to 2014 in 2015$. In 1990 electricity was almost 12 cents per kWhr (2015$). This was the average price for all electricity customers.
Many solar power purchase agreements are currently about 5 cents per kWhr in the US for utility scale projects, prices have fallen by 70% since 2009.
Cheap and abundant wind and solar might be widespread within 30 years in OECD nations. As costs fall they will become widespread throughout the World.
DC wrote:
“Wind can compete well with natural gas even in the US and the costs of solar are coming down rapidly. In the US real electricity prices have risen from 9.5 cents per kWhr to 10.5 cents per kWhr from 2000 to 2014 in 2015$. In 1990 electricity was almost 12 cents per kWhr (2015$). This was the average price for all electricity customers.”
Wind cannot complete with a Base load Nat Gas Plant. Wind is intermittent, NatGas can continuous deliver steady output 7/24/365, Wind can’t even come close. Wind still only makes up a tiny amount of production.
Calif. Power Rates Go Up 80 Percent
http://abcnews.go.com/US/story?id=93303
Growth in residential electricity prices highest in 6 years
http://www.eia.gov/todayinenergy/detail.cfm?id=20372
[I am sure the coal Plant shutdowns will start impacting prices later this year. Only the collapse in NatGas prices have kept prices low, but sooner or later the cost for NatGas will rise substantial, and forcing Electricity rates up with it]
DC wrote:
“Many solar power purchase agreements are currently about 5 cents per kWhr in the US for utility scale projects, prices have fallen by 70% since 2009.”
These new plants will go down the same path as Shale Drillers: Bankruptcy. These Plants will not deliver on the promises sold to investors. Already some of the Solar Thermal plants are in trouble.
Turns out Ivanpah is really a NatGas Plant masking as Solar plant:
http://www.ocregister.com/articles/plant-688596-gas-energy.html
Solana Solar Plant’s Weak Output
http://www.phoenixnewtimes.com/news/solana-solar-plants-weak-output-will-improve-officials-say-7414760
“In November, New Times reported that the $2 billion Solana solar plant near Gila Bend had produced only two-thirds of its advertised electricity output. Over the weekend, the Wall Street Journal reported that the plant is producing only “half” of the expected output.
DC wrote:
“Cheap and abundant wind and solar might be widespread within 30 years in OECD nations”
I doubt that, 2015 is likely going to be the Peak in Debt Growth. I think gov’ts and energy companies will be force to cut investments in the years ahead in order to service the debt as well as spend more revenue on other issues related to demographics (entitlements, Pensions, etc) of aging populations.
A renewables dominant supply system will not replicate the old thermal one. Baseload as an idea is a product of large thermal plants rather than an absolute necessity. Distributed intermittent generation can provide secure supply in an integrated system, as northern europe shows.
Change and adaptation is continuous, rather than overnight; it is not simply the substitution of one source to another with no other adaptation of distribution networks.
In fact even the use of the term ‘baseload’ suggests a failure to conceive of the change underway:
https://theconversation.com/baseload-power-is-a-myth-even-intermittent-renewables-will-work-13210
Yep. I was taught this in my undergrad thermo class in 1947! Very old news, very highly ignored.
The hardware is here, right now. See NASA space thermal power stirlings. 35% heat to electricity at only a few hundred watts out!
Same tech burning wood out in my shop and powering whole house is my present little game.
Fun, highly recommended. Any number can play.
Hi PatrickR,
In this case I agree with you. My only quibble is that I believe the rate of change from fossil fuels to renewable energy might be lower than you seem to envision (perhaps you expect these changes will occur over 20 years where 40 years seems more realistic to me).
My hope is that you are right and I am wrong, my fear is that we may both be too optimistic.
dennis I agree; these big transitions are always slow to be in, even when they are fast in the greater scheme of things.
However the point I am trying to make is the effects of the shift are already affecting demand of other energy sources. And in 20 years, the shift to electricity will be absolutely clear on the oil price and supply volume numbers.
The US [the most elastic gasoline market due to criminal under-taxing] is showing a bounce in VKT in response to pop growth and at-the-pump price drop, but is still off its peak in volume. In other words, now, already, before EVs, newer more efficient ICE machines are already making demand marginally softer than it would otherwise be.
I am simply picking that to accelerate, in particular when EV number become more meaningful. But when will that be? Will it start to really happen by 2020 2022? I don’t know. But am pretty sure its going to have an impact on oil demand and therefore price.
Am still picking volatility; the next supply driven oil price drive you consistently predict may just coincide with EVs at non trivial numbers? We all agree that price is set by supply and demand at the margin, right? This will affect marginal demand, along with continuing ICE efficiency [the incumbent will keep fighting for market on efficiency as well as range, especially once range becomes a non issue in a few years].
Never firm on the timing, but the trend is hard to argue with. Will oil be the new coal.
Oh and I am talking about the west here; it makes little sense to average trends out between the OECD and the developing world; that doesn’t help understanding as each are on different trajectories, and China is on its on path, quite different from everywhere else.
cheers y’all
Hi PatrickR,
We are mostly in agreement.
The reason I use the World when considering the supply and demand for oil is because it is in fact a World market, much more so than natural gas or even coal (where lower grades are often too expensive for World markets when shipping costs are included).
So I expect the trends you are talking about to happen in the OECD, but it is a rate problem, will reduced consumption in the OECD more than match the increased consumption in developing nations as their economies grow at 5 to 7% per year?
You seem to think this will definitely be the case, but again if we look at World statistics on oil consumption vs real GDP, it is far from clear this will be the case.
What will speed the transition is higher liquid fuel prices. Then the criminals in the US along with BRIC countries will begin to transition to EVs, plug-in hybrids, hybrids and more efficient ICEV at a faster pace in response to high oil prices.
Eventually scarcity will no longer be a problem, but I think this will take at least 20 years and maybe as many as 40 years before oil supply will no longer be a constraint and oil prices might start to fall due to lack of demand (between 2035 and 2055).
Will this vision of the future be accurate?
In this case I think the chances are much less than 1% that I have guessed correctly.
It will be interesting, that is certain.
Hi Techguy,
I know you are all about the gloom and doom, but note that the EIA data shows that the rate of increase in real electricity prices has been slow so far (0.7%/year from 2000 to 2014). Thermal solar is a small piece of overall solar output, most comes from PV. Intermittency is easily solved with a combination of Wind solar and peaking natural gas power plants widely distributed and connected by the grid, preferably a HVDC grid in the future.
Electricity expenditures for median US household were less than 3% of income in 2014.
My opinion is that debt can grow as the economy grows, just like household income can support a certain level of debt sustainably, the same is true for the economy as a whole.
My guess is that Warren Buffet is right and that you are wrong. See link below and read pages 7 and 8 starting at “It’s and election year…”.
http://www.berkshirehathaway.com/letters/2015ltr.pdf
An excerpt:
It’s an election year, and candidates can’t stop speaking about our country’s problems (which, of course, only they can solve). As a result of this negative drumbeat, many Americans now believe that their children will not live as well as they themselves do.
That view is dead wrong: The babies being born in America today are the luckiest crop in history.
Hi PatrickR,
The data is using Fred data for real GDP per capita and converting to real GDP using UN population and BP consumption data in tonnes and converted to boe/d using 7.3 b/tonne. I used US CPI data to estimate real GDP in 2015$ rather than 2005 $. Chart below GDP is at market exchange rates rather than PPP.
I agree taxing externalities would be a positive development, but in many places this may not happen (US, China, and India).
I hope that you are correct, but I think supply will not grow as fast as demand falls and we will have oil scarcity for 20-30 years with high oil prices. Eventually your foresight will be correct, but it may take longer than you think, maybe demand will fall by 2050 so that oil prices fall and much is left in the ground. This is more important for coal, but it is important for the oil sands resource as well.
If the relationship in the chart below continues and real GDP grows by 2% per year until 2025 then liquids demand will be 95 Mboe/d in 2025.
Even if the slope of the line decreases by a factor of 2 (very optimistic imo) from 2015 to 2025, demand still increases to 90 Mboe/d by 2025 with 2% real GDP growth. It is unlikely that liquids supply will grow that much with low oil prices.
From 2002 to 2014 global coal consumption increased by about 1/3, almost entirely due to consumption in Asia escalating. That trend of massive growth is still underway, unless there is some new data from 2015 that indicated some massive reversal.
chart 3- http://www.vox.com/2014/6/19/5821250/these-5-charts-show-why-the-world-is-still-failing-on-climate-change
Hi Hickory,
From 2013 to 2014 World coal output dropped from 8231 million metric tonnes(Mt) to 8165 Mt based on BP data. World coal consumption rose by 0.4% in 2014 and from 2011 to 2014 the annual rate of increase in World coal consumption was 1%. From 2000 to 2008 World coal consumption increased at an average annual rate of 5.5%, I left out 2009 to 2010 due to the Global Financial crisis and recovery. Chart of the natural log of World coal consumption (to show growth rates) below.
Its kind of funny to me how you pick data to try to prove your preconceived notion- did you go to the Dick Cheney school of Evidence gathering? just kidding, but really why not just go with some straightforward charts and numbers and quit trying to hyper model everything?
btw- here in California the retail electricity rates are very high. Don’t get me wrong- I am a very strong advocate of Solar. My county has a $840 million generating facility going in now-
https://en.wikipedia.org/wiki/California_Flats_Solar_Project
Chart below (BP statistical review) demonstrates the coal consumption boom I referred to above- up through 2013. Perhaps it is slowing form the massive boom of the last decade, but there are many versions of predictions- I’ll believe it when I see it. India is really starting to ramp it.
Hi Hickory,
If you want to look at rates of change you use the logarithm.
The rate of growth of coal output was very rapid and it has slowed down (actually decreasing in 2014).
I think a 1% rate of growth is better than a 5.5% growth rate in coal consumption, but you may not agree.
Oh on the chart you presented it is pretty clear that consumption growth slowed in 2011.
In the chart below, it is clearer.
Hi Hickory,
That BP data is from the 2014 Statistical Review of World Energy. The 2015 report gives us the 2014 data. If we consider carbon dioxide emissions and take the natural log to look at growth rate trends we find that carbon dioxide emissions grew by:
1.3%/year from 1990 to 2001
4.0%/year from 2002 to 2007
1.1%/year from 2011 to 2014
2008 to 2010 was left out because of the Global Financial crisis and recovery. Chart below data from 2015 BP Statistical Review of World Energy.
Data can be downloaded into spreadsheet at
http://www.bp.com/en/global/corporate/energy-economics/statistical-review-of-world-energy.html
Hickory, big change in China:
https://www.newscientist.com/article/2079179-china-set-to-surpass-its-climate-targets-as-renewables-soar/
Hopefully it will be a substantial trend change, but from the same article-
“Despite renewables gains, coal still provides almost two-thirds of China’s power consumption. “
Hi Hickory,
There is an old adage, “Rome was not built in a day.”
As you said earlier prosperity is a key to transition.
As China’s economy continues to grow, the important thing is how fast coal consumption grows.
As renewables grow rapidly and coal use grows slowly, the exponential function characteristics will lead to a smaller and smaller proportion of power provided by coal.
Also coal will peak and become more expensive and speed the transition to renewables and nuclear power.
The effect of a whole lot of new efficient aluminum bodied F-150s replacing old F-150s. Those F-150 drivers aren’t going to drive more than they were before, and they’ll be using ~20% less fuel.
That’s the most obvious example of vehicle efficiency improvements. There are many more modest vehicle efficiency improvements arriving with next generation of models hitting the showrooms. Cumulatively this has to add up to notable demand destruction for gasoline in North America.
The reduced demand growth in the OECD will be more than offset by growing demand in developing nations, eventually this growth will have to slow as well as we approach peak oil. Perhaps we are already there as some believe, but I think the chances are pretty good that the 2015 peak will be surpassed by 2020, at minimum we will remain on an undulating plateau for many years even if 2015 proves to be the peak. A new C+C peak at 82 Mb/d or higher between 2020 and 2025 is fairly likely (33% chance or higher) in my opinion. A Plateau between 78 and 80 Mb/d could last until 2030.
A new one from Kemp
http://www.reuters.com/article/us-oil-prices-kemp-idUSKCN0W32ZC
EOG’s making money at $30 oil article challenged.
A large contribution by someone you will all recognize.
http://oilpro.com/post/22791/understanding-pushback-to-eog-shale-works-30-oil-hypothesis?utm_source=DailyNewsletter&utm_medium=email&utm_campaign=newsletter&utm_term=2016-03-01&utm_content=Article_2_txt
Hey Mike,
Very nice post!
And correct as always in my opinion.
Thank you, Dennis. And you too, Push. Y’all keep a bind on it!
Good to hear from you, here’s to higher oil prices, hopefully by year’s end. Bankruptcies in the LTO plays will help get supply down and prices up I hope.
The EIA’s Electric Power Monthly with data for December 2015 and the complete annual data for 2015 was released on Friday but I’ve had a fairly busy weekend so I’m just getting around to posting the usual graphs.
One conclusion did not go unnoticed over at utilitydive.com
EIA: Gas topped coal-fired generation in seven months last year
Since the Annual data for 2015 is now complete, here’s the graph. Again the folks over at Utility Dive took note:
Wind on track to top hydro as the leading U.S. renewable after 2017
I cannot understand why solar has it’s own column in the “all sources” spreadsheet but, wind does not, despite generating almost five times as much.
Report from India: A lot of vehicles driving everywhere all the time. Also, many multiple lane highways being built all over. However, there is a certain percentage of ox carts and bicycle rickshaws also present on the highway. And cows just laying in the middle of the road.
Now if R. Walter be kind enough to finish my calculation; 1.2 billion Indians driving everywhere all the time multiplied by 365 days in the year = ?
Related note; the air pollution was so bad in Delhi, that I developed a sore throat within hours. The pollution is not all from vehicles, though, there is quite a bit of trash burning going on.
Too bad. I worked hard and fruitlessly to sell some Indians on solar long ago, and also showed them that trash can cleanly run a generator. No luck at all.
‘Is that done in USA? No? then why are you trying to sell it to us? Do you think we are fools!”
How come people in Denmark do stuff that would work far better, and be needed far more, in India? God knows there’s plenty of engineering brains in India.
wimbi, a couple of things to soften the blow; there were some battery operated rickshaws and several towns I visited had banned plastic bags. Rather than buy bags, they take a page of newspaper and fold and glue it into a bag. Why don’t you do that, you wastrel!
Because wife does all the shopping and uses stout canvas bags with strong women’s words on ’em.
i gage my decline by number of bags I can carry, year ago, 3, today 1 and complaining. Ah well.
I took a rickshaw from train to university where I was giving a seminar. The very thin guy working it was a grad of that university, obviously very smart, and totally without hope of employment.
Damn! I shoulda stopped right there, hired that guy and given him some money on the spot, of which I had a lot at the time.
Big problem, gross disproportion of wherewithal and ability. Everybody would be SO better off if we spread it to the folks who can do lots of good with not much, and took it from the ones who do nothing or worse with near all there is.
“You have the ages for your guide, but lack the wisdom to be led”.
Newspaper?! What the heck is that? 🙂
Fire starter. You find it in people’s garages.
Russia’s crude and condensate production in February was 10,840 kb/d (preliminary estimate), up 2.1% year-on-year, and down 25 kb/d (0.2%) from January level.
source: Russian Energy Ministry
http://www.19rus.info/index.php/ekonomika-i-finansy/item/44314-rossiyan-preduprezhdayut-ob-ostrom-defitsite-benzina-s-1-iyulya
Russians warn of the acute shortage of petrol from July 1
————————
http://www.the-village.ru/village/situation/situation/231679-benzin
In the summer of 2016 years Russia will face with lack of gasoline.
All of which will add to the glut of distillate.
Price influence, eh.
What if the oil spigot would run dry every day? We gotta go get some more, it is gone. Gotta pay a visit to the oil field, run out to the wells and fill up the tanker with another 18 million barrels of oil.
What were we thinking? We should have just pumped another 18 million barrels yesterday.
The oil flows, be happy it does.
Yes, there will be 1.2 billion driverless cars in India so anybody from 6 months old to 99 years can just hop into one and tell the car where to go. The voice recognition software will understand every utterance and the car will know where to go.
When the driverless car gets low on fuel, does it just run out of gas or does it make its way to a gas station? Who fills the tank at a self-serve gas stop?
The doggone coyotes are about 300 feet from the farmhouse during the night, they’re yapping and howling like never before.
https://fightlikecatsanddogs.files.wordpress.com/2013/04/fennec-fox-animal-1920×1200-1203jpg-103359.jpg
Wimbi said: When the driverless car gets low on fuel, does it just run out of gas or does it make its way to a gas station? Who fills the tank at a self-serve gas stop?
Excellent question, probably somebody had considered this. Since the cars will be able to talk to each other they can find the lowest price fuel in the area, just follow them to that service station to get a bargain.
Self-service is a problem. They will just go to the handicapped pump (since they cannot walk or serve themselves) and someone or some robot will come out to pump fuel in or hook up the charge cord.
Maybe the self service station pumps will have robotic arms that come out and fuel up the cars?
I am sure some really comical scenes could be developed from that one as things go wrong or humans try to use the pumps.
Safety Advice for those using autonomous cars: Never, ever get in an autonomous car named HAL or Lizzie B.
Nah, t’warnt me said that. I know the answer from way back, when I saw a little thing sneaking along the edge of one of those ghastly long gloomy depressing hallways at MIT, followed by its master. I asked him what it did, and he just pointed. the thing went along in a sort of feeble feelit way until it got to an electric outlet, plugged itself in, waited a bit, and then unplugged and continued its creep. That’s all it did. Named Ratty.
I asked if anybody was working on a Catty. He nodded with a grimace – too obvious.
So basically he built this…
http://themindi.blogspot.com/2007/02/chapter-8-soul-of-mark-iii-beast.html
Go ahead, try to kill it, I dare you!
Tow truck? No such thing. Instant diagnosis and repair truck. Car ICU.
Now, if I could only get my local MD’s to think that way.
On second thought, maybe best to the recycle vat. Why not? all my grandkids are amazingly smarter than I ever was, despite doing good on the Eddy RT test. “nobody gets everything on eddy test, you cheated, take it over”. Same.
Fred.. You dig up the most amazing things. Maybe some day send me a list of your favorite sites?
Si-fi as we called it, is a hugely underrated force for good in the world. I grew up on it. i met Isaac Asimov after BU fired him for being too funny to teach chem.
Fred.. You dig up the most amazing things. Maybe some day send me a list of your favorite sites?
For that particular reference I have to say that I read ‘The Mind’s I’ as a physical book, real printed ink on actual paper, way way back, a long long time ago, so it’s influence on me predates my online experience by at least a decade and a half. It may have been one of the most seminal books I ever read in terms of forcing me to think critically about everything.
As for Asimov, I always loved his SciFi but he was a pretty darn good biochemist as well!
I was in the homestretch and beginning to think forward to writing my Ph.D. dissertation. I rather dreaded that, since the obligatory style of disserations is turgid in the extreme, and I had by now spent nine years trying to write well and was afraid I simply might not be able to write badly enough to qualify for my degree.
Isaac Asimov
Classic Asimov!
I started teaching as a founding member of BU engineering dept. My office mate (WWI fighter pilot!) told me he was walking down the hall one day and was blown away by a huge burst of laughter from a lecture room. His friend muttered “It’s that goddam Asimov again, why the hell doesn’t he just stick to chem.”
Sorry wimbi. Obviously I was using R Walters comment. I have no ability to edit a comment after I post.
Are the tow trucks autonomous too?
Exxon, cut capex 25% in 1916, no mention of XTO .
http://news.exxonmobil.com/press-release/exxonmobil-focuses-business-fundamentals-paced-disciplined-investing
ExxonMobil Focuses on Business Fundamentals; Paced, Disciplined Investing
ExxonMobil anticipates capital spending of $23 billion in 2016, down 25 percent from 2015. The company continues to selectively advance its investment portfolio, building upon attractive longer-term opportunities.
1916? Welcome in the 21st century! 🙂
That’s really old news Toolpush. Through which sources do you get your news in Australia?
Enno,
Either the speed of electrons has slowed down, or Exxon is recycling old news. I first heard it as breaking news on CNBC, live, not a replay. lol
Looked it up on Noodls, which took me to the Exxon page. Time stamped as Mar 2, 2016 – 08:11 a.m. EST.
03/02/2016 | Press release ExxonMobil Focuses on Business Fundamentals; Paced, Disciplined Investing – See more at: http://www.noodls.com/viewNoodl/32408933/exxon-mobil-corporation/exxonmobil-focuses-on-business-fundamentals-paced-discipli#sthash.MLFZO9sV.dpuf
So if this is old news, it is recycled old news by Exxon? Why? I will leave that to smarter minds than me!
You are doing great work, on your blog. thanks for all your hard work.
> Exxon, cut capex 25% in 1916
🙂
Yeah, but it probably, helped in the war effort, some how! lol
Toolpush,
“…no mention of XTO.”
XTO is working in the Vaca Muerta. You have to read the part written in Spanish.
Has anybody in this forum ever read or heard that if electricity producers were to own both fossil fuel AND wind /solar power farms, the issue of how costs and revenues should be allocated simply DISAPPEARS?
I find it hard to imagine this is an original observation on my part, but I mentioned it here a few days back, with no response.
I know of one utility that owns fossil fuel and renewables. Doubt they are the only one. Not sure how they allocate costs and revenues between the 2, if they do at all, but my experience on the fossil fuel side is they are conservative with values they place on their assets. They have lots of cash, move deliberately and look years out.
In my country a number of generators do; but all the coal and gas thermal stations are being phased out. Because of cost, being replaced by Wind and Geothermal. The majority is Hydro. 80% renewable in total.
According to Wesley Pruden, the list of people Trump the idealistic, role model business man screwed in just ONE bankruptcy runs to almost two THOUSAND pages.
Here is a link to one of the most hard core anti HRC pundits in the country telling it like it is when it comes to TRUMP.
It is well worth a minute to read it, and pass it on, it will convince some people who read it just what Trump is really like, as opposed to his campaign image.
http://www.jewishworldreview.com/cols/pruden030116.php3
The EIA’s Weekly Petroleum Status Report is out. Stocks were up by over 10 million barrels to 517,981,000 barrels. US production dropped 25,000 barrels per day to 9,077,000 barrels per day.
On that news, the build in stocks, WTI price dropped by about 60 cents but is now up by about to +40 cents. In other words it jumped by about a dollar. There must have been some news. It has now given up about half that 40 cent increase.
Gasoline down, import up. Maybe some experts in here can elaborate on this. Here is from Reuters John Kemp
…..
Main story in this week’s Weekly Petroleum Status Report is the continued strength of implied gasoline demand, which averaged 9.26 million b/d over the last 4 weeks, up almost +7% compared with the same period a year ago.
Some of this is likely to be due to weather effects and other short-term statistical noise, but there is no disguising the strength of gasoline demand in the United States.
Refiners have responded by raising crude processing to a seasonal record 15.85 million b/d, an increase of more than +700,000 b/d compared with the same point in 2015
Gasoline stockpiles are actually below year-ago levels once adjusted for the faster rate of consumption
But crude imports surged last week and were running at the some of the fastest rates seen over the last two years
With imports rising faster than refinery processing, crude stocks leapt by more than +10 million bbl
The problem with refineries running to produce gasoline is that they are also producing large quantities of distillate, while demand for heating oil and diesel fuel remains depressed, adding even further to the enormous distillate glut
Distillate stockpiles are now equivalent to 47.7 days worth of current consumption, up from 29.1 days at this time last year, and a long-term average of around 31.8 days for this point in the year
….
I know someone discussed that the distillate build was has some part in the down turn in O&G sector.
A reflection I did was that on Monday when the Genscape data was released (indicating build in inv.) and price dropped but were bought up quick. Same with API yesterday, I sence a slight shift in sentiment. But best to stay humble on price movement. This week been BTFD so far.
Thanks all for the valuable information.
NOTE: Drilling rigs run on diesel.
NOTE; Walmart closed almost 300 stores and shipping/trucking is at or near all time lows. Thats a lot of unburnt diesel.
http://www.cnbc.com/2016/03/02/ex-chesapeake-ceo-mcclendon-dies-in-car-wreck-day-after-indictment.html
Police: McClendon crashed traveling at ‘high rate of speed’
Aubrey McClendon, a founder and former chief executive of Chesapeake Energy, died in a single-car crash Wednesday at age 56, a day after he was charged with conspiring to rig bids for oil and natural gas leases.
I knew him from a business relationship. Before Chesapeake went public, they ran out of money. The owner of the the company I worked for and I met with Aubrey and Tom Ward. We agreed to sell Chesapeake rig fuel on credit, being paid only after they went public. They went public about 6 months later [1991?] and we had their fuel business – forever. But, for 25 years he was on a roller coaster of epic proportions. The first year public, Chesapeake was the #1 performing stock on the NYSE. Three years later, they were the worst. And that was the future – epic highs and lows for the next 20+ years.
In my opinion, he was a very nice guy. No company, for their size, ever gave more to charity and civic causes. He was married to a Kerr (of the Kerr- McGee founder – Senator Bob Kerr from OK). I always thought that his aggressive style was an attempt to prove that he could be successful independently from being related to a Kerr.
He was only 56, and it looks like a suicide. A rural road in North OKC, about 9 am, and directly into a concrete bridge abutment at a high rate of speed. No other cars around.
I am clueless with respect to the specific charges. But, it is extremely common for a company to bid on leases and having other companies there that say – “we will not bid, but if you get it, we will go in for 20%,” etc. Especially in Federal offshore.
It is very rare for an oil and gas company to have 100% of the working interest. It is a share the risk business.
I am clearly out of date, so if I am not right, Shallow Sand, or others can let me know.
Suppose CLR was the other company. That would be cool.
According to Bloomberg, it was SandRidge Energy and Tom Ward.
Back in the 80s, offshore lease sales were conducted by a sealed bid process.
It was very common for E&P Companies to enter into Joint Bidding Agreements in the offshore areas. But companies would not and do not agree to fix prices.
Should one company want to bid more than its partner(s) then there is a procedure to drop out and let the other company proceed alone or with others. Or you can seek other partners. Most companies do not know what the final bid is until just before an offshore lease sale
Most JBAs cover large areas and multiple prospects are identified. It’s is a process of each company living with a budget, differing prospect values and managing risk. Some will want to bid more. Some will want to bid less. Depending upon how badly a company needs to layoff risk determines its top bid.
Companies operating offshore in Federal or State waters are very careful to avoid any perception of price fixing because there are huge penalties if discovered.
At least that is the way it was when I worked the Gulf of Mexico.
John S
I agree with you. That being said, there are nuances: “Should one company want to bid more than its partner(s) then there is a procedure to drop out and let the other company proceed alone or with others. Or you can seek other partners. Most companies do not know what the final bid is until just before an offshore lease sale.”
Companies did “know” something when they elected to to drop out. So they knew a higher bid was coming. But, in the main, there were several groups that were in a true contest. But, as with anything, since there were several groups of several companies, there was the possibility of getting information.
Clueless/John S,
The difference I see in the GOM compared to the LTO land leases, is that in the GOM, the oil companies are the small guy, dealing with the monopoly govt big guy.
On land, dealing with small land owners, the oil companies are the big guy, holding all/most of the information and the power.
I believe it is the abuse of that power, is what is in question.
I suppose there is always an exception to the rule. But let’s not forget that there was a unique relationship between SandRidge’s and Chesapeakes’s executive management. And , let’s not forget that Chesapeake was investigated for doing the same thing with Encanna in Michigan. Clearly there was a pattern with Aubrey McClenden
The big difference between onshore and offshore is the size of the lease blocks (5,000 acres for LA state waters and 5,760 acres for Federal leases as I remember) and more importantly the immense capital investment and therefore the limited number of potential competitor/participants. It’s a game for the big boys.
In onshore, there are hundreds perhaps thousands of competitors.
There is simply no way that 1 or 2 companies can conspire to fix prices over a large area for any length of time. Sure maybe it might happen in a blue moon, but until you have experienced a major competitive lease play, you can not believe how competitive it really is.
It is far more common for mineral owners to attempt to conspire to fix prices in a lease play to make companies pay more.
This doesn’t work very well either because there is always someone in a family or community that needs money more urgently or more quickly than the conspirators.
They almost always fold.
I’m gonna vote for an evaluation of defending legal fees in a losing case, perhaps outside the boundaries of corporate officer indemnification and a decision to keep the money for his family.
A lot of Salem witches made that choice.
I am no car wreck specialist, but do many cars in front on collisions catch fire and burn from front to rear?
I would have thought, once the fuel pump stopped running, which would happen rather quickly in this type of crash, then end of fire. The fuel tank in the rear, should not be damaged, but from the pictures of the car on the tow truck, you can see the car is burnt from front to back.
Certainly, if the fuel tank ruptured, that could explain the fire, but would reflect badly on the design, in my opinion.
Ooooh, juicy.
Seatbelt off but airbags on that model car.
Ironically I have been helping a friend of mine rebuild a a few late model crashed Mercedes Benzes that he picked up for pennies on the dollar at auction. The SRS and airbag control systems on these babies are IMHO the scam of the century. Case in point one of the vehicles involved in a collision which lightly damaged the front driver’s side portion of the vehicle and set off quite a few of the airbags including the pelvic airbag located in the driver’s seat also set off the rear seat seatbelt tensioner mechanisms despite the fact that there were no passengers in the rear seat and permanently locked them up. These seat belts need to be replaced, if that were to be done by Mercedes, parts and labor would be off the charts. I’m having a lot of fun finding ways to do this ourselves with the help a fascinating aftermarket business specializing in resetting both the SRS and control modules. Once we are done these vehicles will be inspected and put back on the road. But it has been quite the eye opening experience. As time goes by I have less and less respect for any major corporation!
Yair . . .
TOOLPUSH.
From my limited experience once a car starts to burn most do in fact burn from front to back.
Cheers.
I can’t remember when they were first mandated, but at least as far back as the early nineties, cars and light trucks have had crash sensors that turn off the engine electrical power- and they generally work.
So- this turns off an electric fuel pump even if remotely mounted,generally inside the fuel tank itself. But if a fire gets started, turning off the power does not stop the flow of fuel.
Why? Because once a fuel line any where under the hood is ruptured, it sprays fuel, which burns like hell once started, for a few seconds to five minutes, depending on the size of the rupture, before the pressure in the system is depleted. The fire creates enough heat to boil off the remaining fuel in the lines, and by then the fire will be well established. One drop of fuel on the exhaust manifold or an underhood catalytic converter is sometimes enough to set her off.
Beyond THAT, all modern cars have pressurized fuel filler caps , and the heat from a well established under hood fire generally creates enough hot smoke that travels back underneath the car to put some heat on the fuel tank. That keeps the fuel flowing because gasoline VAPOR expands fast when heated even a little bit. This expansion pressurizes the tank of course, and there is always some vapor in the air space above the fuel. Some gasoline may actually drip down to the pavement and run back towards the tank, burning as it goes.
( For anybody who is TOTALLY ignorant of auto mechanics, the pressurized cap is a pollution control device, which reduces evaporation, and keeps gasoline fumes from polluting the air. Pressurizing the tank virtually eliminates evaporation. )
I once personally watched half a dozen firemen with two pumper trucks trying to put out a fire burning this way , spraying hundred of gallons of water a minute, but unable to get the water on the fire, due to the HOOD of the car. Contrary to popular wisdom, ENOUGH SPRAYED water on a smallish gasoline fire WILL put it out,by cooling and diluting the fire, and actually pushing most of the air away. A high volume spray of atomized water has an awesome cooling power .
This car was not even in an accident. MY personal opinion is that somebody repaired the fuel injection with a piece of ordinary gasoline line rubber hose, of the sort used on older cars. It’s heat resistant, but not alcohol proof, and not rated for more than ten psi, whereas fuel injection invariably runs at forty psi MINIMUM. It caught fire almost directly in front of the fire station, where I happened to be passing by. Old redneck country boys never fail to take in such spectacles.
They absolutely refused to open the fuel filler cap, and the car burned like hell under the hood for ten minutes or so , but they DID listen to me and put some water off the pavement from back to front, splashing up and cooling the underside of the car, and thus cooling the fuel tank, thus stopping the fuel from spraying out under the hood.
They saved the car from the front doors back, but it still went to the scrap yard.
I was very surprised at the time that they didn’t know this stuff, but this was a LONG time ago , late eighties or early nineties, and I am sure this sort of thing has since long been incorporated into the training about how to deal with burning cars.Tightly sealed caps and fuel injection were just getting to be the norm, and these guys were volunteers rather that pros, who probably WOULD have known even back then.
OFM/Srub puller,
Thanks for your replies.
I hadn’t thought about the unintended consequence of the sealed fuel cap.
I note there is still paint on the driver side,back end, so the fire has definitely burnt from the front.
When people do the crash suicide thing in my parts, they often aim for the front of a logging truck. The one good decision he made was to pick a bridge abutment and not another vehicle.
Yair . . .
Fuel is obviously an issue but you can be assured there is enough plastic, rubber, solvents and oil in the average car to often burn it out completely . . . just light a little twig and paper fire under the drivers seat of a wreck and watch.
Cheers
Stockman’s Tales of western intervention into the ME Oil Puzzle.
“The Trumpster Sends The GOP/Neocon Establishment To The Dumpster”
“And most certainly, this lamentable turn to the War Party’s disastrous reign had nothing to do with oil security or economic prosperity in America. The cure for high oil is always and everywhere high oil prices, not the Fifth Fleet”
http://davidstockmanscontracorner.com/the-trumpster-sends-the-gopneocon-establishment-to-the-dumpster/
Longtimber,
Thank you.
Compare with the recent article by Robert F. Kennedy, Jr. in Politico:
http://www.politico.eu/article/why-the-arabs-dont-want-us-in-syria-mideast-conflict-oil-intervention/
“The EU, which gets 30 percent of its gas from Russia, was equally hungry for the pipeline, which would have given its members cheap energy and relief from Vladimir Putin’s stifling economic and political leverage.”
That is nonsense. The issue is that Russia has quite limited leverage: They can not replace the European customers on short notice – pipeline chain producer to certain custrumers – and they urgently need the income.
The more interesting question for Russia is how to cope with a customers who may reduce the demand for NG by 1% per year for the next few decades.
“The issue is that Russia has quite limited leverage: They can not replace the European customers on short notice”
Leverage is always mutual in the gas trade that involves long term contracts and long gas supply lines. It is like marriage 🙂
“The more interesting question for Russia is how to cope with a customers who may reduce the demand for NG by 1% per year for the next few decades.”
I am not sure that this is the case.
“Gazprom’s gas exports to Europe – including Turkey – had increased to 158.6 billion cubic meters in 2015 with a 8.2 percent increase compared to 2014.”
y-o-y data are no trend. BTW: If you check the primary energy consumption of Germany, by far the most important customer of Russia, you find that the demand shrinks. On the EU level we have the same picture.
I do not deny that the European imports may increase as domestic production declines faster than the reduction of demand, however, there are some alternatives like LNG; the dependency on Russia will not increase that much.
The other more Russian POV: With no competitive industry (save weapons) Russia needs oil and NG exports to cover their day to day business, this limits leaverage, esp. when this dependency increases
as in the last decade.
@Ulenspiegel : No it is anything BUT nonsense.
The EU’s domestic production of natural gas, including non-EU member Norway, is already in terminal decline and will be declining into the future by almost 2% per year until it reaches zero.
Unless the EU can find alternative sources of natural gas at competitive prices, Russia remains the only economical option, hence the extremely high stakes over the Syrian War.
Moreover, the EU’s “Green Energy” policies are an outright, insolvent disaster. Windmills and solar panels can never and will never compete with hydrocarbons and don’t let any muppet claim otherwise. If wind and solar were anywhere remotely viable sources then why would anyone give a toss over the Middle East at all? The degree to which “alternative energy” is uneconomical can be seen from the EU’s extremely high energy costs, far and away the highest in the world. In their fanatical crusade against Russia, the EU countries have opted for a catastrophic energy policy that has rendered them global economic growth laggards. All this, just so that Russia’s gas exports could be kept at the absolute minimum.
What Russia seeks to achieve vis-a-vis Europe, is to force/encourage/compel the EU to integrate by as much as possible with Russia. What NATO (and especially the US and Euro-Atlanticists) most fear is that a Russia rich in capital and technology would be the world’s dominant geopolitical player.
This is what is at stake in the current Global Hybrid War.
This muppet says you have a rear view mirror only which will be entirely proved redundent by history.
But of course gas is vital now; transitions to new energy sources are multigenerational tasks, and we are only at the start; it doesn’t happen overnight.
However in the near term you are right, gas dependency is likely to rise first as both coal and (in some states) nuclear are abandoned first. Gas will be left too, partly for the reasons you state: import dependency, and partly on cost, and partly on carbon pollution.
To understand change you have to watch the trend not the status quo. And understand that change does actually mean change.
If you read may posts you would know that I indeed know that the domestic European NG production is declining; but the demand is declining, too, and will be decling for decades, no surprise when you understand the underlying reasons.
I assume that Europe needs more NG imports, these can come from Russia or other sources like LNG.
Your RE arguments are nonsense, with such ignorance I perfectly understand your position in respect to Russia. 🙂
Energy was always expensive in central Europe and led to a quite high efficiency and interesting technological developments and alternatives, you may be ignorant, but thanks god that does not change reality. 🙂
I would note another conventional company that has shut in wells. Mid-Con Energy Partners is a very small company, 4,700 bopd of water flood leases. They say they have shut in 5-10% of production.
CRC also, although not shutting in production, has left select wells that go down with mechanical failures shut in.
SS,
here is some good news. You have heard it first from me here on POB 2 weeks ago. We are moving in direction of restoring the prices to acceptable level that major producers can live temporarily.
“The meeting of oil-producing countries will be held on March 20th in Russia, the Minister of oil of Nigeria, Emmanuel Kachikwu, announced. According to him, it will be attended by representatives of countries who are OPEC members and countries that are not members in the organization. Mr. Kachikwu noted that producers seek to restore oil prices to $50 per barrel.”
http://www.bnsf.com/about-bnsf/financial-information/weekly-carload-reports/
Coal hauled down some 14,000 cars, petroleum cars down almost 3000 from the same week in 2015.
I saw a parked SUV in a parking lot one day about 7 years ago now. All of a sudden smoke started to billow from under the hood and the suv was on fire in less than a minute. The fire department was there in less than five minutes.
R W
It’s all uphill for coal. Not only is natural gas a big competitor but transport costs have been rising significantly. Just one more factor to take into account as the coal plants age out.
“The average cost of shipping coal by railroad to power plants increased almost 50% in the United States from 2001 to 2010. Railroad transport accounts for more than 70% of U.S. coal destined to the electric power sector, so changes in rail rates can have an important impact on the cost of coal delivered to power plants. Though they vary significantly, transportation costs accounted for 40% of the average overall cost of coal delivered at electric power plants in 2010.
On average, nominal U.S. rail rates for shipping coal grew from $11.83 to $17.25 per short ton from 2001 to 2010. Rates grew slowly in the beginning of the decade before increasing almost 11% in 2005, then continuing to grow at a relatively robust pace until the recession. However, the impact of the recession on transportation rates was short-lived as rates grew more than 9% in 2010.”
http://www.eia.gov/todayinenergy/detail.cfm?id=8830
It’s a damned good thing terrorists are mostly unimaginative, in the box thinkers with little imagination.
Anybody with a brain could burn up a carefully selected major shopping mall or the entire parking lot of a jam packed big athletic facility without the law even being able to prove INTENT. Just an accident.
Time for some gonzo musings, all apologies for any offense, so sotty.
Will somebody p!ease tell Mitt Romney to stick it where the sun refuses to shine? Hell, I will. Stick it up your ass, Mitt, ya dumbass.
Anybody with a brain would do the same.
I once held in my hands a master key that would unlock any door in a very important building of a government that is very well-known throughout the world.
Guess which gov that would be?
It was often joked how much damage could be done with those keys.
Of course, you knew you were going to be caught, it was a fool’s maneuver to even think about doing something where you would end up in the hoosegow.
Believe me, it was a key to the city, very sensitive documents could have been obtained with ease. There was time and opportunity, had I thought it to be worthwhile, there would have been a new Pentagon Papers caper. har
I don’t much care, it was a flunky job, so who cares about all of the subterfuge and skullduggery? Not me!
An old friend would call from time to time and when I would answer he would address me as R Walter. Often times he would call and say to me, “Ron, you rotten fucker!”
He has since passed on, so anytime anybody wants to call me a rotten fucker, be my guest. har
And thanks for the reply!
I was never a Romney fan… until today. I was cheering him on today though, except for the things he said about Hillary.
I think anyone who cannot see through that con artist phony Donald Trump is just fucking blind.
Hi Ron,
Damned tooting. Nobody I know personally ever had a high opinion of Romney. This is the first time I can ever remember having anything positive to say about him myself. Anybody who sees thru Trump and tells it like it is cannot possibly be ALL bad.
Remember Mencken? Anybody who hates kids and dogs can’t be all bad. LOL
Well, it was not Mencken, it was W. C. Fields. Or more correctly, said about W. C. Fields at a roast for him.
W. C. Fields
Anyone who hates children and dogs can’t be all bad.
Although very commonly attributed to Fields, this is derived from a statement that was actually first said about him by Leo Rosten during a “roast” at the Masquer’s Club in Hollywood in 1939, as Rosten explains in his book, The Power of Positive Nonsense (1977) “The only thing I can say about W. C. Fields … is this: Any man who hates dogs and babies can’t be all bad.”
Variant: Anyone who hates babies and dogs can’t be all bad.
I am getting to the point I can’t rely on my memory any more when it comes to matching quotes and people. 🙁
Yair . . .
You do alright old mate, I read you posts with interest.
Cheers.
Obviously Trump cannot deliver on his promises. Romney is right. I was a fan of Romney’s father, an early advocate of small efficient automobiles. Whoever is becomes president next year will likely take the blame for the coming collapse.
I don’t care if Donald Trump wants to be elected dog catcher.
Mitt was like the Grand Inquisitor enumerating every heresy the heretic Donald Trump committed since he was in kindergarten.
Cashed in all of Donald Trump’s faults, all of his many sins, none that can be forgiven.
Saint Mitt had the goods on the evil sinner Donald Trump and there was no escaping the wrath of Mitt, and everybody knows Mitt is holier than thou.
The stupid sanctimonious pious nitwit had no business being a judge, jury and executioner and people let him get away with it, cheered him on, even. The Grim Reaper at work, Mittracula goes for the throat. It will be a cold day in hell when I would cast a vote for a Republican like Mitt Romney. A phony phonier than Donald Trump.
Is was a huge crock of horseshit foisted upon the American people.
Mitt can crawl back into his limo and disappear forever.
Complete nonsense what is going on in this election cycle.
Duck – Peak nitwits launching turds?
http://davidstockmanscontracorner.com/mitt-romney-is-the-real-super-fraud-heres-the-proof-chapter-and-verse/
Easy make this post energy related! – The Donald could be Energy Secretary for HRC – After-all – Didn’t he say he just take the oil or did I dream this up?
I think anyone who cannot see through that con artist phony Hillary Clinton is just fucking blind.
I don’t trust any politician (although Bernie does seem pretty straightforward),
but surely even a blindman can use brail to gladly vote for Hillary
over the guys the republicans put up.
There are always differences of opinions in politics that are not easy to resolve. Even many conservatives (60 % or so) are not happy with Trump.
The average US voter is easily fooled, unfortunately.
Hi Dennis,
Dead on, but better this way, lol.
The average US voter is easily fooled, unfortunately.
Hi Old Farmer Mac,
Absolutely, let the fools decide who their leader will be. Hey, sometimes we end up with FDR (imo a good president), maybe we end up with Trump in 2017, (scary to me, I would prefer Bush, Kasich, or Rubio.)
Better than a dictatorship in any case.
Imagine Trump in office. Would be the first time everyone including the prez breaths a sigh of relief when he conveniently forgets his campaign promises.
It’s a whole new ballgame for the democratic nomination as of this hour, or maybe a couple of hours ago.
Go Bernie!
http://www.huffingtonpost.com/h-a-goodman/obamas-justice-department-gave-bernie-sanders-presidency_b_9372012.html
Quick insignificant poll of fellow bernie folk around here re hillary court case
‘Was she lining her pocket?”
“long time ago, any worse result than usual fubar?”
“She was dodging bureaucrats, anybody does that.”
Sum. lots ado about nothin much, way back.
Go Bernie.
So HRC is a mere politician. Yep, the usual. But not a maniac.
https://www.youtube.com/watch?v=5NzhQWcc7h4
One good thing about principle-free politicians. They can be pushed. From either direction.
PS. I know nothing, just asked a few people because they were sitting there, and like to talk.
Hi Wimbi,
I don’t think HRC is any worse than the run of the mill national level politician when it comes to her ethical and moral qualities, but otoh, I DO doubt her JUDGEMENT.
Look, she is not an ignorant hill billy woman, kept pregnant and barefooted all her life. She is a lawyer , trained at a top university.
Running that email system displays one of two failings, utter stupidity, or an appalling level of arrogance. More likely both imo.
When the time comes Trump will republish everything on the net about this foolishness, and it would take several hours to read the dead fish smelly details that have come out already.
You are mathematically literate, go on back to Cattle Gate, and read it up in any major paper that actually covered it well , which only a couple did in any detail.
I have forgotten almost all the math I ever learned, but I learned basic probability theory over a half a century ago, and the odds of her being able to make honest money the way she did in cattle futures are ASTRONOMICALLY HIGH AGAINST.
Add in the fact that her broker was a known crook, and given the way records were kept at his brokerage, and there is only one possible conclusion. He sorted winners and losers, systematically, and fed her a stream of winners.
Shit, one or another of the Bush presidents managed to more or less steal about fifteen million playing the subsidized stadium and franchised baseball team game, but HIS theft was TECHNICALLY legal.
So – I want a D in the WH because I from here on out will be voting the environmental ticket above and beyond all other considerations.
Bernie will do as well, or better, in terms of the environment, and actually in my opinion has a LOT better chance of winning the general election.
We have seen what Trump is willing to say about his intra party competition. He is the worst of everybody running, by a factor of ten, but he is NOT STUPID, and he is as mean as a blind rattlesnake getting ready to shed.
When he once has the nomination, if he gets it, the Clinton record all the way back to Arkansas will be on the net and on tv and radio, and in large news paper ads continuously all day, every day. He has the money and the will to make it that way.
Bernie Sanders actually polls better nationally right now than HRC against Trump.
And somebody with a brain answer me this rhetorical question. How many HRC fans will stay home, rather than vote for Bernie Sanders?
The answer in my honest opinion, is DAMNED FEW.
This election is unique, in that the likely nominees at this minute have the highest ever negatives, across the board. There are millions of people who will vote AGAINST HRC, rather than FOR Trump. If HRC is not the D nominee, a lot of them will stay home.
Almost every body I have talked to who will vote AGAINST Trump, rather than for the D candidate, will come out and vote FOR Bernie Sanders as reliably as they will come out for HRC. The sole exceptions among my acquaintances are older women who are personally loyal to HRC. A few of them might stay home out of disappointment, but most of them will vote for Bernie.
Hey folks, if you want a D in the WH, you better be hoping Bernie Sanders gets the nomination.
I live in one of the upper or northern most corners of the OLD SOUTH, and know and work with black people, and remember eating in restaurants with no blacks signs and that sort of thing myself. Greensboro is only a little over an hour by car from my place. Every last black person I know who votes will vote for Bernie if he gets the nomination, and what choice would HRC have but to endorse him , and encourage a big turn out, if she loses the nomination? Her argument that he can’t win just doesn’t hold water so far as I am concerned. ALMOST every young person I know who will vote will vote for Bernie, because he has lit the fire for them the way Obama lit it.
Liberals just don’t get a basic fact about HRC, apparently due to cognitive dissonance and an unwillingness to consider unpleasant truths. Her negatives would have SUNK any other politician on the national scene years ago.
Republicans are not necessarily stupid, and every establishment republican I know of is PRAYING that HRC will be the D nominee, and HAS BEEN praying thus for the last three or four years. They have a finger on the pulse of the country just as surely as anybody else.
I am doing my best to make my case like a coach or team manager debating the rest of the management about who will be the starting pitcher or quarterback. Bernie is the more likely winner imo, if he can get the nomination.
Ok. If he can get nomination, he wins. Good enough for me. Back to work.
“An Indian Point reactor safely shut down for three days starting Dec. 14 following an electrical disturbance on outdoor high voltage transmission lines, Entergy Corp. said. An outside expert is analyzing whether what’s technically called bird “streaming” was the culprit.”
http://hosted.ap.org/dynamic/stories/U/US_NUCLEAR_OUTAGE_BIRD?SITE=AP&SECTION=HOME&TEMPLATE=DEFAULT&CTIME=2016-03-03-14-38-43
The Future of Energy is Distributed.
trouble for Exxon?
The U.S. Justice Department has forwarded a request from two congressmen seeking a federal probe of ExxonMobil to the FBI’s criminal division.
U.S. Representatives Ted Lieu and Mark DeSaulnier sought the probe last year to determine whether the oil giant violated federal laws by “failing to disclose truthful information” about climate change.
In response, the Justice Department deferred to the FBI, saying it is that agency’s responsibility to conduct an initial assessment of facts that prompted the congressmen’s request. Such action is considered standard procedure, according to former federal prosecutors who say the response appears ambiguous as to what action may be taken by the FBI.
“As a courtesy, we have forwarded your correspondence to the Federal Bureau of Investigation (FBI),” said a letter to the congressmen from Peter J. Kadzik, an assistant U.S. attorney general.
“The FBI is the investigative arm of the Department, upon which we rely to conduct the initial fact finding in federal cases. The FBI will determine whether an investigation is warranted.”
The Justice Department’s referral letter to the FBI, however, has not been released, so it is not known if it contained any specific instructions.
The referral was made to the assistant director of the FBI’s Criminal Investigative Division.
http://insideclimatenews.org/news/02032016/justice-department-refers-exxon-investigation-request-fbi-climate-change-research-denial
Well I hope the FBI does pursue action because if they do they might actually stumble upon the reality of how the climate change movement since the time Exxon is supposed to have committed its crimes has gotten completely and thoroughly hijacked by the Marxists and Corporatists for their own psychopathic purposes and agendas. Added to this is that most climate scientists ignore real environmental concerns such as the Fukushima nuclear disaster or widespread fraud in the Environmental Protection Agency and instead go after schemes to regulate, tax, spend taxpayer money, and try to force all of us to buy “green” and “sustainable” products we will never want.
Yes, the F.B.I. will certainly be able to solve the the case of “The purloined truth about climate change”. No doubt their forensic labs will be studying the important discourse here at P.O.B.
It’s hard to know when people are serious as opposed to sarcastic, unless you know them well, especially when reading a short comment.
Sloop comes across either way, skeptic or denier. I don’t recall him posting enough if any thing to have an opinion as to his technical knowledge.
Calling folks deniers is not nice, unless you know that they are well educated enough to judge the evidence to at least some extent for themselves, so I usually refrain from using the term in relation to a particular person.
Speaking as a former educator, and a person who has spent MOST of his life among the common people, the peasants of this era, I can say with absolute assurance that the large majority of people are so ignorant, technically, that they don’t even know what peer review is.
So they cannot REALLY be faulted for not believing any thing emerging from opposition political camp, or whose originatiors are allied with the opposition camp.
I know some hard core Democrats, union guys, and a couple of black tradesmen, who privately say forced climate change is bullshit. But they DONT say so publicly for partisan reasons. I am convinced the average young liberal or average Democrat believes in forced climate change not because they understand the evidence ,or because it is REALITY ( it is) but because their ” in ” group believes.
Now having said all this, we should have sense enough to understand that the very large majority of people who work in law enforcement are honest, and that at least half of them are actually competent.
Knowing JUST HOW BAD things are in so many parts of the world due to corruption and incompetence in law enforcement specifically, and government in general, we ought to figuratively drop to our knees and thank the Sky Daddy or Sky Mommy of Our Choice that we live in a country with reasonably decent and honest cops and prosecutors.
BUT – and this but is as big as bus- a person must be rather naive to believe that the people at the very top are strictly interested in truth and justice.
In reality, police chiefs, prosecutors, heads and high ranking officials at federal and state agencies, county sheriffs, etc, to a very large extent OWE THEIR POSITIONS to their political allies, who helped PUT THEM IN their cushy high profile jobs.
And the bosses tell the underlings WHAT TO WORK ON, for the most part. The underlings mostly have to go along, or get fired, or transferred to the equivalent of North Dakota in winter or Louisiana in the summer to investigate fraud in the portable toilet service industry.
I do not doubt that Exon is guilty, morally if not technically, of a lot of crimes but the word has to come down from the top to jump into something so politically radioactive. I doubt the odds are any better than one in four that the word will be coming down.
Even if the relevant decision makers are sure Exon is guilty, they nevertheless have to decide how to best utilize the limited manpower available. There are always more crooks than they can get around to prosecuting, especially if the crooks have many powerful allies, and extraordinarily deep pockets, and entire large law firms staffed with great white sharks on retainer, and a conviction might not result in anything more than a fine.
Yes it has become tribal. Tell me again why we should respect that.
I have never maintained that tribalism is inherently worthy of respect in and of itself, but I do maintain that a good understanding of tribalism is critical to an understanding of the behavior of people and societies.
OFM says – “I do not doubt that Exon is guilty, morally if not technically, of a lot of crimes.” Okay, you cannot be on a jury. But, since you “do not doubt,” please tell us the rest of us!! We are dying to hear. No pun intended.
But, do not spit out the BS that they had some scientists that believed in global warming and they had a duty to spend billions of dollars warning everyone [they did publish everything]. And, since you said “a lot of crimes,” why not list the top 10?
Ron thinks that the world is past the tipping point. So, he should spend every cent that he has warning everyone – or HE is guilty of a crime? Give me a break.
But, if you can prove your no “doubt” you can make millions showing Green Peace and all of their ilk the way!!
WTF is your definition of a crime?? I am glad that you did not have a hand in writing the US Constitution.
So Exxon was evil. But, somehow, they had the top environmental scientists?? WTF??
Hi Clueless,
Google Exon and climate.
Perhaps I should distinguish between moral and technical crimes, which I failed to do in this case.
You may define an Exon crime as something that has happened recently, since operating under that name. I consider the history of the company going right on back thru various name changes and mergers, etc.
One of the biggest reasons large companies change their names and public faces is escape their history, allowing them to present a shiny nice new facade to the public , which has a short attention span.
The history of the oil industry is not much if any nicer than that of the tobacco industry.
Monopoly and cartel were the name of the game for half of its history. Read up on the Seven Sisters.
While I am technically an agnostic, and as a practical matter, an atheist, I hold to Christian morality for the most part, and do believe anybody in possession of information highly relevant to the public health and welfare has a moral obligation to disclose that information.
So – to me , funding climate science denialism, when you know differently, is a crime, morally speaking.
A considerable number of lawyers seem to be of the opinion that this is a technical crime as well. The company is or was , after all, misleading investors.
http://www.juancole.com/2016/02/exxon-mobils-past-crimes-against-the-earth-are-nothing-compared-to-its-present-ones.html
This is just a sample, you will find as much as you look for.
You better check the fillings in your teeth for those transmitters Bubba!
from Desmogblog of all places…
“It was a tumultuous week in the world of hydraulic fracturing (“fracking”) for shale oil and gas, with a few of the biggest companies in the U.S. announcing temporary shutdowns at their drilling operations in various areas until oil prices rise again from the ashes.”
http://www.desmogblog.com/2016/02/28/top-drillers-us-shut-down-fracking-operations-oil-prices
And if the sordid news for the frackers were not bleak enough on the bottoming out of oil prices, David Hughes — a former oil industry geoscientist and current fellow with the Post Carbon Institute — recently delivered sworn testimony to the North Carolina Utilities Commission that shale gas production will peak in 2017 nationwide and then begin a rapid productivity decline.
http://desmogblog.com/sites/beta.desmogblog.com/files/J%20David%20Hughes%20Affidavit-2-19-16.pdf
ezrydermike,
shale gas production will peak in 2017 nationwide and then begin a rapid productivity decline
That also threatens Canadian oil sand production which is dependent of cheap natural gas.
likbez,
The Montney will save them!
There’s a new thread on the Montney at PO.com, triggered by a question on the play a couple of days ago. There’s some good information there.
It also threatens TCP’s Energy East pipeline as it as repurposing of a west to east gas pipeline into a west to east dilbit/syncrude pipeline. The proponents of EE are selling the line that eastern Canada does not need western gas because of the “abundant” availability of Marcellus gas.
ezrydermike – A great summary paper with references, thanks much.
Synapsid – what is the link to the Montney at peakoil.com?
I can’t find anything recent.
I’m thinking there’s now such a gas glut that the Canadian West coast export terminals will stall for a long time, possible forever.
sunnnv,
It’s on the Forum Posts page (see the sidebar on the left side at the site). “Excitement building in the Montney.”
Despite strengthening oil prices, U.S. oil and gas rig count is down 13 units.
Oil rigs: -8
Gas rigs: -5
Horizontal rigs: -8
Directional: -5
Vertical: unchanged
All key LTO basins have lost oil rigs:
Permian: – 6 (to 156)
Bakken: -3 (33)
Eagle Ford: -1 (40)
Niobrara: -1 (15)
Cana Woodford: +5 oil rigs ; -4 gas rigs (apparently same rigs were re-classified)
Thanks for the oil post 🙂
I think everything is clear. Rigs are going down regardless of this uptick in the price since bottom of $26 because it is clear that if there is sustainable price for the majority of world production, contribution has to come from Opec and non-Opec. There will be no more waving of hands and their always new breakeven price OCD type of messages from shale crowd but very quiet departure in the sunset.
The rig count follows the price perfectly, BUT with a 3-month lag time. Unless mass implosion of shale corporations occurs within the next few months, expect the rig count to increase somewhat following the recent uptick in oil prices.
Also, some of the best experts on the oil business (such as Art Berman) believe that we have not yet reached rock-bottom in terms of prices. He expects a final “panic-bottom” to set in, driving the price potentially as low as $15, maybe $20, a final move that will probably deliver the KO blow to shale’s financiers.
This is of course far from certain, but it is a possibility. Longer term, the oil price has nowhere to go but up.
” expect the rig count to increase somewhat following the recent uptick in oil prices.”
I really doubt that will happen again. That already happened last spring and many got burned really badly.
As long as shale corps. will find any kind of financing, then they will keep drilling. The only reason that they have decreased drilling by so much recently is because their access to loans has been slashed. Their last line of defense is that they have managed to issue shares on Wall Street.
But at the end of the day there is way more conventional, deep water around the world that will not be drilled at these prices so on the global scale shale is just too small to make up a difference and eventually they will run out of sweet spots anyway. Shale is like one hit wonder like “99 Luftbaloons” from Nena in the 80’s 🙂
The long-term for US shale oil production is definitely down, also of US oil production in general. For that there can be no doubt. But there will be ups and downs along the way.
“conventional, deep water” is a bit close to an oxymoron for me. And is there really “way more” of it or has that just been wishful thinking as we’ve run out of other plays? Offshore oil exploration success has not been good recently. Admittedly there was a hit in the GoM from the BP disaster and now the price collapse, but in the past some of the best quality finds occurred in slow down periods. The discoveries I’ve seen recently have mostly been small gas fields. But Marathon and COP look to have lost interest. The decline rates for deep water are very high, not quite in the LTO league but requiring a lot of drilling to keep the production facilities at high capacity. For me that would present much higher risk to future price volatility than for what I would think of as “conventional” developments, so requiring bigger resources and/or guaranteed higher prices for FID decisions.
George, US is NOT the world. Canadian conventional drilling slowed greatly already a year ago. Deep water drilling plans off the cost of Africa and North Sea are also cancelled. Shell Arctic drilling is cancelled. Are you telling me that all these projects worldwide projects are equivalent to 3 mediocre Shale plays in US?
Volatility? Shale is synonym for volatility. So the rest of the higher cost world oil industry said “Let the Shale pump what it has to pump and then we will get back to oil business again”
George, I can assure you that the rest of the world, including US conventional, pumps oil not for the sake of practice but for the sake of profit.
So they will let Wall Street run their shale pet project to the ground and go back to business later.
Ves,
let Wall Street run their shale pet project to the ground and go back to business later.
Well said ! Simultaneous production of junk bonds and shale oil was probably the most recent of Wall Street “innovations”. Which under close look are always reincarnations of some old financial scam. In this case, in price range 0-70 per bbl it is just a Ponzi scheme or, at best, a speculative investment which fully relies on “evergreen” loans.
In a Ponzi scheme the operator pays returns to its investors from new capital, rather than from profit earned by the operator in the expectation of oil price rise. This is were “unlimited” Wall Street financing of shale bubble played the crucial role. It allowed carpet bombing of shale plays with wells and eventually led to the current oil price crash. And new profits to Wall Street. A new redistribution of wealth up.
As John Kenneth Galbraith said:
“Financial operations do not lend themselves to innovation. What is recurrently so described and celebrated is, without exception, a small variation on an established design . . . The world of finance hails the invention of the wheel over and over again, often in a slightly more unstable version.”
It will be very interesting to see the situation in oil market three years from now.
You have no argument from me concerning the LTO. I was commenting on the expectations for deep water. They are finding some oil but it appears to be less than expected, very expensive to develop and with high decline rates; and more often gas, which may be stranded in some places.
http://www.aapg.org/publications/news/explorer/emphasis/articleid/24608/egypt-stands-out-in-interesting-year-of-discovery
Last year’s top ten discoveries discussed above – top three gas. Sixth one will produce 60,000 bpd (i.e. need 66 of these per year to overcome decline).
If the Cairn find in 2014 comes in below half a billion barrels then no giant oil field ha been found since 2012 (and, although I can’t find a reference, there had previously always been one such find every year since well before WWII), and maybe ExxonMobil Guyana find will be confirmed (but even there it is being disputed by Venezuela.
Not just deepwater, but total global discovery rate continues to decline.
Most recent numbers from Rystad Energy:
“Rystad Energy estimates that only 9 Billion boe were discovered during 2015. This is 30% down from 2014 which was an all-time low.
For comparison, world oil production is in the order of 30+ billion barrels each year.
– As a result, only 19% of the produced conventional resources were replaced by new discovered volumes last year, says Nils-Henrik Bjurstrøm, Senior Project Manager, in Rystad Energy.
Regrattably, the negative trend continues. In January 2016, only 250 million boe were discovered (in comparison, the Goliath field in the Barents Sea has reserves of approximately 200 MMbo), indicating a possibility for an even lower exploration result in 2016, says Bjurstrøm.”
http://www.geo365.no/olje-og-gass/another-all-time-low/
AlexS – if the oil/gas split was 50/50 as the aapg report indicated then only 15% of oil was replaced and about 25% for gas. I think it’s questionable how much of deep water gas can be developed easily – it probably needs FLNG in a lot of cases.
The report indicate 80% of the top finds were deep water. If a lot of that exploration has been stopped now (and probably through at least early 2017), things are looking quite bad. Will there even be an exploration capacity of any significance left when prices do rise again?
For the futue it looks like not much coming on line 2018 to 2022, then maybe a bit of a pick up of 2 to 3 years for projects started as prices rise (say late 2017) but then nothing much at all as no new prospects in the pipeline.
At this rate it will take 150 years to find the 3 extra Saudi Arabia’s the EIA (or was it IEA) said we needed a couple of years back.
George,
Whatever is found is found. You can’t do anything about it. But there are many things that can be done starting from the Fed monetary policy to just simple less consuming.
If you look at global oil production what is the first that you should recognize? Inequality. Inequality from the cost of production point of view and inequality from the consumption per capita point of view. Well the answers are there. Save and don’t waste. We are just passing passengers on this planet and there will be many passengers after us and we don’t have to use all of it.
Alex,
Despite strengthening oil prices, U.S. oil and gas rig count is down 13 units.
Quantity at some point turns into quality. Now there two ranges of oil prices that matter for shale: 0-70 and 80-infinity. With “hope” range 70-80 in between.
Strengthening of oil prices within the range 0-70 probably no longer matter much for indebted shale companies and their production and by extension rig count. Investment climate changed and will remain generally very cautious in this range, taking into account the possibility of yet another price slump (for example, if the price recovery overshoot; or Libya civil war ends). Mad drilling with negative cash flow is probably the thing of the past. Taking over the companies by lenders will be a more common practice than rescuing them.
I think range 0-$70 now represents “death valley” for shale in which only the “dead cat bounce” of production is possible. Investors might not return in-full before the price reach about $80 and stays at this level for a while. Because, those who were burned and balanced on losses around 60% on their loans (40 cents on a dollar) probably understand, that it just does not make any economic sense. Any belief in “shale miracle” if such existed is now busted.
What we have now is as Ves said, “a very quiet departure into the sunset”.
Of cause, we can play with numeric ranges, but you got the idea.
The E&P companies have set their budgets and placed drilling contracts. What the price of oil does over the next three to six months won’t make much difference to the rig count. It may influence completions though as they can be conducted on a faster turn around. ND has lost three rigs and is likely to lose up to another ten rigs in the coming weeks as Whiting and Continental shut down drilling, QEP and Hess reduce to one or two rigs only, and maybe a couple of the smaller private companies go bust.
George,
The E&P companies have set their budgets and placed drilling contracts. What the price of oil does over the next three to six months won’t make much difference to the rig count.
IMHO it does not matter how shale E&P companies behave. Cards are stack against them and they are in a trap. It’s Minsky moment for them, when euphoria is gone and the harsh reality started to assert itself. So the meaning of the number of rigs now is very similar to sweating of the patient in the famous anecdote when a doctor asks the nurse “Did the patient sweated before dying? Oh, yes. Very good, very good”.
For conventional oil it is a completely different game and there can be some Renaissance.
My point is that for “below $70 range” ( +-$10) shale companies will remain in a “slow dying” mode. Availability of “sweet spots” does not improve with the age of the field. Loans availability is either gone or severely cut and cash flow is either negative or barely enough for the maintenance and for “evergreen” loans interest payments (speculative mode of production according to Minsky). Most of them suffer from the high level of existing debt.
Also their costs rise with the rise of oil price if only because they consume a lot of diesel fuel (if we assume EROEI 5 you need 8 gallons of diesel per barrel of oil, so effectively your barrel contains only 42-8=34 gallons). Only a fraction of the price rise improves their economic conditions (a large part of the “increased efficiency”, lower cost of production blah-blah-blah was based on the same effect but acting in the opposite direction). The problems also might start when investors realize that they have a better chance to recoup their investments by taking a hold of assets in a rising oil price envireonment…
AlexS, note that in the 1998-99 price crash, oil rigs did not bottom until a few months after the OPEC cut.
This time may be different, remains to be seen.
At $50.28 WTI companies lost record amounts and generally have PV10 all categories equal to long term debt, with radical reductions in future estimated production costs and development costs. But all are eager to show they can operate lower than their peers. Also, the stock market seems to get ahead of itself. Look at today, for example.
Trading $14+ below last year SEC prices, all is not yet well. A DOUBLE in price is needed, but likely will not occur in 2016.
shallow sand,
During the 1998-99 oil price crash, oil rigs bottomed in early August 1999, 7.5 months after the bottom in oil prices. The decline lasted about 2 years and was very deep: from the peak of 429 oil rigs on August 8, 1997, to 98 on August 6, 1999 (-77%).
The recovery in oil rig count was muted and lagged the increase in oil prices. Both prices and rig count started to decline again in 2001
In 2008-2009, the U.S. oil rig count was declining only for 7 months. The drop from peak to lowest point was smaller (-60%).
The recovery in rig count followed oil prices with a 6-months lag and was very strong, as that was the early stage of the tight oil boom.
AlexS. Thank you for the information.
You are always on top of the numbers. I appreciate that very much.
It is clear that unlike 2008-09, this time, the rebound in oil prices and U.S. drilling activity will not be V-shaped.
Oil rig count is already declining for 16 months (not accounting for a false recovery in mid-2015), and is down 76% from the peak in October 2014.
Although oil prices are up more than 35% from February 11th low, there will be more volatility ahead, and we cannot be sure if we are already past the bottom of the current down-cycle.
Oil companies’ financials are in much worse shape than in 1998-99 and 2008-09.
And as George Kaplan said, “The E&P companies have set their budgets and placed drilling contracts” for 2016.
So even if oil prices do not drop again, oil companies are likely to first focus on drawing down their inventories of DUCs.
I think that oil rig count will continue to decline at least until mid-year, and the recovery will be even slower than in 1999-2000.
Canada oil rig count is slowing down drastically and ahead of the normal seasonal slowdown if I remember correctly.
Oil -33 (50)
Gas –13 (79)
Part of the reason for this drastic drop in Canada is El Nino or Global Warming of this year depending which side of the debate you are on 🙂 FBI is working on to determine which one it is 🙂
On a serious note the ground has thawed unusually early this year. Road bans are already in effect about month earlier than normal.
Also we have to be aware that budgets are approved every quarter for drilling and nobody is willing to sink drilling budget at these prices in Q2.
thoughts on this?
“As we said last week, the significant highs and lows in markets over history have been marked by some form of intervention (whether it be public or private policy actions). Of course, we’ve been predicting some form of intervention, and soon, to remove the systemic risk posed by persistently weak oil prices.
It just so happens that key markets (oil, stocks, interest rates) all bottomed on February 11, and have move sharply higher, in unison, since.
What happened on February 11? You guessed it. Intervention.
We’ve said that the best suited for the job of intervening to stem the threat of weak oil prices would be the Bank of Japan. They are already in the thick of their own version of QE infinity. They’ve told us clearly they will do whatever it takes to return their stagnating, deflation burdened economy to prominence again. And, after nearly three years of QE, they still have a long way to go. They’ve told us that higher stocks and a weaker yen are two important tools in their plan. And both have been going aggressively the wrong way for them recently, sidetracked by the broad financial market instability of recent months, which has undone some of their work.
So, indeed, the Bank of Japan stepped in on February 11 with some action.
They sold their currency, sending the dollar soaring against the yen. When they intervene in the currency market, they buy USD/JPY (i.e. they dump their currency – to weaken it – and they buy U.S. dollars). What do they do with those dollars? Perhaps they bought oil (oil ETFs, oil stocks, you name it). It so happens, Crude oil bottomed that same day and has spiked 35% since.
http://www.forbes.com/sites/bryanrich/2016/03/03/is-the-boj-quietly-intervening-in-oilcommodities/#27899c9b6056
Thoughts?
“It just so happens that key markets (oil, stocks, interest rates) all bottomed on February 11, and have move sharply higher, in unison, since.
What happened on February 11? You guessed it. Intervention.
So, indeed, the Bank of Japan stepped in on February 11 with some action.”
http://www.forbes.com/sites/bryanrich/2016/03/03/is-the-boj-quietly-intervening-in-oilcommodities/#27899c9b6056
Imagine that.
“U.S. Has Too Much Oil. So Why Are Imports Rising? None of this adds up: We are producing less, inventories are rising, while demand is at records and yet we are using more imported oil?”
http://www.zerohedge.com/news/2016-03-04/us-has-too-much-oil-so-why-are-imports-rising
The Baker Hughes Rig Count came out earlier today. US rigs down 13, oil rigs down 8, gas rigs down 3. Canada oil rigs down 33, gas rigs down 13.
http://www.platts.com/latest-news/natural-gas/buenosaires/argentinas-ypf-targets-growth-in-gas-output-lower-21432753
“A continued focus for YPF will be on reducing per-well shale drilling and completion costs, now at around $7 million for vertical wells and $14 million for horizontal wells with 18 frack stages.”
“A continued focus for YPF will be on reducing per-well shale drilling and completion costs, now at around $7 million for vertical wells and $14 million for horizontal wells with 18 frack stages.”
Does Unconventional D&C really cost that much more out of the US? Gotta to be a gusher to pay out @ $14 million.
Short answer is yes, it does. It is mainly a function of location, as even D&C costs can vary by location in the US. Infrastructure counts for alot in costs.
My understanding is that one of the big pluses of Argentina is they have price controls for domestic production. Right now they are artificially high and it provides predictability for the producers.
The Kurdish export pipeline through Turkey (600,000 BOPD) has been shut down since mid February. An article about it is referenced in the link below.
http://foreignpolicy.com/2016/03/02/a-mysterious-pipeline-closure-is-bankrupting-iraqi-kurds/
Genel Energy is one of the major developers of the Kurdish fields. They have just announced a 48 percent reduction in the EUR of the Taq Taq field, and project future production declines.
http://www.genelenergy.com/media/1900/genel-energy-taq-taq-reserves-update-290216-final.pdf
dclonghorn.
Amazing how the traders and US business media haven’t been all over these stories?
I try not to be conspiratorial, but a 600K bopd pipeline being down and a huge reserve write down in Iraq would have moved markets up in times past, and would have been mentioned ad nauseam.
Iraq has been a major contributor to oil production growth, so if it cannot continue to grow, Ron’s hypothesis that 2015 is the peak gains greatly in my view.
ss,
It is not in the news because the whole thing around Kurdish oil is geopolitical and not strictly business. And if it is geopolitics everything has to fit in certain narrative in order to be printed. That is the way it is.
What that 600k pipeline closure means is that Iraqi Kurdish oil is not gone but it will be redirected to the south of Iraq and south export terminals and not north, towards Turkey, as it was until now. Main looser is Genel and GOM very good friend Tony aka “Don’t interrupt my sailing while Macondo is blown up”.
It is odd that neither of these stories have gotten much traction in financial or other press. It seems that the “Iran is raising production 500,000 bbls per day” story was repeated in article after article for weeks.
The shutin of 600,000 Kurdish bbls per day draws scarcely any attention. The mystery about why the shutin occurred and how long it might last is intriguing. There may have been an attack on the pipeline somewhere within Turkey, or the Turks may have just shut it in, perhaps in relation to what’s happening in Syria. The reason for the shutin is unclear, and you would think the media would be all over this story, but they are not.
Nexen’s shutdown of their Long Lake facility took about 50,000 bopd out of production in mid January. It occurred because of an explosion at their upgrader. The company responded by supposedly shutting down the entire facility. I’ve been trying to get information on when it might come back on line, but haven’t found much of anything past the explosion and shutin.
For some time many Canadian producers have said they cannot shutin their steam driven production because it will cause formation damage and other unspecified problems in the future. I’ve been wondering how that effects this project which was shutin. It seems this story would also be getting some media attention, but its not.
Of course the 48 percent reduction in Taq Taq reserves did receive some attention, especially in regards to Genel’s investors. The thing I wonder about is the potential for contagion. So are other massive carbonate middle eastern structures also likely to see declining production and reserves soon?
Just another note on Taq Taq.
Genel’s website listed 2015 average production at 116,000 Bopd. Their reserve update projects 2016 production at around 80,000 Bopd.
Turkey is gradually stepping up its efforts to be a big regional player, and the Kurds are a huge thorn in their side. The Kurds are perhaps the biggest ethnic group in the world without a homeland.
So, I’m guessing the Turks shut down the pipeline. An autonomous Kurdish region in Iraq is the last hing the Turks want.
Erdogan is an incredible hypocrite. He criticizes Israel for its action against Palestinians, but has himself spearheaded a much more aggressive campaign against the Kurds (with far more civilian lives lost).
The Armenians have quite a beef with turkey as well.
dclonghorn,
I agree that there isn’t much coverage in the financial press of the shutdown of the Kurdish pipeline to Turkey. The pipeline has been sabotaged repeatedly for quite some time now, in a war zone so it isn’t always possible to find out who did it–Ankara has said both that they can’t be sure it was bombed, and that the PKK did it. Since Ankara throws out “PKK did it” for most anything nowadays I remain skeptical.
The PKK is based in Iraqi Kurdistan but would in this case be acting directly against the interests of the Kurdish effort there if they did indeed “break” the pipeline. Turkey gets along well with the Kurdish Regional Government of Iraqi Kurdistan but considers the PKK terrorists (so do the US and the EU.)
If you want to stay fairly abreast of this and similar goings on, three websites that are very helpful are Rigzone, OilPrice.com, and DownStreamToday (under the headings Refining and Pipelines.) Of the mainstream media, I’ve found Reuters to be the most useful.
Thanks for the info. It seems that just keeping track of who is friendly or unfriendly in the Iraq, Syria, and Turkey areas is difficult. It must be horrible for those who live there.
Looking at the primarily conventional states again.
Per Kansas Geological Survey
1/15 daily oil production: 134,471
11/15 (most recent month reported) daily production: 106,318
These figures are backed up by EIA. There is some horizontal Mississippian production in KS, and it is down significantly, but so are all the larger production conventional counties.
This is a 21% decline in under one year.
Per the Utah Department of Natural Resources, Division of Oil, Gas and Mining:
1/15. 110,594 barrels of oil per day, 5,127 producing wells, 772 shut in, 169 T’A.
12/15. 88,469 barrels of oil per day, 4,796 producing wells, 1,157 shut in, 149 T’A.
Again, these numbers fairly correspond to EIA.
This is decline of 20%
Anecdotal, I agree. Have to wonder if declines this steep have occurred in other parts of the world?
I am an American through and through. But, I will admit that, not only do we have very short attention spans, but we tend to hyper focus on things. I have hyper focused on shale like the rest, but I at least realize there are many places where production has absolutely tanked.
Many think lower for much longer. It could very well be that once the hype in the US turns, things could go quickly.
WTI is up almost 40% since 2/11/15, 15 trading days.
As AlexS pointed out, there will likely be at least a 6 month lag until US activity pick up. He thinks longer, and it makes sense. Balance sheets need major repair. Believe me, speaking from personal experience here.
I do not foresee a straight shot up, but the world has lost a lot of oil due to this crash IMO.
ShallowS,
Many think lower for much longer. It could very well be that once the hype in the US turns, things could go quickly.
I think Obama administration might object, as they need another 10 months to drive into the sunset 🙂
Dominant (sustained by propaganda machine) myths like “oil glut”, “storage overflow”, fight for market share and mass overproduction by oil producing countries (except, of course, the USA, where shale producers suffers under brutal attack from Saudi Arabia 😉 have now a life of their own and are difficult to change even when completely detached from reality.
IMHO for “things go quickly” we need a trigger event that suddenly becomes a focus of news coverage. Some large bankruptcy. Whatever. May be March 20 meeting in Moscow can serve as a trigger for some short squeeze, despite the measure to be taken is an old news. But just the level of determination of oil producing countries on this meeting might be interpreted as an important market signal.
shallow sand,
The time lag between rig counts and actual production stands around 2 to 4 years for the general oil production index, which includes conventional and unconventional off- and onshore production (see below chart). In my view the time lag for shale is just six months and for conventional production it is at least 18 months. As an example in 2005 a doubling of the rig count did not raise oil production until 2009.
If rig counts stay low until the end of this year, production is set for a huge decline over the next year. Some interpret the still high production at low rig counts as a miracle improvement in rig productivity. If this is the case, the rig productivity must have been extremely low about four years ago when a high rig count gave a then still low production. So where does the huge turnaround come from?
In addition to the above chart I have made also a short study on US rig productivity- measured as how much production one rig contributed to the overall production index. Rig productivity of 1 means one rig contributes one point to the index, which is about 70 000 barrels per day as the index stood at 100 in 2012 when total US production has been 7 mill/d. Rig productivity of 0.1 shows, contribution to overall production is just 7000 barrels per day.
Although the rig productivity does not account for labor and other costs as well as the time lag between production and rig counts, it is a rough measurement how much one rig contributes to total production. It shows clearly, the rig productivity did not improve over the last decades and shows rather a declining trend.
Any possible economic improvement over the last years must have come from reduction of labor or construction costs of rigs.
Finally got around to reading the MIT study linked to back in
http://peakoilbarrel.com/oil-price-and-its-effect-on-production/#comment-561018
http://news.mit.edu/2016/carbon-tax-stop-using-fossil-fuels-0224
says we must have a carbon tax, or we won’t stop using fossil fuels.
The paper is open access and online at:
https://www.aeaweb.org/articles.php?doi=10.1257/jep.30.1.117
“Will We Ever Stop Using Fossil Fuels?”
They look at the posted reserves of oil and gas as staying about the same year after year,
as measured by ratio of proven reserves to production, and say:
“If the past 35 years is any guide, not only should we not expect to run out of fossil fuels any time soon, we should not expect to have less fossil fuels in the future than we do now. In short, the world is likely to be awash in fossil fuels for decades and perhaps even centuries to come.”
They get their info from the BP Statistical Review,
but it doesn’t appear to me that they nor BP account for price fluctuations that until just recently greatly increased reserves, and now those disappear; but more importantly, they don’t account for unconventional resources. Nor do they deal with the dubious nature of OPEC’s reserves, which magically don’t decrease.
So the decline in conventional reserves is masked by “new” unconventional, and they conclude peak oil is impossible for decades or centuries, because they are clueless that:
* there is in fact a difference between conventional petroleum and unconventionals.
* how fast the LTO declines (or how costly they are to develop).
* how slow and costly the oil sands are to develop
* peak oil is about the size of the tap, not the size of the tank.
No mention of EROEI either.
They’re from MIT, and refer to Morris Adelman, and also cite the Breakthrough Institute.
Despite being ace researchers, they can’t seem to find cost of new production, so they quote the EIA’s success rate chart of new development and exploration wells, as a supposed proxy for continually improving efficiency, therefore cost reduction.
OMG Ivory.Tower.Insanity
NOTICE: I won’t have a new post until late Monday after the Baker Hughes monthly international rig count comes out. I could put up an open thread but since things are really slow right now I don’t see any need for that.
Question for OFM
You had some good info up thread concerning a automobile bursting into flames in an accident [regarding Aubrey McClendon]. But the Daily Oklahoman said that his vehicle had been converted to run on CNG. So, does your analysis still apply?
Hi Clueless,
I can’t say for sure, since I have just about zero experience with cng, but the potential for a hot fast fire is definitely there.
Propane, MAPP, acetylene, etc are commonly used in welding and automotive repair work,everywhere, but cng is a rarity in my part of the world.
The sources of ignition of any escaping fuel are most often up front, namely the hot engine and any sparks resulting from a collision,so that’s where car fires usually start.
It takes a LOT of heat to get a car fire started, so not many burn , except when leaking , burning gasoline provides that initial burst of heat. Sometimes a fire starts in the interior, due to faulty wiring. By no means are all the wires in a car protected by fuses.
ANY car will burn like hell , due to the high content of paint, plastic, carpet, floor mats, grease, oil, transmission fluid, seat cushions, undercoating , sound proofing insulation, tires, etc, all made from OIL, never mind the fuel itself, once it gets going.
many “CNG conversions” are “bi-fuel”, meaning they maintain the gasoline tank.
Often in that case, one starts on gasoline, then switches to CNG (Compressed Natural Gas).
My impression is that most “conversions” (factory option or aftermarket) are bi-fuel, except for some fleets (garbage trucks, delivery vehicles, buses, etc.) that have a limited travel radius and a fixed home base.
I couldn’t find a 2013 Tahoe blurb, but the factory option from Chevy for pickups was bi-fuel:
http://www.greencarreports.com/news/1073663_2013-chevy-gmc-natural-gas-bi-fuel-pickup-trucks-announced
This guy reports on his earlier model aftermarket conversion (bi-fuel) of a 2011 Chevy Tahoe:
http://www.cngnow.com/blog/post.aspx?id=39
The point being is that a lot of them are going to have a gasoline tank still, with all the “issues” that OFM mentioned.
The CNG tanks for vehicles have flow restrictors and are engineered/tested to be fairly safe. They also have an expiration date.
CNG is usually (still) odorized, so any leaks are apparent by smell.
Natural gas is lighter than air, so tends to drift up.
The apostle of fracking
“I suspect, however, that Aubrey McClendon will be remembered not for these transgressions but for helping to usher in an era of abundant natural gas, a weakened OPEC and a grievously wounded American coal industry. We are all living in the energy world that he envisioned a decade ago.”
Search “the apostle of fracking wsj ”
http://www.wsj.com/articles/how-aubrey-mcclendon-led-todays-energy-revolution-1457117234
This in the financial Times re Pemex:
“Oil production averaged 2.267m barrels per day, 6.7 per cent down on 2014”
6.7%!!
Forecasts of U.S. rig counts and oil production in key LTO basins:
http://www.platts.com/latest-news/oil/houston/baker-hughes-us-oil-rig-count-slips-to-lowest-21047118
“Our revised rig count forecast reflects the incremental weakness and model another 15 land rigs falling per week for the remainder of the first quarter,” Evercore ISI analyst James West said in an investor note this week.
“That equates to [a first-quarter average of] about 525 rigs and exiting the quarter at just around 425 working land rigs,” West said.
This week, 465 land rigs were working in the US, Baker Hughes data showed.
But all rigs are not equal in a falling rig count environment, and the later ones to come off carry more weight, Dave Pursell, managing director of investment bank Tudor Pickering Holt or TPH, said at Platts’ North American Crude Summit Thursday.
Pursell said the first 100-200 rigs that were idled in early 2015 did not impact supply at all because they were drilling marginal fields. These included the non-core Bakken Shale in North Dakota and Montana and the complex Tuscaloosa Marine Shale in Louisiana and Mississippi, where the industry was just starting to figure out the geology when oil prices fell in late 2014.
But now that the oil rig count has been pared down from 1,609 in late 2014, “every tranche of 150-200 rigs start to have a bigger and bigger production impact,” Pursell said.
Pursell, looking ahead, said that while shale oil production in the Permian is projected to grow this year — TPH estimates 1.96 million b/d against 1.90 million b/d in 2015 — Eagle Ford output is going the other way.
The South Texas basin should see 1.33 million b/d, down from 1.56 million b/d in 2015, Pursell said.
Both basins will grow, with the Permian topping 2.5 million b/d by 2020, although the Eagle Ford may drop as low as 1.2 million b/d next year before resuming growth in 2018 and reaching 2.25 million b/d in 2020, according to TPH estimates.
“We think Bakken, Eagle Ford and Permian grow within cash flow or [keep] flat production at $55/b,” Pursell said. “You probably don’t get as much price inflation because you’re not rushing out to do all this stuff. This is a big deal.”
Alex,
Are they relying of EIA forecast of the oil price curve ? That’s a critical question. What EIA publishes can’t even be called forecasts based on their track record. This is more like primitive linear extrapolation. If you do not believe me look at their price projection for 2016 from 2012
Also the estimate of breakeven price ($55) is much lower then Art Berman’s estimates for each of three major plays.
http://www.macrovoices.com/publications/guest-publications/1-the-origins-of-the-global-oil-price-collapse-and-potential-investment-opportunities/file
Which is:
BAKKEN ($8mm D&C) ———— $65.24
EAGLE FORD ($5.7 mm D&C) —- $67.43
PERMIAN ($6.5 mm D&C) ——- $70.51
I tend to think that Art Berman is closer to the truth and this guy is too optimistic. The price zone below $70 bbl for shale producers now is a “death valley”, although some companies might be able to survive relying on dilution of stock and speculative “evergreen” loans, if financial conditions for shale oil junk bonds do not deteriorate further.
Any projection of production for more then a year should now be taken with the grain of salt as neither the trajectory of oil prices nor the trajectory of the US economy are predictable. I also wonder how they estimate the depletion of major shale plays (as in lower EUR for newer wells).
Most economists think there will be no recession this year (partially due to low oil prices). But if oil prices rise dramatically in 2017 the US economy can sink into recession pretty quickly and recovery of oil prices and oil production might be postponed or reversed.
Are high oil prices really a cause of recessions?
“Are high oil prices really a cause of recessions?”
They have caused a deep recession in early 1980s.
High oil prices also contributed to the great recession in 2008-09, but were a secondary factor.
If oil prices rise to $70-80 in 2-3 years, this would not have any meaningful impact on the global economy.
High prices 2010-14 did not seem to have much effect. Since the U.S. produces a lot of oil, you would think it would have the opposite effect to some extent.
Greenbub,
Or, more correctly, they were offset by money printing by the Fed.
When Glass-Steagall was abolished, the door was opened for what some like to call, “Capitalism run amok.” (https://en.wikipedia.org/wiki/Running_amok )
Investment banks realized that reckless, callous blowing of bubbles and using exotic instruments like derivatives is the most effective way to enrich themselves (and than force public to bail them out — privatize gains, push to public losses). With money printed by the Feds banks started to blow shale bubble providing ample financing to all shale companies and simultaneously started to inflate junk bonds bubble (http://www.csmonitor.com/Environment/Energy-Voices/2014/1203/Oil-prices-plunge.-Is-a-shale-bubble-bursting):
That is a fascinating story about how efficiently neoliberalism redistributes the wealth up from people like Shallow Sand to people like Jamie Dimon or from 99% to top 0.1%.
Increasing the Money supply has very little effect (almost zero) on the economy when interest rates are very low.
This is often referred to as the zero lower bound on interest rates. Monetary policy (“printing money”) acts primarily through interest rates. When there is more money, interest rates decrease, but when they get close to zero they do not usually become negative in nominal terms (though in “real terms” they can, when interest rate minus inflation is considered).
Bottom line, “printed money” simply ends up as excess bank reserves which have essentially zero impact on the economy.
I do not agree that $55 (assume WTI) is enough to keep the basins flat or grow production, without significantly more cost reductions. The company 10K, demonstrate that. Not enough future net cash flow. Especially as those calculations are sans interest and g & a.
Again, the average Bakken well produces 190K in 60 months. 152K is assumed 80% NRI.
152,000 x $48 per barrel (assumed $7 basis discount) is $7,296,000.00
$7,296,000.00 less 10% severance = $6,566,400.00
Subtract gathering of $1.50, LOE of $8 and G &A of $2.50. We are now at $4,742,000.00. This isn’t enough in 60 months for a well that costs $6.5-8 million.
These guys just throw out prices, never any substance behind what they say. For once I would like to see an article that walks through the numbers and proves us wrong, but they can’t, so they won’t.
Sure, a standout well can work. Our standout wells work at $20. No one has only standouts, unless they are fairly small.
What is NRI? Net Return on Investments? I googled and could not find even that.
What is LOE and G&A? What is severance? Is it a form of tax; local, state, or federal?
Thanks for your calculations. It spells out clearly that the drillers are losing their shirts right now.
NRI is Net Revenue Interest. The Net revenue to the producer LESS Royalty. SS is assuming a 20% royalty to the mineral owner.
LOE is lease operating expenses. Pumpers, well treatment, etc
G&A is General and Accounting. Things like human resources, overhead, legal
Severance are taxes paid on production. Varies from state to state but everyone who gets a check pays. Royalty and Working Interest owners.
These are all ongoing costs associated with producing a well and can add up over time. It is not just about how much does it cost to drill a well.
Thanks, Reno.
G&A is General and Administrative expense
yes. misspoke. I view it as overhead and the cost of keeping the doors open.
There is a reason why small operators can drill and operate wells that larger companies and the majors can not. And vice versa.
Gary, sorry for being less than descriptive on the various expenses. Also, thanks guys for filling in the blanks!
Keep in mind, every well is different in productivity and cost. I am just trying to lay out a middle of the road well.
For companies, I still say look at the estimated future cash flows and the long term debt. Note the reductions in production and development costs, in relation to the reductions in proved reserves from 2014 to 2015. Look at PV10. You can even guesstimate PV9, etc if you think discounting future cash flows by 10% is too much in our ZIRP era. (zero interest rate policy).
Note if you assume $80 WTI on my example well, you get up to $8,542,000 in five years. Helps a great deal, but still not a great return, especially if you fund the well with debt at 5+%.
Also, note I have left out the gas income, which does help out some, but sub $1.50 well head doesn’t get us very far. Assume 240K net mcf over 60 months. That just adds $324K. But gas at $8 adds $1.728 million, big difference.
Also, if you happen to have a well that cranks out 2 x 190K gross barrels in 60 months, whole different ballgame. That adds over $6.5 million. Those are the wells mentioned in press releases and investor presentations. Easy to see why one can be mislead.
You don’t hear about the wells that don’t hit 150K in 60 months, but there are many out there.
Really need to run the numbers, don’t just listen to the sound bytes. Enno’s info is invaluable, IMO.
Hey Enno,
You do realize that all these companies only drill above average wells, right? 🙂
DC – that applies only to companies that drill in Minnesota’s newest O/G discovery – the Lake Wobegon field. Discovered by Norwegian bachelor geologists:) We haven’t heard much about it because they are so quiet….
Dennis,
The thread is getting a little long, so let me answer your question here.
I have monthly oil & gas production on lease-level. Also individual well data & a well status history is available. This well status history doesn’t contain much information, but in many cases it is a reliable indicator about when roughly a well started production, and when it got shut in.
Using all this information, I created an algorithm that estimates for each well the monthly oil & gas production profile. Like you say, for leases with just a single well we can estimate the most accurate well profiles. We can group those accurate profiles for example on a yearly basis, in order to create “Standard production profiles”. We can use these, together with the (roughly) known start date for each well, in order to estimate the ratio of the monthly lease production that should go to each well.
There is much more information we can utilize (e.g. differences between operators/counties/fields, or keep refining the standard production profiles based on the more accurate well profiles before we deal with leases with many more wells), but I think so far the well profiles are already quite reasonable. It will never be 100% accurate, as we don’t know exactly what happened for each well. But because we can assign all lease production in this way to all wells, we can avoid structural over- or underestimations. As long as we avoid as much as possible structural biases, and because we typically are interested in the production profiles of a large group of wells (e.g. the whole play, or for an operator, or county), the resulting average production profile will get pretty accurate.
I have used similar algorithms in completely unrelated domains with great success, and had fun creating these.
So yes, because we have status information for individual wells, we even have information on how many wells are completed every month (and year). I suspect this information is not 100% accurate & complete, and probably also updated with a certain delays, but nonetheless quite informative.
Hi Enno,
Thanks. I found it difficult to find the individual well start dates.
This is a great project. A problem I see is that over time there will be fewer and fewer wells on single well leases. So in order to figure out output per well you would need to make assumptions about how much output is from the older wells vs the newer wells, that seemed a stretch to me, and was too much work as I don’t have nearly your level of skill in dealing with the large database required.
As I understand it:
You develop an average well profile based on single well leases (or multi-well leases where several wells started producing within a few months of each other).
You find start dates for all producing wells.
Using the well profile and start dates you can estimate the output from each individual well.
The estimates of output are fed back into your well profile estimates to improve those estimates.
Even if I don’t have this quite right. Awesome work!
Thanks.
Yes, this is basically how the algorithm works.
The RRC has a wellbore query system, where you can get more information about wells:
http://webapps2.rrc.state.tx.us/EWA/ewaMain.do
If you look at the completion info for the wells, you will find the type of well (e.g. horizontal), and when it was completed/shut in. This appears to be typically within a few months accurate.
I have posted an interactive presentation on the Permian here .
Enno! Thank you again!
I know the Permian data is preliminary. However, thus far it appears, on the whole, wells are not superior to any other US LTO play.
Any guesses from you on why it is favored by Wall Street, other than Wall Street hype?
My guess is as the play is newer than others, A. The companies did not have as much time to build up as much debt, and B. Rather than fund new wells with debt, a greater proportion have been funded with equity.
Again, just speculating. I would note the Permian focused companies didn’t seem to come out any better than the other plays, on the whole, in terms of estimated future cash flows at $50.28 WTI.
I will say, again without in depth analysis, that the Permian producers were more active hedging. Maybe more veterans at the top, who lived through pre-2000? I will say that is likely what got our generation complacent. 1998-1999 was involved, but little at risk then, so didn’t seem so bad.
Thanks Shallow,
As to my guess: no, I don’t know. I can’t see it in the preliminary well performance data so far. As Mike has mentioned, of course Texas rules in having all the infrastructure, service companies, and regulations in place. But are the well costs in the Permian so much lower than elsewhere?
The Drilling Productivity report from the EIA has the Permian rising from 900 kbo/d in Jan 2009 to over 1900 kbo/d in Sep 2015. You can see that in the Permian fields in Texas that are included in my dataset, the rise is 650 kbo/d. So more than 60% of the rise in production in the Permian overall comes from these wells (roughly half of this production coming from horizontal wells). By the way, if you over the mouse over the production profiles, you can see in the tooltip for each point also the number of wells included in that data point.
I found it quite striking that the average horizontal well performance has dropped quite a bit since the 2010 wells, despite the constant barrage of hype around new technologies, longer laterals, more stages, more sand & fluids, etc. Granted, there were only 40 horizontal wells in 2010, so it’s a small sample. Still, also here in the Permian I have not been able to find a significant improvement in enduring average well productivity over the last couple of years.
I think a rational shale company will wait until there is sufficient evidence that oil prices will be high for at least 1-2 years (or they have been able to hedge that far). The ones that were not hedged well during the last 1.5 year have really hurt themselves a lot by bringing online those shale wells with the whole flush initial production falling in the low oil price period. I am pretty sure that almost all these wells will never turn a profit. Of course, irrational shale companies may still benefit from their promotional campaigns, as even now billions a month are given to them by creditors who are looking forward to seeing those great returns.
I agree with your perception that very few people & no media are just doing the very basic calculations you have been doing to demonstrate the rough well economics, at least not publicly. I have no explanation for it. Perhaps there is not enough money to be made that way?
I also want to note that we both, and others, have demonstrated to be quite open to criticism on the calculations & info we have shown. How much good criticism have you received so far (that was not cherry-picked)? The only thing I have seen so far are more wild claims about future breakthroughs. I love the new term “superfracs”, I wonder what will be next?
Art Berman has suggested that the Permian was favoured at the moment for it’s high initial rates which give the producers a chance to cover this month’s bills. They are not looking further ahead than that.
Enno,
Thanks again for a great presentation
The EIA estimates Permian LTO output at 1,335 kb/d as of January 2016.
This includes Texas and NM parts of the basin.
Below is a chart based on the EIA data.
Conventional output = total Permian production from the February DPR – LTO production from the source below:
http://www.eia.gov/energy_in_brief/article/shale_in_the_united_states.cfm
I think, for LTO production, the EIA uses statistics from DrillingInfo. I find these numbers most accurate.
Permian basin C+C production by key shale formations + conventional (kb/d)
The EIA shows constant increase in Permian wells productivity.
But this due to the shift from vertical to horizontal rigs and from mature conventional to tight oil production
That said, the average new well productivity in the Permian is much less than in the Bakken and the Eagle Ford
Thanks a lot Alex,
This kind of feedback is very useful to me, as I must admit I haven’t spend too much time verifying the numbers yet. Even if I exclude NM for now, I still miss some LTO production in the Permian I see from your info. I wonder where that might be, because I did use the formations that are shown in your graph. If anyone knows of a mapping of Texas field names (as shown in the filter on the map in my post), and the formations shown here, then please let me know.
For the next update, I will try to complete the data some more, using the info you provided here.
Enno,
Do you include condensate production?
In some reports RRC provides separate data for crude and condensate
Hi AlexS,
Enno does not include condensate, only oil (or crude). The EIA does include condensate, and also is including New Mexico Permian C+C so we are not comparing the same thing. I do not know how much of the Permian Basin output in your chart comes from Texas and how much from New Mexico. There is also the problem of incomplete data from the RRC, for September this would be on the order of 10% too low for RRC data on a statewide basis.
EXXON: Industry Mired In Debt Has Destroyed Value “Encumbered U.S Oil Resources”
http://fuelfix.com/beaumont/2016/03/02/exxon-mobil-ceo-downturn-cuts-into-returns-production-goals/
Well, there you have it…….Exxon won’t bail out the LTO players.
John S,
Channeling Rockman over at PO.com here:
He points out that his billionaire owner has given him $250 million (quarter of a billion) to buy up worthwhile acquisitions and he can hardly find anything worth buying. Slim pickings indeed.
That quarter of a billion will be raised to one billion dollars if the new acquisitions justify it. If there isn’t enough available, though, the owner will close the company.
John S,
I should add that the company does not deal in LTO–conventional only. LTO isn’t the only area hurting.
Well aware of that. Rockman is not the only conventional guy lurking around these blogs.
1/4 billion won’t buy much either. But there are still a few conventional exploration opportunities. I’m sitting on a few myself hoping one day they will hatch.
Hard to find another Covenant field. 22+ million barrels cumulative 2004-2015 from 25 6,000′ wells located on 960 acres. But even it is off 1/2 from its peak production year.
The long term issue with shale is EOR potential. I cannot envision it. But I am not a geologist, very weak in that area.
Coffee has posted some about that.
If there were a way to get LTO wells to produce 75+ bopd, with low decline, for 20-30 years, cost effectively, now that could change my mind. That could get us to the high EUR’s.
Shallow
Check out Granite Oil’s site, especially their EOR project using field gas in the Alberta Bakken.
Crescent Point is having some success using waterflood in their unconventional work and are planning on bringing it to their ND Bakken holdings in the next few years.
Crescent Point will need that success, because their wells have performed very poorly so far in ND, as you can see on my blog.
Enno
I would love to access the info on your blog, but I have difficulty doing so.
I don’t know if it’s due my using my mobile phone for 99% of my internet stuff or simply because of my computer illiteracy.
I just spent ten ineffectual minutes trying to view CPG’s production data.
What I do know, is that their wells are very shallow and they claim D&C costs of 1.5/2.3 million dollars each.
Coffee,
I have no troubles viewing the website, even from China 🙂
I had to make some design choices. It’s not great viewing it on a phone, but a tablet or bigger screen should do fine.
ND lists 79 wells of Crescent Point. 42 of these also have a TD reported, the average TD is 18874. Not very shallow right? Do you have any info what they paid for their wells in ND?
I don’t have any info on the Canadian side.
Enno
I’ll do some more checking tomorrow, but it seems Crescent Point bought out Legacy Oil and Gas last summer, primarily for their assets in Saskatchewan.
The Bottineau county wells were just ‘thrown in’ as part of the deal. (Legacy had purchased Corinthian a year prior, which included some ND assets).
I do not know if/how this affects Crescent’s production profile, but CPG is considered one of the more innovative companies around.
No Coffee, no Bottineau wells included. You can easily see where they are located by selecting them on the first tab (the map)
Rush of demand for oil storage while oil is available at below $40 prices:
I think frenzied hoarding of oil in anticipation of higher prices is the phenomenon that MSM does not cover. They try to sell it under “oil glut” banner.
Possibly late to the oil storage game?
The only rational reason a businessman should be buying crude and paying to store it is that he expects the price to go up. A few businesses might prefer to own crude, rather than hedging so as to get it a known price, but most would rather use a hedge than own physical crude in storage.
Now the only REAL reason I can think of why the price of crude will go up is that ,everything else held equal, is a belief that producers are going to be sending LESS oil to market. In other words, traders and businessmen DO believe that producers obey market laws, and quit producing money losing oil, or at least oil that is not generating some cash flow, as soon as they can.
Any body who understands profit and loss also understands that a producer of any commodity who is desperate for cash may continue to produce his product even at an overall loss, so long as he is still putting his hands on enough desperately needed cash.
And not even the BIGGEST fool I have ever met would not argue that an oil company will invest money in new production that will cost say eighty bucks, with the price at less than forty, unless that producer is betting the price will be at eighty or more when he is ready to sell his new production.
There are exceptions of course, to these general rules, such as defacto enconomic warfare, price wars started to drive competition into bankruptcy, nationalism, leases that must be produced or lost, rigs rented that must be paid for regardless, etc.
Now here is a question for the hands on guys. WHY is there so MUCH storage capacity available? WHY was it ever built, and has it ever been full, or nearly so? WHEN was it built?
Something stinks.
If there really is a huge excess of oil flowing into storage, above and beyond normal quantities, and production is at the level it is reported to be, and consumption likewise accurately reported, exports likewise accurately reported, there should not be so much empty storage available, allowing imports to be continued from week to week and month to month at current levels.
The meme du jour seems to be speculators buying oil to put into storage.
Of course the alleged oversupply began to fill storage July 2014, and the purchase of oil to put in storage is . . . demand, isn’t it, but down went the price. In fact, it’s demand above consumption.
But down went the price.
tra la tra la
Demand or consumption, no matter how you call it, is final demand.
It excludes demand from speculators for oil that is then put into storage
Hi Watcher,
If you have stuff to sell and can’t find buyers, do you raise your price?
That only works in Watcher World.
Shallow Sand,
I was looking into potential EOR of shale fields. Based on what I gather waterflooding doesn’t work well at all, but CO2 & gas EOR show good potential, at least in the models that have been done. Here are some good papers on the topic:
https://dspace.library.colostate.edu/bitstream/handle/11124/78765/DONG_mines_0052N_10174.pdf?sequence=1&isAllowed=y
http://www3.aiche.org/proceedings/content/Annual-2013/extended-abstracts/P321849.pdf
KellyB
The EERC folks in ND probably have the most extensive EOR research programs ongoing at this time.
The 2015 Williston Basin Conference showcased numerous technological advances focusing on shale production.
The paper by Stephan Hawthorne showed that the high formation temperature in the Bakken (110-129C) was much more conducive to the use of ethane as its Mean Miscible Pressure was about half CO2’s.
The lab sample recovery rate of hydrocarbons was stunningly high.
One important issue about EOR is high costs.
According to the EIA, current CO2 EOR production in the US is ~285 kb/d, 3.3% of total C+C output, and 6.4% of conventional production.
The EIA AEO-2015 projects continued growth to 834 kb/d by 2040, which would represent 8.8% of total US production, or 16.2% of conventional production.
But this is based on the assumption that Lower 48 average wellhead price will rise to $136 in 2013 dollars.
Can this growth be achieved if oil prices stay much lower, at $70-80?
I am not sure.
I guess that EOR at tight oil wells is even more expensive.
So I doubt it could be a real game-changer, unless oil prices rise above $150 in today’s dollars.
U.S. CO2 EOR production (kb/d)
Source: EIA Annual Energy Outlook 2015
AlexS One thing I noticed in one of Kellyb’s links was the pressure for CO2 injection was 7000 psi.
That seems very high, but I am speaking from lack of experience. I do know that when injecting water, the higher the psi rate the higher the cost and the more problems that arise.
Hopefully someone can weigh in on this. For example, about the highest psi we have at the well head is 700 and the lowest is 150. But that is into sandstone formations at shallow depths. I cannot envision how water flooding tight formations would work, but I speak from complete lack of knowledge.
Kerosene, had to take a look at the physical properties of jet fuel, just to know some more, so I went to wikipedia for some help.
https://en.m.wikipedia.org/wiki/Kerosene
A short history, gotta learn something new everyday, even info before oil.
The Four Horses of the St. Mark’s Basilica in Venice have had a wild ride ever since they were plundered in 1204 common era, chopped up and shipped out of Constantinople.
Just too many years of sitting outside competeing with the elements and getting hauled around all over God’s creation took its toll.
http://art-crime.blogspot.com/2011/06/four-horses-part-four.html
The Four Horses were initially housed in Les Invalides, then placed on gate piers guarding the entrance to the Tuileries, before finally being placed atop the Arc de Triomphe du Carrousel, also in the Tuileries. But compared to their centuries of repose in Venice, their stay in Paris was over in the blink of an eye. A mere 17 years after their removal from Venice, and following Napoleon’s final exile to St Helena after the defeat at Waterloo in June 1815, Austrian and English engineers lowered them from the arch on 17 October 1815, under guard by Austrian soldiers . Two months later they were loaded onto barges and ferried across the lagoon and back to their old home. There they stood until air pollution forced their removal, in the early 1980s, to their present, much less lofty, position just inside the Basilica.”
http://art-crime.blogspot.com/2011/06/four-horses-part-four.html
Three hundred years of coal burning did some damage.
Then there’s Crazy Horse shaping up in the Black Hills of South Dakota.
Lots of dynamite and fuel used to get er done. Nobody will be able to steal the Crazy Horse monument. har
Looks like the range of oil prices below $70 which represents the “death valley” for US LTO production also exists for UK North Sea fields.
Most fields might degrade at natural depletion rate already in 2016. Which is up to 22%.
RT reports that if Brent price in 2016 stays in 0-70 range capex in the North Sea fields might be reduced by almost 90%.
According to the report of the British Association of oil and gas industry, with current prices, almost half of the oil fields in the UK produce oil at a loss.
Google translation of the RT article (abridged, and slightly edited)
https://russian.rt.com/article/150621
Ron, I am a regular reader of your blog and find it very insightful. I have not seen much written about Oil super contango and reasons for oil storage at multi decade high so would like to highlight below.
When there is a temporary over supply, it fills up storage, as more and more storage get filled up it leads to an increase in storage cost. This in turn lead to a contango, meaning future oil prices being at premium. Currently premium stands at 20% for 1 year forward contract. This is super contango and a bonanza for oil traders. If you can find a place to store oil you can make risk free returns of 20% – (storage cost). So, why storage space are filling up so fast its because commodity traders are scrambling to make this trade. It’s a positive feedback loop. It can only end when supply falls below the consumer demand.
So, bottom line is, filling up of oil storage early in the cycle is an indicator of oversupply. But in the current late cycle of low oil prices [1.5 yrs already] it is a useless indicator of future oil price movement, oil demand or supply.
Could also be shale oil companies preferring to sell their oil in the future at a higher price. Does anybody have that information from the analysis of financial reports?
I suspect farmers were buying diesel fuel in the past several weeks for field work coming up in the next two months.
Two million farmers buying 2100 gallons of diesel fuel is 42,000,000,000 gallons, 1,000,000,000 barrels of diesel fuel; there it was, gone.
A thousand gallon on farm diesel tank, pour some into the tractors, trucks, all which will hold another thousand gallons easy, you have your demand in storage waiting to be burned doing field work. The pickups have a one hundred gallon tank in the pickup bed for some more fuel, fill those too. Fill the combine too, add some stabilizer, you’re ready to go.
Plus a can of starting fluid for cold starts, just what you need to start a cold diesel engine.
Might as well order it before the price starts to rise in April. No sense in spending another fifty cents per gallon, that is another 21 billion dollars and might as well have it in the bank account for some fertilizer and soybean seed.
Just a hunch.
For anybody truly interested in nature.
http://www.theatlantic.com/magazine/archive/2002/03/1491/302445/
This is NOT for people into sound bites.
An this is where the real problem lies with this downturn, or bust. And this is why production will not just ramp up when prices get high enough. And lack of financing.
http://www.daily-times.com/story/money/industries/oil-gas/2016/03/05/energy-policy-expert-says-oil-slump-bust/81289608/
The amount of experience this industry is losing is much more distressing than the production decline.
Reuters oil price survey:
Oil prices expected to recover to around $70 by 2020: Kemp
http://www.reuters.com/article/us-oil-prices-kemp-idUSKCN0W91L3
Oil prices are expected to rise gradually over the next five years but will remain well below the pre-crash level, according to a survey of professionals who follow the oil industry.
Brent prices are expected to climb from an average of $40 per barrel in 2016 to between $65 and $70 per barrel by the end of the decade.
The price expectations are based on an email survey sent to more than 2,500 energy professionals working in oil and gas, banking, hedge funds, research, professional services, trading and specialist media earlier this month.
More than 800 responded.
The results are more bullish than the futures strip, where Brent is currently trading around $50 per barrel on average in 2020.
In the survey, there is a high degree of consensus about prices for the rest of 2016. Most forecasts for 2016 are tightly clustered between $35 and $45 per barrel. Nearly all lie between $30 and $50.
Brent prices have averaged just $33 per barrel so far in 2016, so most respondents expect prices to be slightly firmer in the remainder of the year.
But in the latter years covered by the survey there is far less consensus about what will happen, reflecting uncertainty about how far and how fast prices might recover from the crash.
The central forecast rises progressively by $5 to $10 per year between 2017 and 2020, but the range of expectations also becomes successively more dispersed.
Most respondents expect prices to rise to around $65 to $70 per barrel by 2020. But as many as a quarter think prices will remain stuck below $55, while another 25 percent think they will have risen to more than $80 by then.
Despite market chatter about a looming supply crunch as a result of cuts in investment spending, only 7 percent of respondents expect Brent prices to climb back to $100 or more by the end of the decade.
Alex,
I would greatly prefer the quotes with which you personally agree instead of the whole article.
There are several warning signs about this article:
Quick question: What is the average level of those professionals and how many of them are talking their books ?
Now another typical and dirty MSM trick in forming public expectations (very similar to use of polls in elections):
That’s great ! Now unwashed public knows the future. I think it is true the forecasts they got are tightly clustered because it is simply easier to answer what is expected from you (aka to give a “politically correct” answer) and avoid any personal responsibility ;-). Also such surveys have some propaganda value as they form people expectations. I am less sure whether they correctly report the true distribution of answers as some people are not shills and outliers are important.
I would like to ask a related and no less important question: the approximate number of bankruptcies among US LTO producers and amount of junk bond written off in 2016 if this forecast materialize.
I do not know where the oil prices will be in a year or two, but IMHO it is important to view skeptically Reuters info in general and their oil price survey in particular. Typically their value is zero or less. Reuters clearly belongs to the “low oil price forever” camp (like most MSM). Jeffrey Brown recently reminded us about similar position of The Economist (another respectable completely reliable MSM 😉 ) in 1999:
http://peakoilbarrel.com/the-ieas-oil-production-predictions-for-2016/#comment-558646
Generally this is the same situation as with S&P500 annual forecasts. Bought analysts from crooked firms talk their books.
http://www.cmegroup.com/trading/energy/crude-oil/light-sweet-crude.html
http://crudeoilpostings.semgroupcorp.com
A nine dollar per barrel difference there.
If KSA pumps 10 million bpd, mails out 7 million of them, uses 3 million per day for domestic consumption at a cost of 4 dollars per barrel, it will cost them 12 million dollars for three million barrels of oil and have an imputed income of 111,000,000 USD (3,000,000×37=111 million).
KSA really should pay tax on that imputed income and pay an amount to the IRS. har
They’re really getting the oil for free, who is charging them a price for their oil? Nobody.
An in kind tax on ten million barrels would be 1.5 million barrels at a 15 percent tax rate.
KSA should really forfeit 547,500,000 barrels of oil each year to the International Oil Storage Depot, after the oil is sold, the money should go to the International Monetary Fund to help finance future oil exploration.
It is not fair that the KSA has all of that oil and doesn’t contribute its fair share to the rest of the world. They’re getting a free lunch, if you really think about it. har
Also, KSA receives more sunshine too, so KSA really needs to share that sunshine too. They have more oil, more sunshine and the rest of the world has to pay for it all! It’s not fair!
Here is my question.
Is deposited oil depleted?