A Guest Post by George Kaplan
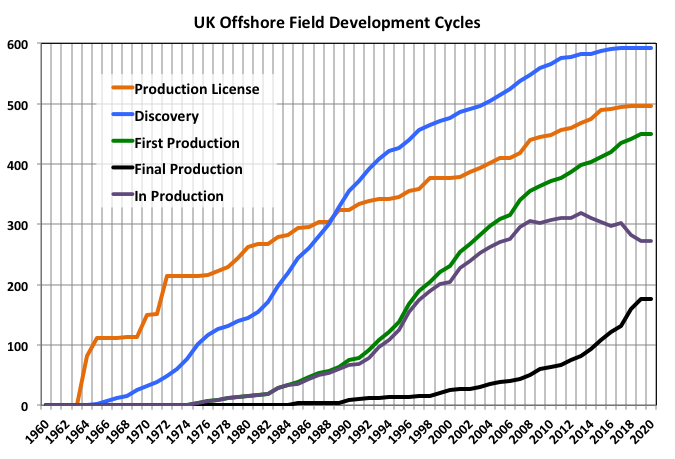
Discoveries and Development
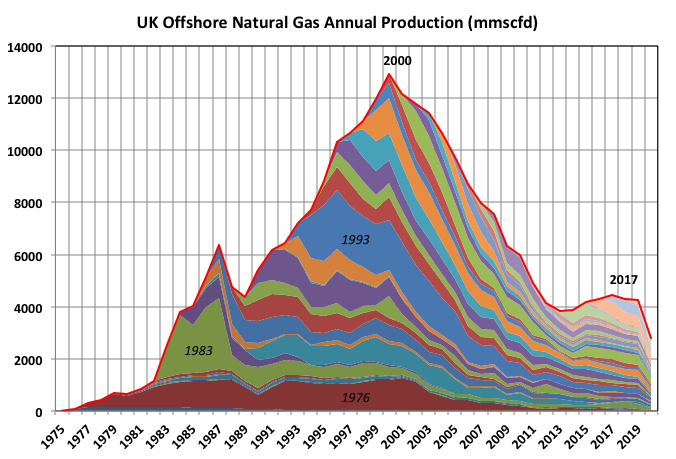
The global peak in oil and gas production for UK occurred in 1999 and 2000, probably delayed by four or five years by the Piper Alpha tragedy, and will not be approached, far less exceeded, again. There have been two other local peaks, each one preceded by about ten to twelve years by a local peak in the number of discoveries. The UK Oil and Gas Authority does not publish individual field resources, but it’s a fair bet that the large fields were discovered early on and most of the recent discoveries are small, near field tie-ins.
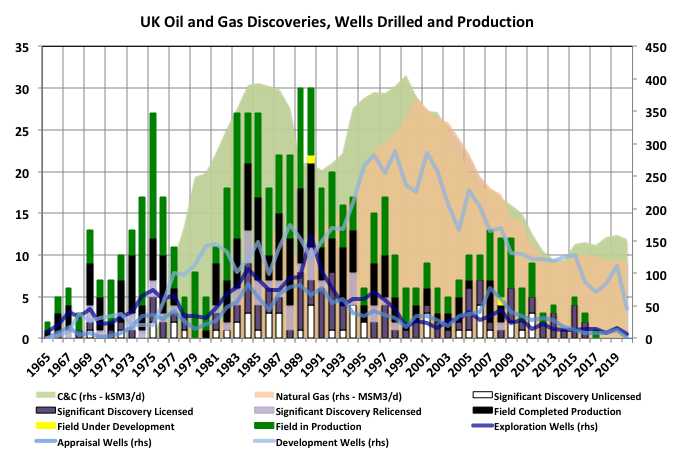
There are presently only a couple of new licences under development, both single wells, but a few more being redeveloped (not explicitly shown). The significant discoveries that have not been developed, especially the older ones, are either small or complicated developments. The unlicensed tracts are particularly at risk of becoming stranded, as any development is entirely dependent on existing infrastructure, much of which is approaching decommissioning. Tracts that are available for relicense have been relinquished by the original licensee, either after production from a main field has ceased but smaller resources are still available or after initial appraisal has proved unpromising.
There may be some recent exploration successes not included as operators have three years to officially declare a discovery, but these are likely to be few and small, except for a couple of gas fields.
Drilling activity is considered further below but generally, and unsurprisingly, the number of exploration wells coincides with the number of discoveries, and the number of development wells with production rate.
The number of fields in production peaked in 2013 and can be expected to decline rapidly over the next few years as those reaching exhaustion accelerate (hence a pulse of decommissioning expenses in the 2020s as companies increasingly struggle with low prices and shareholders demand dividends – let’s hope the UK treasury is ready to step in … oh wait it’s got the biggest debt and deficit in recent memory.
The new licences include only those not relinquished; hence there are fewer of them than the number of significant discoveries and it’s difficult to estimate the exploration time it takes to make a discovery but it looks to be about ten years in the first few years. On average discovery to production takes ten to fifteen years, possibly getting a bit longer, and fields produce for twenty to twenty five years, and probably shortening as the shutdown numbers accelerate (as would be expected with the smaller tie-ins now predominating).
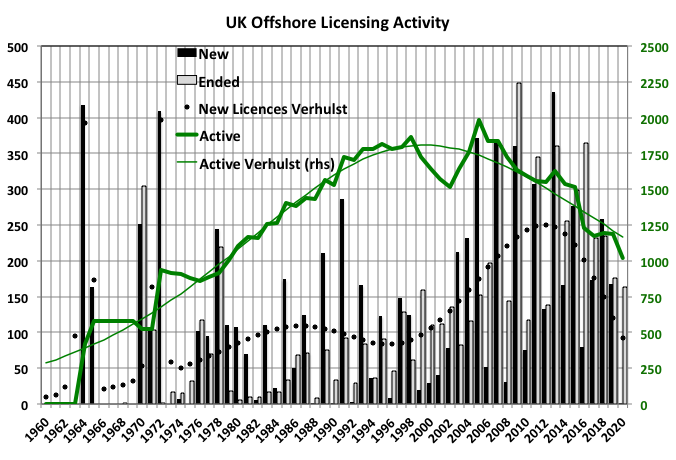
Licensing
The number of new licences issued peaked in 2013 and looks now to be in decline; the number of active licences peaked in 2006. Fitting Verhulst curves (definitely dodgy for the issuance numbers) and extrapolating gives 177 more new licences and 1900 remaining licence years (the curve is really an integral of the difference between new and relinquished numbers). There are 1000 existing licenses so on average there are sixteen years left – there will be a spread but probably front loaded with only a few long lasting fields extending the tail, so the basin would be about down to few fields by 2030 and pretty much done by 2040.
Drilling
Very few vertical wells are now being drilled, and deviated well numbers are also diminishing but horizontal numbers have been fairly constant. Horizontal wells have higher initial production, and longer plateaus and initial shallow decline periods but faster later declines and shorter overall lives, indicating possible accelerating overall decline rates
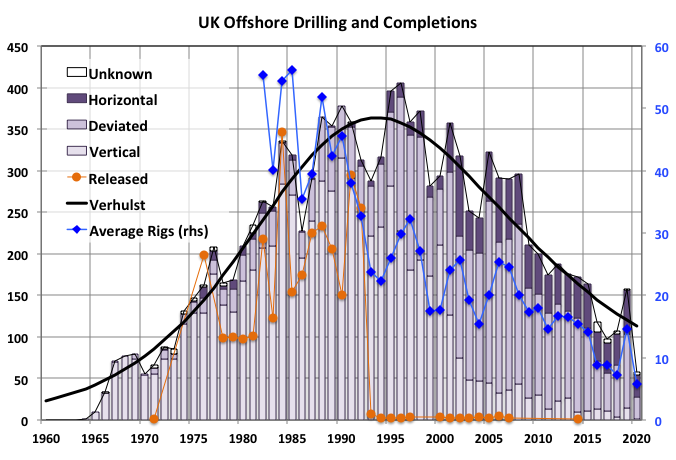
A Verhulst extrapolation predicts 1400 more new wells, which is about 12% of those so far drilled (including side-tracks and failed wellbores). However the continuing drop in active rigs makes this look a bit unlikely, or at least that there’s going to be a long tail. There is no data for when wells have been shut-in or abandoned so it’s not possible to tell how many wells have been active in any year. The relinquishment line shows when wells have been plugged and released from operator responsibility. Something must have changed in legislation in 1993 because the numbers suddenly dropped to single figures; I’m not sure what that says about future P&A commitments but probably nothing good).
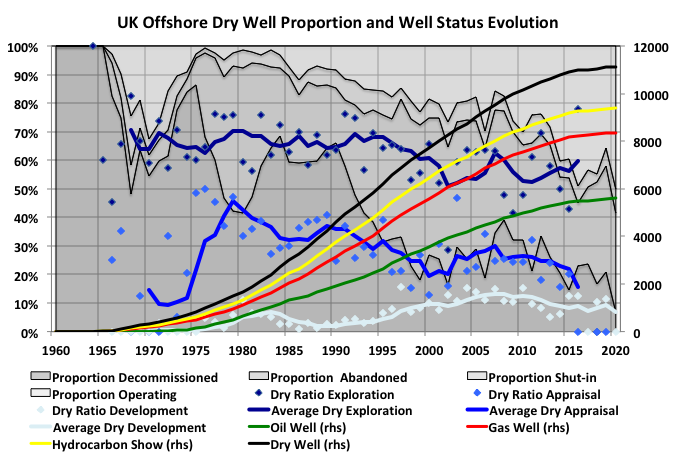
The stacked area curves show the proportion of wells drilled in different statuses (i.e. still operating or in the process of abandonment). There is a bunch, though a relatively high proportion of a small number of still active wells (producers and injectors) drilled in the 60s and 70s and associated with the giant early fields like Forties, Beryl and Piper, which are still producing a few thousand barrels per day. For the years since the Piper Alpha incident the rate of abandonment seems fairly consistent (which means peak abandonment is about due, corresponding to the 1995 to 2005 drilling peak). The sudden change in ratio between decommissioned and abandoned around 1993 must have something to do with the sudden drop in released numbers.
The curves for progression successful and dry wells all show normal creaming shapes for a basin at end of life. The success rates for all types (i.e. not dry nor with a non-commercial show) have been reasonably constant with slight improvement for all, more so for appraisal wells.
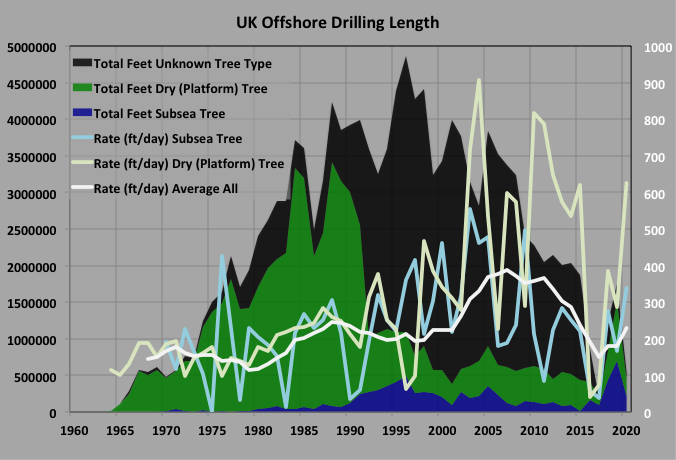
The Oil and Gas Authority doesn’t provide very useful data concerning the split between wet (subsea) and dry (platform) trees as most are listed as unknown. There appears to have been a general improvement in drilling rates until about 2010 and then a decline, which may be product of a small sample size or indicate that more complex reservoirs are being developed.
Overall Production Profiles
Total Hydrocarbons
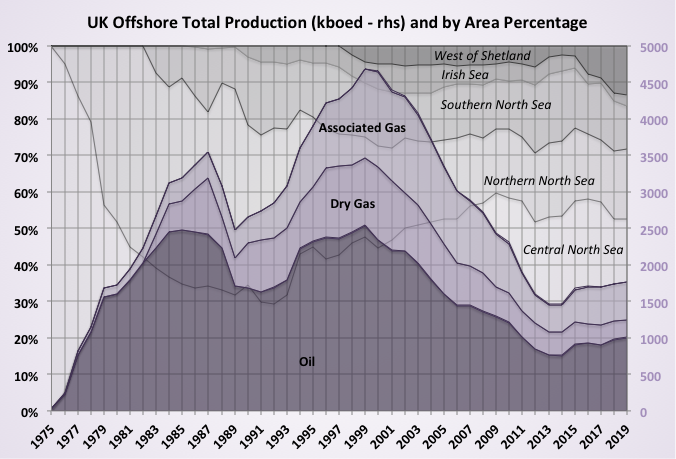
Oil and associated gas has been a larger source of hydrocarbons than dry gas. However the Oil and Gas Authority counts gas condensate fields as oil fields, which skews things a bit; i.e. lease (or wellhead) condensate is reported as oil with the gas therefore as associated, and condensate is only the pipeline liquids from dry gas fields. The recent local peak in 2019 is unlikely to be exceeded again. 2018 was expected to be higher but some production was deferred, mainly because of delay in start-up of the Clair Ridge project.
The Central North Sea has been the largest basin and the site of the giant fields. The Southern North Sea and the Irish Sea are natural gas areas. West of Shetland is the frontier region, although it’s a bit old for that description now, and is growing slightly in production and has the most new and prospective projects.
Crude and Condensate
Except for the named fields, highlighted with white borders, the production is shown grouped by start-up year.
In contrast to Norway the UK has relatively few giant fields and has been more reliant on medium sized greenfield development or smaller tiebacks. Almost all the large fields were developed early and some are still producing in small streams with water cuts above 90% (some may also be in final stages of gas cap blow down, but I’m not sure of specifics). Only Buzzard is a largish field developed in the last 25 years and that is now in fairly rapid decline, though after exceeding all expectations for overall a production (a small Buzzard II development due next year will slightly slow the decline).
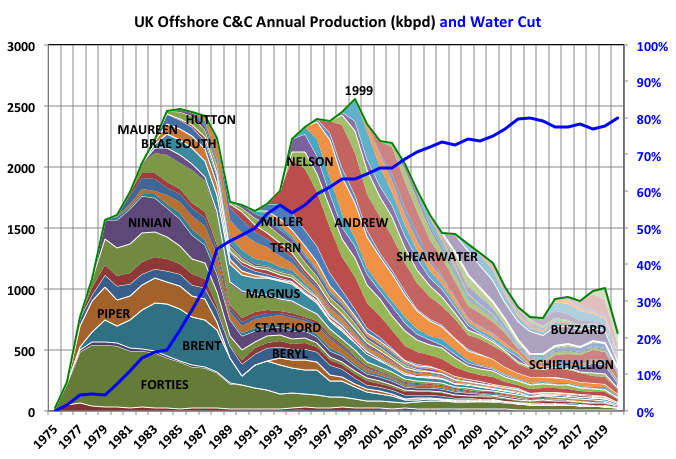
The addition of new production since 2015 caused the water cut to plateau but it looks like that pause has now ended and a gradual increase restarted.
Note that the 2020 production is only through August so the recent decline will not be as steep as shown but is going to be significant given the oil price collapse this year.
Natural Gas
Gas production is likely to decline quickly in the next couple of years but there have been two gas-condensate discoveries announced in 2020, each of well over 100mmboe and both involving Total, which are likely to be fast tracked.
Off Topic Finish: Glaciation Cycles
I have been reading up on the earth’s glaciation events over billions of years and the shorter-term cycles during the current ice age, there are good articles and books available as open source as well as You-tubes and podcasts. It’s fascinating stuff with plenty of new findings over recent years but still with active research on many remaining unknowns. It is, of course, much more complicated than it initially looked and I’ll never get the hang of all the –ocenes and –oics), but here is a summary of the points that I found most interesting.
The time with the earth free of any glaciation (i.e. “hot house” earth) exceeds that with ice present year round (“ice house earth”) by about six to one. There have been five of relatively glaciations initiated and ended by various triggers. We are currently 2.6MYa into the latest one, now apparently ending prematurely because of human actions. It is thought possible that other events showed cycles between glacial and inter-glacial periods over tens of thousands of years, as has happened in the recent era.
The first glaciation occurred after evolution produced photosynthesis in cyanobacteria throwing up oxygen into the atmosphere and destroying the high levels of methane then present. Methane is a greenhouse gas about a hundred times more powerful than carbon dioxide, to which it is oxidized, when it is continually replenished so that its concentration is maintained. Another period started when plants moved onto land and started producing cellulose and lignin, which were difficult to degrade and so pulled carbon out of the air and sequestered it as coal and peat. A necessary factor in ending this glacial period was fungi happening upon a digestive enzyme for lignin that allowed dead wood to decay through dry rot.
Volcanism can have effects either way – eruptions exposed new rocks that weathered out carbon dioxide and fired out streams of sulphur dioxide to the upper atmosphere forming sustained high concentrations of reflective aerosols with a cooling effect. This caused the Snowball earth period when there was 100% ice cover. One proposed mechanism for it’s ending is that other volcanoes spewed out carbon dioxide to initiate warming, but other possibilities are evolutionary change to produce zooplankton that fed on phytoplankton and reduced the rate of carbon dioxide extraction and a meteor impact that vapourised huge amount of water, which initiated global warming feedbacks.
One glacial period was probably ended by a far off asteroid collision that created hundreds of years of debris storms and aerosol dust that increased earth’s albedo either directly or through its effect on cloud formation.
Our current period was started through various tectonic shifts. The South American plate separated from Antarctica and moved north to eventually form the Panama Isthmus. The resulting change in ocean currents isolated Antarctica from warming northern waters and allowed ice to start building up. The Indian plate whacked into Asia and pushed up the Himalayas with suture extending through Indonesia; the newly exposed rock reacted with the atmospheric carbon dioxide – especially in the tropics where the hot and humid conditions promote the weathering.
After a few million years of carbon dioxide removal and polar freezing the glaciation/inter-glaciation cycles started initiated by the Milankovich cycles: eccentricity (~100ky), precession (~26ky) and obliquity (~41ky), plus a couple of minor ones that change the orbital plane. What’s important with these is the spread in seasonal insolation on the Northern Hemisphere where most of the land is. This variation in itself is not enough, by far, to account for the overall temperature swings, but is enough to kick-off various positive feed back mechanism that reinforce each other.
For the recent glaciation cycle the biggest feedback has been albedo change as the reflective ice sheets cover more absorbent vegetated land and open water – this accounts for about 50% of the historic cyclic temperature changes (that ratio may not be the same for the warming we are currently experience. The greenhouse gas feedback is second in importance with 37%. The main processes for draw down are: cooling of the ocean waters allowing greater carbon dioxide absorption; blocked up-swelling by newly ice over areas of the ocean, which prevents deep, cold carbon dioxide rich waters from reaching the surface (especially in the southern oceans); increased vegetation on newly exposed land as sea levels fall; increased fertilization of phytoplankton from iron rich dust as the glaciers ground rock, which was then flushed out by melt waters, or reduced overall vegetation and therefore more bare earth; and increased growth of coral reefs. Research published in the last month indicates another mechanism that reduces Antarctic upwelling because of changing wind patterns that affect the surface ocean layers.
I have been under the apparent misapprehension that changing sequestration in permafrost and peat played an important role. Modelling this appears to be very complicated. It involves numerous specialized disciplines (chemistry, microbiology, dendrology, thermodynamics, geology, heat transfer, climatology, biogeochemistry, hydrology, biogeochemistry etc.). There is limited data on many of these areas: current global conditions and historical event, controlling processes occurring, key parameters for these processes, etc. The complexity is currently beyond the capability of the newest computers and high fidelity coupled models, even were the necessary data available, because of the fine granularity required for spatial area, depth through the earth, elevation and time step. Hence there are large uncertainties, which can even result in contradictory results (in the jargon of the scientists “the models are poorly constrained”). Overall it appears that there has been increase in carbon sequestration in the interglacial period, but the amount is small compared with that held permanently over each cycle. This is not predictive of what will happen in the future because the changees we are experiencing are an acceleration of a transition from ice-house to hot house, not the continuation of an interglacial period. There are recent observations showing that at least some areas of the arctic have now switched to being carbon sources. Another difference going forward will be human initiated land use changes (affecting boreal forests, and tundra as well as permafrost areas) that were not present during previous deglaciation and will almost certainly exacerbated carbon release. Additionally the rapidity of the future thawing means methane releases play an increasing role (and the ratio of methane to carbon dioxide releases to be expected is a large data unknown), in previous cycles slow release meant methane could not build up in the atmosphere over a few decades but was destroyed as it was released.
The final 13% of heating effect comes from the insolation change itself (still an insignificant contribution – what is important are the seasonal changes in the Northern Hemisphere, the average annual global effect need be very little) and increases in reflective aerosols because of the cooler and therefore dryer conditions.
A recent paper in Nature Scientific Reports caused a serious kerfuffle amongst climate scientists as it predicted that earth had entered a self sustaining permafrost thaw stage that would lead to at least three degrees of warming over some centuries even if fossil fuel use was stopped now. It was conducted by two professors from a business school with a “reduced complexity” earth system model so some of the outrage is understandable. However it does give a simple explanation of some of the interactions that will occur to greater or lesser extent during permafrost warming: permafrost thaw increases GHG concentrations; ice and snow melt back and earth’s albedo continually drops; the atmosphere warms and holds more water vapour (a potent GHG that acts independently of the carbon dioxide content) and therefore forms more clouds; warming continues even as carbon dioxide levels start to drop and growing biomass increases until all ice is melted and permafrost thawed. If nothing else the agitated climate scientists should take a lesson from the supposed amateurs and start extending their models beyond 2100.
Peat wetlands (i.e. non-permafrost areas in the Arctic, Patagonia and the Tropics) contain more carbon than permafrost peat-lands – about twice as much as in the shallow (<3m) frozen soil depths. Release, or otherwise, of this sink will depend heavily on stochastic events like wildfires, droughts and deluge events so is even less easy to model and predict, but like permafrost there are early indications that some areas have tipped over from sinks to sources.
A focus for recent research has been to explain the periodicity of the cycles. Around a million years ago the period changed from 40kyr, which would indicate control by the obliquity cycle, to 100kyr indicating dominance by eccentricity. The longer cycle has been explained and demonstrated in sensitivity analyses with coupled climate models as being the result of hysteresis in the isostatic rebound effect. With a large ice sheet above, the land sinks (e.g. a 3 km thick sheet might produce a 1 km depression). As the ice begins to melt the land can take hundreds to thousands of years to spring back, in that time water can pool around the ice in the exposed dip and the lapse rate means the base of the sheet remains warmer than it would be at higher latitudes if the land had risen immediately. Hence the melting is faster than it would be otherwise be. This explains the saw tooth effect seen in the temperature – a large ice sheet will melt more quickly than a small one and the thaw is much quicker than the freeze. The hysteresis effect is more pronounced for the American ice sheets than the Eurasian one.
More contentious is why the cycle time switched. Most research agrees that an increase in ice weight would be he proximate cause and this due to cooling from a small, maybe only 20 to 40ppm, reduction of carbon dioxide. This has been explained through a self-sustaining feedback where larger ice-sheets create more phytoplankton fertilization and more cooling (this process may not require the isostatic hysteresis to be sustained). Subtle changes in ocean currents have also been proposed as causal.
One of the most repetitively tedious and vapid falsehoods, maybe second to the “climate have always changed, therefore …” one, that climate deniers like to trot out is that carbon dioxide can’t be a cause of climate warming because changes in it’s atmospheric concentrations lag temperature changes during the ice age cycles, by possibly up to a thousand years. This is in fact to be expected by the feedback mechanisms listed above. Some recent results show that, while the Southern Hemisphere does show a hysteresis, that in the Northern one it is small.
Even if we did all we are supposed to do to meet the allowed carbon budget we are only given a 66% chance of avoiding disastrous average global warming of 2˚C. We are not going to do all we are supposed to; we are not even going to achieve the inadequate nominal promises from our governments,. It is becoming apparent that 2˚C will be catastrophic rather than disastrous and may be incompatible with a grain-based civilization, however small. Average global temperatures are simply labels, the damage comes at the extremes with extra volatility, such as continents being struck with more and worse weather (heat waves/freezes, floods/droughts), especially when they can coincide worldwide, as seems to be the case the way the jet stream/Rossby waves are evolving. Latest modelling is indicating that given carbon budget has been overestimated (along with the 66% number) because of poor modelling of cloud feedbacks. The earth may now have passed so many feedback tipping points that human mitigation will have little effect on a runaway to hot house conditions. The compartmentalization of science means that we are only slowly understanding the consequences of the interaction of all the accelerating crises: fresh water shortage, soil erosion, ocean and fish disruptions, resource depletion, parasite evolution, ecosystem destruction, and coincident ‘end-of-empire’ secular cycles in culture, economics and politics. The combination of their impacts will be so much more than the sum of their parts – I think this will be central to the next round of‘ “it’s worse than we thought” findings.
And the best we seem to come up with is an unshakeable faith that our lifestyles must be protected and growth based BAU continued with technology saving the day via a mythical hydrogen economy, carbon extraction vapour ware and sleek EVs etc.; and never mind any accompanying societal and environmental damage – not that I have even an inkling of what a workable, not-quite-as-bad-as-it-might-be solution might look like. Although I am sure that to succeed there will have to be a massive redistribution of wealth, and not just from the top 1% in any country but the global top 10% (i.e. most of the ‘west’). This will involve historic ructions as attempts at incremental change just go the other way.
Merry Christmas George. I appreciate it a lot that you write here for us.
And to you and yours; I always find your insights interesting especially when spiced with a little sardonic bluntness.
From the wikipedia entry on the North Sea.
https://en.wikipedia.org/wiki/North_Sea_oil#:~:text=Total%20reserves%20of%20the%20field,barrels%20of%20oil%20per%20day.
“UK oil production has seen two peaks, in the mid-1980s and the late 1990s,[8] with a decline to around 300×103 m³ (1.9 million barrels) per day in the early 1990s.[citation needed] Monthly oil production peaked at 13.5×10⁶ m³ (84.9 million barrels) in January 1985[37] although the highest annual production was seen in 1999, with offshore oil production in that year of 407×106 m³ (398 million barrels) and had declined to 231×106 m³ (220 million barrels) in 2007.[38] This was the largest decrease of any oil-exporting nation in the world, and has led to Britain becoming a net importer of crude for the first time in decades, as recognized by the energy policy of the United Kingdom. The production is expected to fall to one-third of its peak by 2020.[citation needed] Norwegian crude oil production as of 2013 is 1.4 mbpd. This is a more than 50% decline since the peak in 2001 of 3.2 mbpd.”
With Buzzard and Johan Svendrup oilfields as the biggest discoveries in the past 20 years. At what point does exploration cease to be profitable?
I’ve heard that the decommissioning costs there are going to be enormous. Not sure that has begun?
Greenbub
It’s been going on for quite some time.
https://m.youtube.com/watch?v=f_jBDw34uec
Hume and Lightsout , the you tube video from 2017 is a promotional video for a heavy lifting equipment company . The reality is as this .
https://www.politicshome.com/thehouse/article/plans-to-decommission-north-sea-oil-rigs-have-been-left-adrift
Low oil prices are killing all sectors , from oil production to end of life (decommissioning) projects .
I am going to add a short section on decommissioning next month but “enormous” covers it pretty well. I think the delays from the price crash coupled with the onset of a wave of shutdowns might leave a trail of stranded assets behind. Another extra cost is the drive to be carbon neutral – closed flares and high integrity protection systems don’t come cheap, but there might not be many operating platforms by the planned date.
Hi George.
Excellent read as always. There have been a couple of spectacular failures in recent times that I am aware of. The appraisal of the Liberator oil field was a disaster for the company involved and the fractured basement plays West of Shetland held by Hurricane are turning out to be unviable.
On a side note the Stena Icemax is now drilling in the waters off the Bahamas hoping to proof up a new basin. Court cases and political opposition not withstanding it’s and interesting one to watch.
Lightsout , tks for the info, always interesting to acquire new details . In my opinion both shale and offshore are now past expiry date . Next year and thereafter we will see more impairments and bankruptcies in both the sectors . No more FID . The era where you could produce at $ 80 and sell at $ 40 and cover your losses by raising debt are over . All companies in these two sectors are heavily in debt and have run out of credit cards . Other opinions solicited.
Great post, George. What is current cumulative oil production for the UK north sea?
Also, thanks, Hume and LIghtsout for the added info.
Hole in Head, I have to disagree with your comment above on no future FIDs. I do agree with the general tone of your comment in that we are certainly past the peak, and that impairments and bankruptcies will continue, but I also believe there will be future FIDs. GOM projects like Whale and Black Tip, Wilcox discoveries in the western GOM by Shell, will almost certainly get FIDed within a few years. I believe Shenandoah will get FIDed – I think LLOG is out of that but Beacon has come in. In spite of Shell’s Appomattox writedown, I also believe Chevron will find a way to FID Ballymore. These are all potential new facility projects. In addition, I believe there will continue to be FIDs of smaller tiebacks. GOM operators have too much at stake to give up.
Agree – maybe fewer greenfield projects but plenty of smaller tie-backs (some downgrade from stand alone developments. There are (I think fifteen projects next year (or delayed a bit) and at least four largish projects with environment impact statements issued to OGA but no FID yet. UK might get a bit desperate for gas in the coming years and no matter what they say publicly they are not going to abandon newish infrastructure to suddenly switch to wind. I’ll do another post next month on reserves, production, projections etc. but at the moment there’s cheese to be eaten and port to be drunk.
My main caveat to my comments above is if the incoming Biden administration starts not granting drilling permits in the GOM. They have said they would eliminate the granting of drilling permits on federal lands, which includes the GOM. That would be a game changer for the GOM.
I recently heard Scott Angelle, the current director of BSEE, give a presentation at a virtual event. He was asked that question, and his reply was that if the Biden administration started not granting GOM drilling permits, they had better be prepared for lawsuits from the oil industry – his reasoning being that oil companies spent money to acquire these leases from the federal government for the express purpose of drilling wells on these leases, if they so desire.
George and SLG , I am first to acknowledge that both you gentlemen have forgotten more about offshore oil than I will learn in my lifetime . My comment is based on pure financial logic . Why throw good money after bad ? When did Shell realise/discover that it was better to write of $ 4.5 billion of assets ? There is still oil remaining in those assets that they can extract . When did XOM realise / discover that $ 20 billion of their assets were crap ? There is oil still existing in those assets also . Of course sometimes stupidity defeats logic as was in the case of shale oil , an absolute Ponzi . I defer to your POV and also hope that you are correct . Heck, I can have strawberries 24/7/365 if they succeed . 🙂 .
Southlageo,
Former under Secretary of Energy in the Clinton Administration and Secretary of Energy in the Obama administration. Who worked in an advisory capacity (at one time or other) to BP, General Electric and King Abdullah Petroleum Studies and Research Centre. Who am I referring to? None other than Ernest Moniz, who is being considered by the President elect for a role in his administration.
The U.S. can’t afford not to drill on federal land. The reduced rig count and stranded assets alone inform us of this.
I agree with you, Hume, and I hope you are right.
My two cents is there will be no new Federal leases, but drilling will continue on the current ones.
This opinion is worth about two cents, we have no federal leases and I personally know very little.
I actually think Biden discouraging drilling some will help in the short run. Notice the rebound in oil prices since the election?
Trump was never going to be good for oil prices. He thought $40 was plenty. Complained to Saudi every time they’d get to $60.
Shallow,, I agree and think that is more likely, that is, that there will be a moratorium on future offshore lease sales. Oil companies can drill on leases they already have, but no new leases.
Shallow Sands,
High oil prices leads to higher consumer prices and ultimately a recession. No administration wants to be party to it on their watch.
The oil and gas prices are far below what they would otherwise be given market conditions. OPEC has cut production by 9.6mb/d. A tenth of global demand. The growth in demand prior to covid was being met by U.S. shale oil. Since March the U.S. has lost nearly 2mb/d in production. Domestic demand has reduced by 2.4mb/d since the pandemic. At current prices and a weaker dollar over consumption, beyond what producers can supply is the main concern. In any event the current price of WTI Crude and Brent are unsustainable.
Hume,
When you say current prices are unsustainable, do you believe prices will go lower or higher?
Southlageo,
I should’ve been clearer. The oil price has to go higher. A hundred dollar plus. The futures market, in part, determines the price. Where naked short selling is commonplace. Unlimited supply can be created through futures contracts. The trouble is caused by traders wanting delivery of the barrels they thought they were buying. Some traders will settle their contracts for cash. But with supply tightening most traders are going to take delivery. The oil futures market is in backwardation. The current spot price for oil is higher than the futures contracts. This situation can’t persist. Either the rig count goes up and the U.S. subsidises the oil industry at these prices to bring supply to the market or prices go up.
Hume,
That’s the most bullish oil price prediction I’ve seen – a hundred $ plus!
Many will say society just can’t afford that anymore.
Do you think it could go that high as soon as 2021?
thanks,,
Southlageo,
I don’t know whether the oil will price will reach a hundred dollars in 2021 as I believe that’s the real price of oil today. The reduction in demand due to covid masks the underlying reality.
The historical charts for the oil price shows in July 1973 the price was $20.91. By July 1980 it rose to $124.31. This is explained by the U.S. going off the gold standard. The then Fed Chairman Paul Volcker raised interest rates to 20% which saw the oil price drop to $31.96 by April 1986. The Wall Street crash of 1987 and Black Wednesday on this side of the pond kept demand in check. Also there was enough supply. But since 2000 the price has been trending upward. Hitting a peak of $166.46 in Jun 2008. Briefly collapsing to $55.21 in Dec 2008 before going to $114.04 in Feb 2011. In Aug 2014 the price was $104.98. The U.S. ends the moratorium on exporting U.S.oil production. The price temporarily drops to $36.91 in Jan 2016. Then back to $75.52 in Sep 2018.
You will notice the only way to rein in the price is to reduce demand. In 1980 this was achieved by raising interest rates. In 2020 raising interest rate would collapse the whole financial system so a pandemic serves just as well.
Though with demand reduced to it’s lowest level since the 1970’s (first wave) 1990’s (second wave) the price keeps rising. This entails a severe supply shortage. I recently saw an interview with the economist William White who worked for the OECD. He said quite tellingly, prices are what central planners say they are.
This is why making a prediction is so hard as I don’t know when the levee breaks. Though break it must.
Hume,
So you are talking in inflation-adjusted terms. (That has to be the case when you state the oil price was $124 in July of 1980). I tend to think of oil prices in actual terms. The actual price of Brent Crude today is around $51.
Do you think the actual price of oil will approach, or exceed, $100 in the next year or so.
Thank you again.
Southlageo,
The oil price was over a hundred dollars six years ago. The Federal Reserve is targeting a two per cent inflation increase and has been for years. Which if you take it at face value means the oil price rise in 2014 was a result of global supply side pressure, hence the U.S. ending a forty year moratorium on oil exports.
But to answer your question. As of Dec 4th 2020 the U.S. rig count was 246. Down from 668 a year earlier. If the rig count remains below 300 throughout 2021 then a hundred dollar oil is a certainty.
The rig count has been rising since March and I expect it to reach 500+ next year. The actual oil price under this scenario will be $60 for WTI and Brent $65.
Judging from your response you’ve misunderstood the point I was making. So allow me to phrase it another way. In April when oil prices went negative in the futures market. Did you think the commodity to be worthless? If no then why didn’t the futures price reflect it? When the actual price of a barrel rose to $28. Did you think that was a fair price given that it was trading at twice that amount a few months earlier?
I view the current price level in the same vein.
Hume,
I think we’ll leave it there for now. Thanks again for answering my questions and the engaging online discussion. I look forward to your future comments.
GK , enjoy your cheese and port as I enjoy my single malt . I look forward to your post on decommissioning . Why ? The UK treasury has indicated it can do only QE for GBP 275 billion .
There is now a third wave of Covid in UK . Furlough payments are extended till April 30th . In spite of the Brexit deal there are several expenditures which were not budgeted and come due on 1st January .
Will there be anything left for decommissioning ? Already behind schedule . Adios .
Hole in Head,
In spite of the impairment Shell is taking at Appomattox, they will continue producing the asset. They will probably never achieve the earnings they hoped for, but, I suspect they can still create some positive cash flow. They will probably limit their investments in the field unless oil prices really take off.
Now regarding future FIDs,, why would anyone do that? Well,, its partly because that is what oil companies do. When any oil company FIDs an offshore project, they have positive expectations of future earnings and cash flow. They will also do their best to estimate facility size and costs, drilling costs and well performance in light of their best estimates of future oil prices. In hindsight, Shell is probably thinking they did not need to make Appomattox at 175 kbopd facility. Downside subsurface outcomes are driving the impairment. That suggests, among other things, that their wells are never going to deliver enough to fill up their facility. They probably overbuilt the facility – maybe they only needed say 100 kbopd of capacity. That in itself is tens of millions to a few hundred million $ of overinvestment.
Hume , I have posted several times on the price situation ,so will not repeat myself . To cut it short ” Yesterday is not today and today is not tomorrow ” . The world has entered phase change . Past events and experiences are irrelevant . It is a new world . The decline of industrial civilization was never meant to be pleasant .
George Kaplan,
Indeed–a Kopke 10-year Tawny and a nice Camembert.
Thank you always for these posts. All best wishes.
SLG ,thanks for clearing the fog . Always so much to learn from you gentlemen .
Any port in a storm Synapsid! Best wishes also 🙂
Berkswell (a new discovery, and new favourite, for me – ewe’s cheese) and Warre’s, an old favourite. Best wishes to you and all other readers and contributors here.
The fractured basement EUR estimates always looked a bit optimistic but the write-downs have been exceptional. I have worked on one project where the water interface was much higher than expected and there was a lot of long faces and passive aggressive finger pointing amongst the stakeholders (also one where it was much lower because of perched water and everybody were very pleased with themselves. There have been a few lesser disappointments as well – Clare Ridge, WIDP, the Total West of Shetland gas/condensate fields, Mariner, Verhulst – I’ll add a bit about them next month.
Thanks George
Look forward to it.
Just wondered do you have a view on the West Newton onshore discovery? I suspect it’s another Ponzi scheme but some are claiming the majors are circling.
This is from last month and may have already been discussed, but it’s some good stuff on shale oil productivity.
http://blog.gorozen.com/blog/where-has-shale-productivity-gone
(might need registration).
“In all three major shale basins, Tier 1 locations went from representing half of all drilling in 2014 to nearly 80% today. At the same time, the remaining inventory of undrilled locations has now skewed sharply Tier 2. We concluded the industry was in the early stages of depleting its best quality acreage and that productivity would likely plateau and begin rolling over. Furthermore, since the average well was now much more productive to begin with, any future reduction in drilling activity would have to occur by dropping your most productive (instead of your least productive) rigs.”
Also of interest this from Rystad:
“The Covid-19 pandemic has devastated crude and condensate demand in 2021, creating massive supply surpluses and filling up inventories, causing producers to slash output in order to keep prices at somewhat profitable levels. Rystad Energy’s latest balances, however, show that 2021 could offer producers a window of opportunity, as monthly supply deficits may reach their highest level in years.”
https://www.rystadenergy.com/newsevents/news/press-releases/as-2021-will-bring-the-largest-crude-deficits-in-years-a-window-of-opportunity-opens-for-producers
Dennis,
I think your decision to keep the Petroleum and non Petroleum sections separate was a very wise decision. It was really a pleasure to read all of the above comments made by really smart and professional people. Even though I hardly comment as my expertise is sorely lacking, I bet there are a lot of readers out there as interested in this field as me. The learning is non-stop and greatly appreciated. A heartfelt thanks to you and all of the contributors and commenters.
All Thanks should go to George Kaplan, SouthLaGeo, Shallow Sand, and all other industry professionals who have taught all of us so much.
A few days left for the end of 2020 .
WTI now $ 48 and 2020 high was $ 64 .
Brent now $ 51 and 2020 high was $ 70 .
About 25% lower below yearly high .
2021 highs will be lower than 2020 .
What do you think ?
Hole in Head,
WTI has gone from -37/b to 48/b in less than a year. Perhaps 2021 WTI high will remain below $64/b, my expectation for the 2021 high for WTI is perhaps $46/b, so we are in agreement that 2021 high will be lower than the 2020 high. For 2020 the WTI average spot price through Dec 21 was $38.91/bo, my expectation for 2021 is an average WTI price of about $43/bo.
So average oil price will be a bit higher in 2021 than 2020.
Also, what will be the impact on shale companies as the SEC requires companies to disclose the year-end economic producibility of proved reserves?
Based on a lower price last year, I guess there will be a financial impact on shale oil companies future profitability… in addition to the lower price itself last year.
George Kaplan,
I just finished your presentation on glaciation cycles (I, um, overlooked it yesterday and have no excuse). It’s important stuff, it is, and you did a great job. Thanks.
—
George K and John Norris: Warres is of course all right but I shall suggest that you look for Quinta da Romaneira, both the Fine Tawny and the 10-year. Light and unassuming but you might enjoy its presumption as Thurber said.
Dollar is way oversold here against pretty much everything. The trade since March has been go long everything and short the dollar. At very least we are going to get a dollar bounce that last in weeks or months before going lower. But there is a good chance the low is in and that is all we are going to get. First place I expect to see the turn is USD/CHF. RSI is showing Bullish divergence on Weekly chart against price action. The indicator. The RSI is showing HL (higher low) actual price is showing LL lower low. This a turn in the market.
Might take a couple of weeks to get all market going back in other direction. Which is sell assets into dollars but it’s coming. My guess is treasuries get a bid here with a strengthening dollar and yields go lower. Risk off
Government shutdown maybe. Even if they pass the bill to keep it open it doesn’t negate what I am seeing in the dollar market.
I think the stimulus bill was just too small and market just isn’t going to like it.
George thanks for an awesome post and read enjoyed all of it.
Personally i think the second to last image with the watercut tells the entire story. History, where we at now and future for UK production in one image, brilliant.
Have you looked anything in similar fashion on the NCS?
I did something on Norway earlier in Spring, I might update when new reserve figures are released.
Thank you!
Great post! From the high point production plateau of Johan Sverdrup, there is not much more oil left in the North Sea. But there is a lot of acreage left in the Norwegian sea, the Barents sea and the Lofoten area (The reason why I mention the Lofoten area last, is that it not very wise to sacrifice a pristine fishing area for the purpose of getting up as much oil/gas as possible for a cheap price. If to be done in Lofoten, better do it last and to a high cost with high security to avoid pollution to vital food resources.) The ideal future is some sizable prospects in the Barents and the Norwegian sea, to secure oil/gas production for the 2030’s. Equinor is planning for a future without oil and gas, but to utilise competence full throttle to explore and develop oil/gas is expected. Somewhat weird, full throttle on oil and gas and renewables at the same time. Energy transition at a very high speed. Considering Norway only currently use 210 000 b/d oil, rapidly approaching something like -10-15% decline a year in the near future, it is likely we would continue to export oil and gas in the 2030-2040s, although at an increasingly lower rate.
Painful year for HC investors,
https://oilprice.com/Energy/Energy-General/The-Worst-Performing-Energy-Stocks-Of-2020.html
I’ve hung on to Baker Hughes and SLB in my IRA, Looses in the patch seems to have amplified carnage for oil service firms. Likely much of BKR loss is due to GE “financialization” expertise and GE selloff of BKR over the next 30 months. With the cost cutting to date one would think that the Service guys should reap hay on the upswing?? or is software eating the oil patch too?
Perhaps NG outlook improves before the rest of the HC industry due to coal plant retirements. Perhaps all chains of HydoCarbons are now too interdependent @ low oil prices. NG is necessary to keep these new PV Plants pulsing. AFAIK all grid tie PV inverters deployed to date can N E V E R make voltage or power without daddy fossil heartbeat. Utilities and IEEE1549 has made a mess, A 16 millisecond shortage of steam and …
Dennis,
https://www.youtube.com/watch?v=QfmMyA1_U2Q
Raymond James oil analyst
“EV’s are currently a rounding error, not needle moving until 2025”
“Should see oil demand recover 2022”
“Vaccine is the way out of this lack of demand”
Here is what is see as the hurdle. It’s debt saturation. We need lower interest rates to spur lending. Lower interest rate lead to higher asset prices. There is an affordability issue now. Lower interest rates push prices into affordability issues. If you lower interest rate too much housing prices becomes out of reach which leads to asset price deflation.
Inflation is only inflation if it means wage inflation. Otherwise inflation means deflation as prices rise and wages don’t go anywhere. Inflation can causes mass defaults when the masses get squeezed by higher prices.
Dollar might have a little more ways to fall. But everybody should understand why it is falling in the first place.
Two reasons. First is dollar credit is expanding. Second is you have 6 other major central banks doing QE. QE is deflationary as it contracts money supply in order to lower interest rates. When a central bank buys a bond they are pulling money out of the system not adding money into it. QE tightens monetary conditions to lower rates. Their hope is to lower them enough to spark lending and recovery. 6 other CB’s contracting their money supply puts downward pressure on the dollar.
So we got cheap dollars and higher prices. Higher oil prices.
Here is the question. How far can prices go higher before we have a major affordability issue? This end in tears and a overly strong dollar. I don’t know exactly when. Just watch the dollar it will be beyond obvious when it’s happening. Until then party on. I’ll continue being long oil until then.
Supply is tight when several UAE based firms are exporting Venezuelan crude oil in violation of U.S. sanctions.
https://in.reuters.com/article/venezuela-oil-uae-special-report/special-report-uae-emerges-as-hub-for-companies-helping-venezuela-avoid-u-s-oil-sanctions-idINKBN2930YP
Then you have the Nord Stream gas pipeline debacle which the U.S. strongly opposes. Nearing completion the U.S. lent so hard on German that the last 120km has been delayed for awhile now.
https://www.offshore-technology.com/news/nord-stream-german-waters-completes/
The natural gas price was driven down by 10% last week on news of the global lockdown. This week gas has regained 7% of those losses. It’s my contention supply is just as tight in the natural gas markets as it is in petroleum and the price is in effect the result of price controls from the Henry Hub and other price setting organisations.
Hume or whosoever has this info , are Venezuelan re exports done by UAE counted as UAE production and exports ? My guess is it is in the black market .
As to the Nordstream 2 it will get finished ” hail , wind or fire ” or else the German manufacturing engine will die in the very short term(3 years ) because of all the ” green ” initiatives they have undertaken .
I’m glad there’s an oil man who sees it the same way I do. Including an impeding U.S. (featuring the UK) war with Iran.
https://www.youtube.com/watch?v=3lGceDHdO8w
I note grain prices continue to rocket higher. Soybeans are over $13, corn nearing $5 and wheat over $6. Prices not seen since the summer of 2014.
Copper is over $3.50, highs not seen since 2013.
Lumber is also at record highs for this time of year.
I also note that the majority of 142 oil executives recently polled look for WTI to end 2021 at $50-55, not much higher than present, and not enough to set off a massive shale drilling boom IMO.
I think the slow rollout of vaccine will hurt an oil price recovery in the US for longer than was anticipated.
Regarding copper, it’s up about 25% on the year. The internet says BEVs use 183 lbs of copper. So an increase of about $130 per BEV. Or about 1.5% of Tesla’s supposed 20% margin on a $45k car.
Regarding food prices:
Mr Norris , never seen you before so as an old time poster on this forum you are welcome . Your posts are interesting especially about the food price index which a majority of the public is missing . Keep up the good work and look forward to you adding to the intellect and knowledge here .
SS , I also observed the same . As to corn etc the reason is China . A lot of their farmland in the Yangtze basin was destroyed this year due to the floods . They are buying food left , right and centre , even from India where the armed forces are eyeball to eyeball in the Himalayas . As to commodities , it is the low dollar that is forcing the commodity exporters to push up prices . Next is oil , my POV has already been posted here so will not amplify . Currently the FED ( the boss) is in ” no man’s land ” . It does not know what to do . 2021 will decide a lot of issues which were raised in the GFC of 2008 but were kicked down the road .
The EIA just released its October US oil production numbers:
https://www.eia.gov/dnav/pet/pet_crd_crpdn_adc_mbbl_m.htm
GOM production was its lowest in over 10 years – 1.06 MMBOPD. I expected October to be similar to September – around 1.5 MMBOPD. August was 1.2 MMBOPD. All months had some hurricane related downtime. I would have thought that August had the most, but in revisiting the hurricane data, October had 2 hurricanes that would have impacted GOM production – Delta early in the month that made landfall in SW Louisiana (following almost the same track as Laura which came in late August), and Zeta late in the month which made landfall in SE Louisiana.
Colorado is sinking like a stone, and was even before the pandemic.
Is this due to state regulation? A preview of shale nationally under the Biden Admin?
Shallow sand,
My guess is that tight oil output is down due to low prices, Colorado is down because it cannot compete with Permian and Williston at these prices.
Biden administration is likely to be much better at getting pandemic under control, that will lead to economic recovery, higher oil prices and tight oil output increases starting in June 2021 (from now until june 2021 I expect US tight oil output t be flat to down slightly, maybe 500 kb/d).
Oil prices (WTI) will be at least $55/bo by Dec 2021 and $65/bo by Dec 2022, imo, probably $75/bo minimum by 2025.
I realize I may have jumped the gun on this if Ovi is planning a US oil production update,,,
If so, we can certainly continue this discussion there.
SouthLaGeo,
A US update by Ovi will be posted soon. As usual, it will be great!
A new thread US October Production has been posted.
http://peakoilbarrel.com/us-october-production-declines/
A new thread for Non-Petroleum comments has been posted.
http://peakoilbarrel.com/open-thread-non-petroleum-january-1-2021/
I have followed the discussions on this site for a year but never commented before. To say the least I’m intimated by the minds that moderate or comment on this site but truly I have avoided getting my ass handed to me for any of a number of potential slights. However, on the subject of falling CO production, I couldn’t keep quiet.
For the past 30+ years I have operated wells in CO and even participated in the early rulemaking hearings during the transition to the COGCC becoming the unrecognizable, anti-industry juggernaut that it has become. Please forgive the rambling, disjoint discourse but this is very, very personal.
I respectfully submit that when considering the decline in drilling/completion activity and production in CO, one should not simply rationalize these as the result of falling commodity prices and economic viability relative to other plays. Articles have hit the national energy sites over the last couple of years discussing the building draconian rules and regulations with more set to take effect on the 15th of this month yet none have ever looked at the scope and nefarious nature of what is going on there. For example, in 2018 a proposition was before the voters to have a 2,500 ft setback between new wells and occupied structures of every stripe and it was soundly defeated. The next year the state legislature went right around the voters to pass SB181 which implemented a setback of 2,000 ft. But SB181 didn’t stop there and has yielded a sweeping overhaul and “enhancement” of rules and regulations. A provision was made for counties to have some local authority in the permitting/regulatory process. When the smoke cleared, local control of well setbacks, which would have made sense, was disallowed yet county and municipal regulatory bodies popped up to add additional compliance hurdles instead. The Oil and Gas Act which established the governing body in the early 1950’s was stripped of one of its several mandates; that which promoted the production of oil and gas in CO. The mandate to protect correlative rights remains and the mandate to prevent waste has grown unrecognizably like the Andromeda Strain. Who would have known that the word waste was so rich and understated.
A few months ago on POB, a discussion popped up regarding methane emissions, monitoring, costs and, I believe, stripper well requirements. Perhaps a few more folks than Shallow Sand should buy wells and write the checks for compliance on that issue as for him, me and many others, the costs are not hypothetical or theoretical. While the comments were genuine they were ill-informed to say the very least. In CO, the CDHE air quality regs have exploded with the compliance goalposts moving yearly with overwhelming costs. Just 3 years ago, several hundred gassy oil wells and oily gas wells were left without a pipeline when Anadarko chose to abruptly shut down (and refuse to sell) the only pipeline accessible to the wells. The operators installed burners in order to still produce the oil resources. Now, they are not allowed and the wells, which only 3 years ago were very profitable, are slated for plugging should the operators have the money to do so. There’s a country mile’s difference between the volumes flared on a Permian well site and the sub stripper volumes burned in highly regulated combustors in CO but in CO they are treated equally.
On the comment of the goalposts moving yearly, I and many other operators have had conversations with inspectors where they admit that rules come out for enforcement at such frequency that they can’t keep track. If they can’t keep up, then how are we supposed to keep up. I haven’t spoken to a fellow operator that feels when compliance upgrades are executed it will be sufficient in the very near future and we all love getting those NOAVs and correspondence that tells you how heavy the state’s hammer is and where it’s positioned.
Honestly this is but a taste of the regulatory dysfunction in CO and I could ramble on for pages. And I might seem a whiner and a loser; maybe so. Strangely enough, there are scores of other operators in CO that must be as well. with many being run by people that I look up to. Many are long lived family companies, some are well financed investors and others are guys like me that have weathered numerous bust cycles without BK only to find out that you can’t fight the government. As many of you seem to have available resources and great intellects, I would challenge you to study CO deeply and see if the production numbers can be explained relative to other basins and opine as to where we are headed from a federal perspective. Think beyond BLM and CA regs and you will see CO way out front.
Thank you for the opportunity that you afforded me here.
Rasputin
Consider copying this comment over to the new US October production thread that was just started and noted above.
Must we understand that by 2040 or so, oil production in UK will be over?