A Post by Ovi at peakoilbarrel . com
All of the oil production data for the US states comes from the EIAʼs Petroleum Supply Monthly. In addition, information from other EIA offices is provided to project future US output. At the end, an estimate is made for the decline rate in the L48 conventional oil fields and an analysis of a few different EIA reports is undertaken.
The charts below are updated to October 2019 for the 10 largest US oil producing states (>100 kb/d).
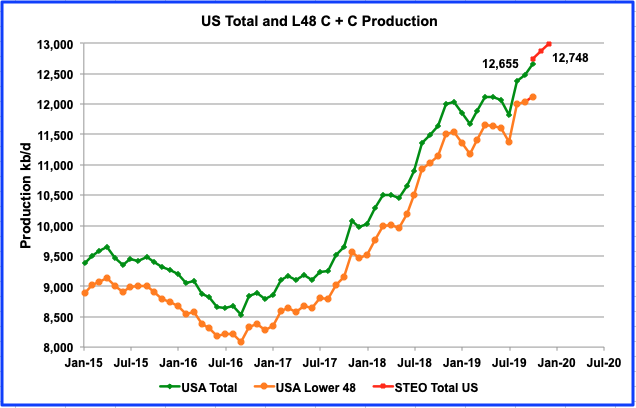
U.S. oil output continued to increase in October 2019. Production reached a new high of 12,655 kb/d, an increase 171 kb/d over September and 55 kb/d higher than estimated by the December Monthly Energy Review (MER). However it is 93 kb/d lower than the 12,748 kb/d estimated in the December STEO report. This could be an indication that the January STEO report will again lower US production estimates for 2020.
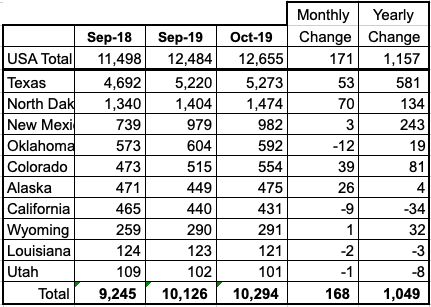
Listed above are the 10 states with production greater than 100 kb/d. These 10 account for 10,294 kb/d (81.3%) of total US production of 12,655 kb/d in October.
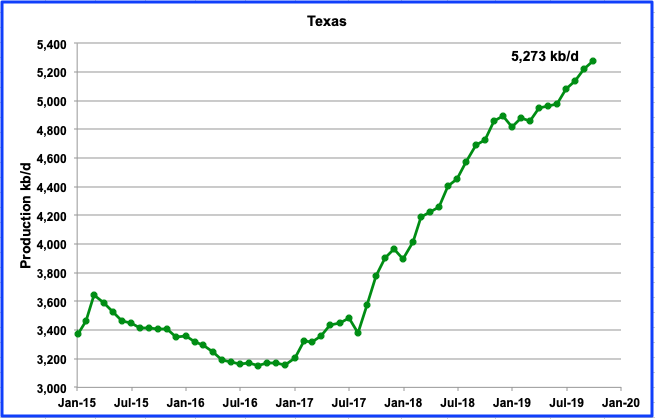
Texas production continued to rise in October and rose by 53 kb/d to 5,273 kb/d. Comparing the initial growth estimate for Texas from January 2019 to October 2019 vs 2018 indicates a slower growth rate for 2019, i.e. 377 kb/d vs 762 kb/d respectively, 49.5% of the 2018 growth. It is worth noting here that the 53 kb/d October increment is close to half of the total 100 kb/d increment shown in the December LTO report and is discussed further down.
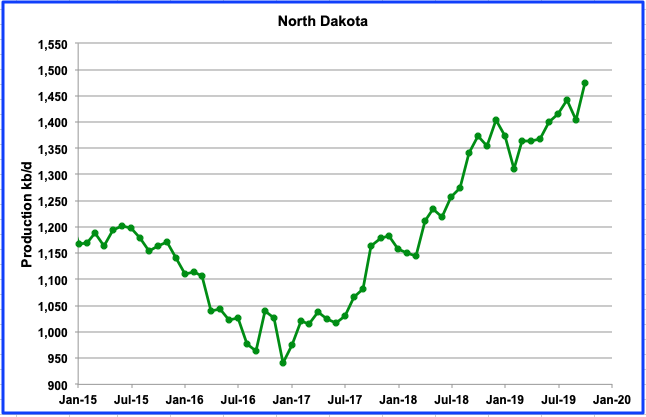
Oil production was up by 70 kb/d in October over September. However September was lower than August due to heavy rains. Regardless October set a new record.
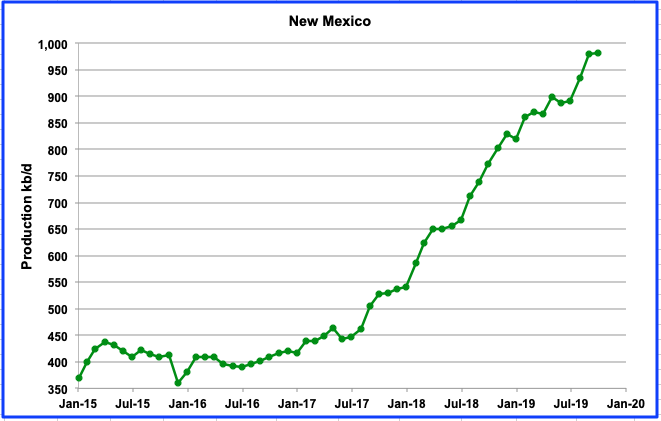
New Mexico output was essentially flat for October at 982 kb/d. However, the September output was revised up from 956 kb/d to 979 kb/d in the October report.
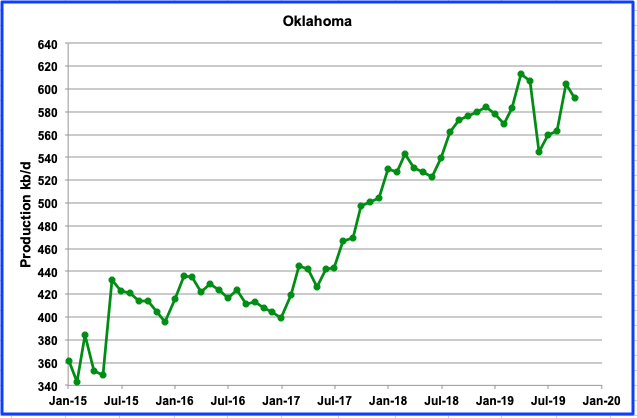
October production was down by 12 kb/d to 592 kb/d. The chart shows indications of peaking or plateauing in Louisiana. There is a loss of drilling interest in Oklahoma due to the complex geology that stymied hopes for a “Permian Jr”, according to this source.
While production is lower than the April high, we will need to wait to see if the down trend continues.
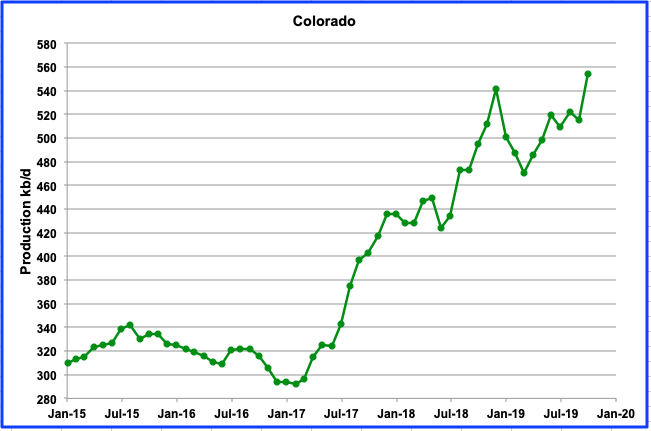
Colorado production was up by 39 kb/d in October to 554 kb/d, an increase of 7%. This is a bit surprising because of all of the concerns with the new drilling regulations and a drop in the rig count. In January, there were 35 rigs operating in Colorado. By October, the number dropped to 24 and a further drop of 2 in December. However according to CPR News, it’s “All Systems Go For Colorado Oil And Gas, Despite Crackdown Efforts.”
“Six months after shouting that new legislative drilling regulations were an existential threat to their industry in Colorado, the state’s oil and gas producers are now whispering a different message to Wall Street:
“We do not foresee significant changes to our development plans, as we have all necessary approvals of more than 550 permits to drill wells over the next several years,” Noble Energy representatives wrote to investors.”
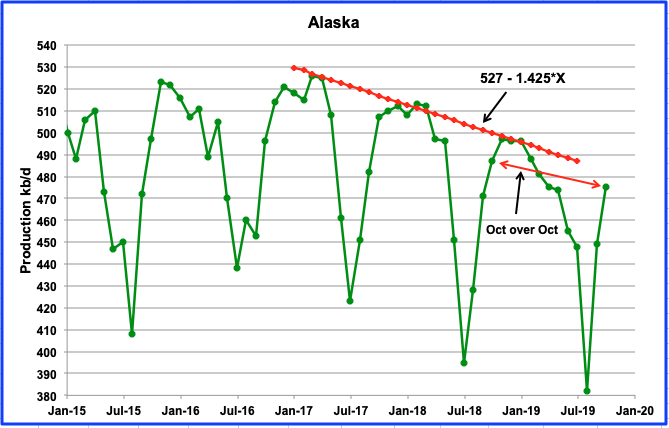
Alaska production was up again in October by 26 kb/d to 475 kb/d after completion of scheduled maintenance. Going forward, two new projects are scheduled for 2020 and 2021 which will add 20 kb/d and 40 kb/d, respectively according to the Frontiersman. Note how the October over October decline is similar to the annual decline.
According to the Frontiersman, in October, with production facilities back online, Prudhoe was up to 270,658 barrels per day but still below October 2018, when Prudhoe averaged 283,754 barrels per day, according to the state revenue data.” Note that the Alaska October over October decline is 12 kb/d compared with with the 13 kb/d from Prudhoe.
In other related Alaska news, Hilcorp Alaska is buying BP’s Alaska oil and pipeline assets according to the Frontiersman.
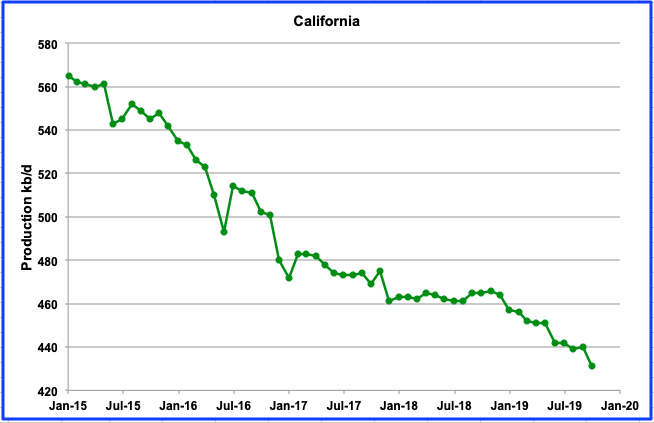
California continues its slow but steady decline and shows no sign of recovery.
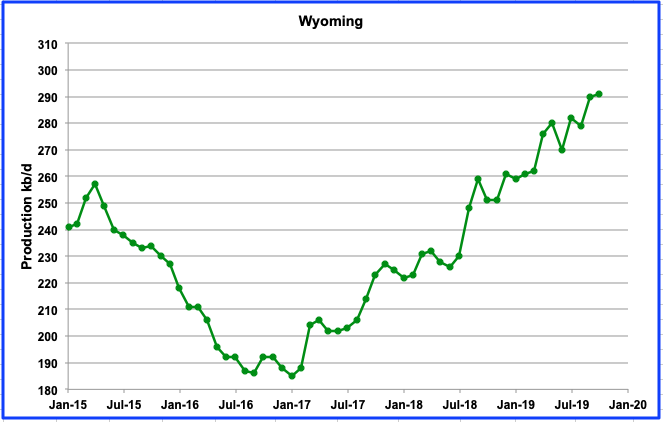
Wyoming continues to increase its output and reached a new high of 291 kb/d in October with a minimal increase of 1 kb/d. It continues to benefit from the northern portion of the Niobrara LTO basin being situated in Wyoming. In October, the Niobrara only added 3.7 kb/d. Last week drillers added two rigs for a total of 29 but the number is still down from 33 in January.
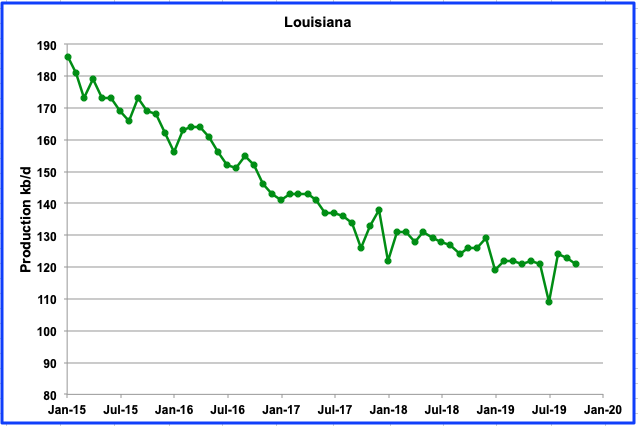
After Louisiana’s output recovery in August 2019, it began another slow decline phase with no indications of a long term recovery. The rig count is down from 63 in January to 55 in October.
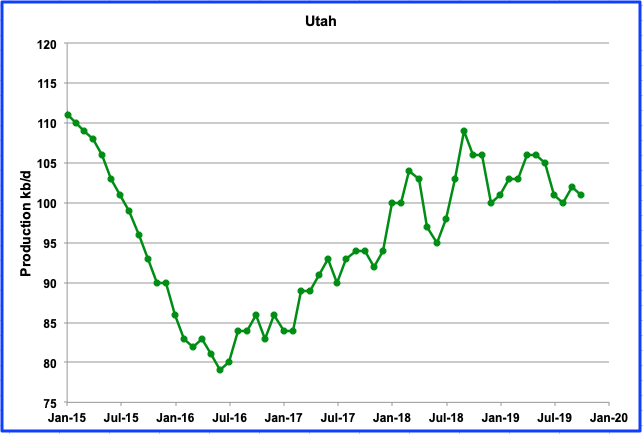
Oil production in Utah reached its peak of 109 kb/d in September 2018 after the discovery of a new conventional oil field. However, Utah’s production now appears to be entering a declining phase.
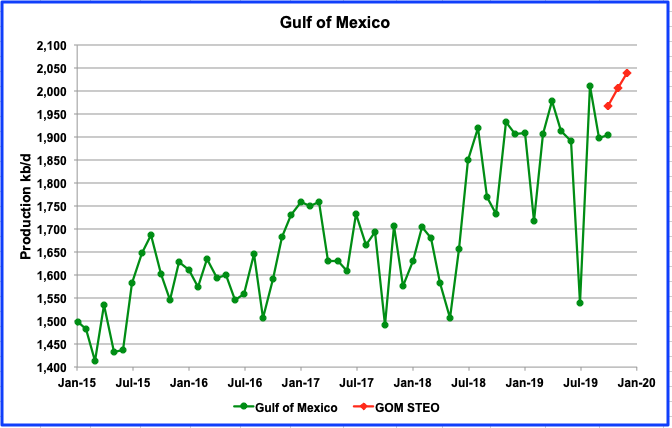
GOM output was essentially flat for October and is 64 kb/d lower than provided in the December STEO report.
According to Rigzone, annual oil production in the GOM is expected to jump to 1.9 million bpd in 2019 and reach 2 million bpd the following year, the agency reported.
“Eight new deepwater projects are expected to come online this year while four should come online in 2020. Majority operators for the 2019 starts include LLOG, Shell, Oxy, Murphy Oil and W&T Offshore. Talos Energy, BP, Murphy Oil and Fieldwood Energy are majority operators for the 2020 starts.
The agency expects these projects in total to add around 44,000 bpd this year and approximately 190,000 bpd in 2020 as their production ramps up.”
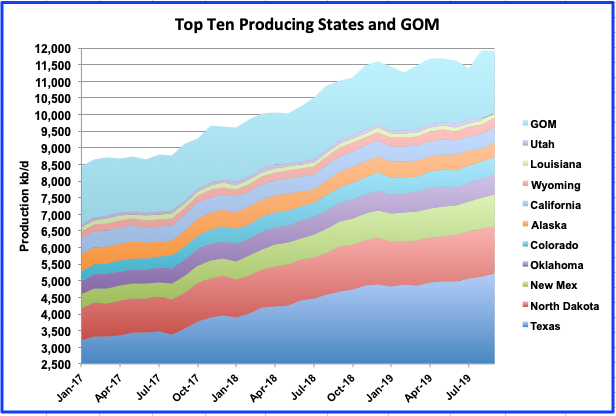
Above are the top 10 US oil producing states along with GOM plotted on the same scale to show the relevance of the GOM. Note the chart starts at 2500 kb/d and Texas output is 5,273 kb/d.
DUCs
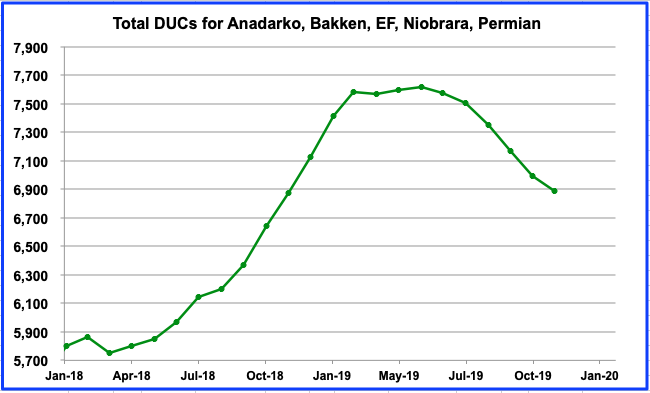
This chart shows the number of DUCs in the five major oil producing LTO basins. Much discussion surrounds how production of LTO continues to increase while the number of rigs operating in the LTO basins continues to decrease. Essentially, the higher output rate tier 1 DUCs (Sweet spots) are being used to offset production from lower quality wells. The number of DUCs dropped by 110 from 6,995 in October to 6,885 in November.
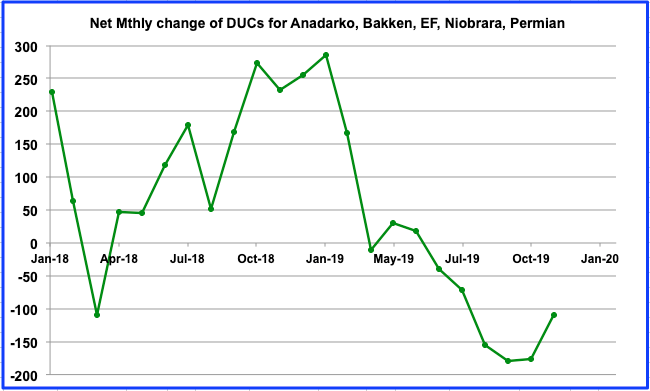
This chart shows the net difference between drilled wells and completions and whether the number of DUCs are increasing or decreasing. A positive number indicates that the DUCs are increasing. From April 2018 to May 2019 more wells were being drilled than completed and the number of DUCs increased, with the peak occurring in January 2019. Commencing in June 2019, completions exceeded drilled wells and the number of uncompleted wells began to decrease. The rate at which DUCs were being completed started to slow after August 2019.
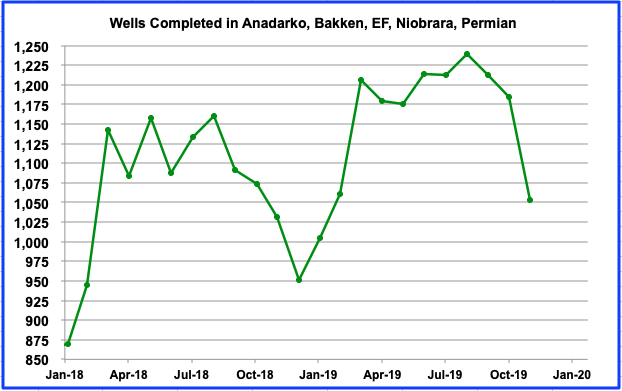
This chart shows the number of wells completed each month. Note that the number of completions from March 2019 to August 2019 slowed relative to the previous few months. However, starting in September 2019, completions began to drop and accelerated in October. The last data point is November. This chart lines up with the recent drop in frac spreads?
EIA’s Differing Oil Growth Perspectives
The EIA has different offices that collect and publish extensive data on the U.S. oil producing industry and uses it to provide forecasts for future production. Three of these perspectives are reviewed and compared below.
1) Drilling Productivity Report (DPR)
The Drilling Productivity Report (DPR) uses recent data on the total number of drilling rigs in operation along with estimates of drilling productivity and estimated changes in production from existing oil and natural gas wells to provide estimated changes in oil and natural gas production for seven key tight oil regions.
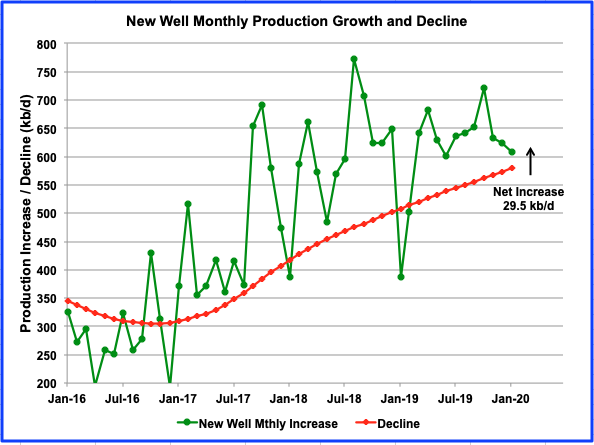
The DPR report looks ahead by one month to provide an estimate for next months output for each of the US tight oil basins. However, it should be noted that the DPR includes both conventional and light tight oil in their projections. It also estimates the month over month decline in the same oil fields to provide a net monthly increase in output. The gap between the green and red lines in the above chart reflects the net monthly production increase.
In the above chart, the projected increase for January 2020 is 29.5 kb/d. Also it can be seen that the EIA’s projected monthly net increase has been getting smaller and less volatile since August 2019. This may be an indication that the DPR has been collecting/obtaining better information for the more recent months.
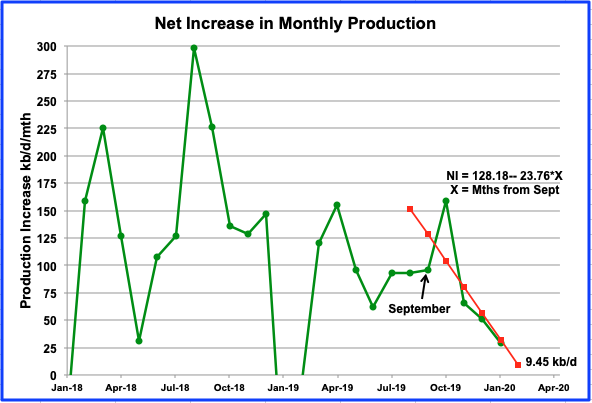
This chart shows the difference between the monthly production growth and the monthly decline in the previous chart. In other words it is the DPR’s projected net monthly production increase for the seven LTO basins starting in January 2018. Last month this chart was shown with data up to December and a straight line fit using the September to December data was added to the chart. Putting a straight line through four data points is a bit risky. Sometimes it is all in the eyes of the beholder. However, when the December DPR was released, their January estimate fell almost on the line. Let’s call it luck for now.
If the decrease were to continue at the rate of 23.76 kb/d/mth, there would be no net increase in production from the LTO basins by mid March 2020. The projected net output for the end of February is 9.45 kb/d.
2) Light Tight Oil (LTO) Report
The LTO database provides information only on tight oil production from the seven main tight oil basins and a few smaller basins. The LTO data differs from the DPR, where both conventional and tight oil are reported. The data is also back corrected each month as updated information is provided to the EIA.
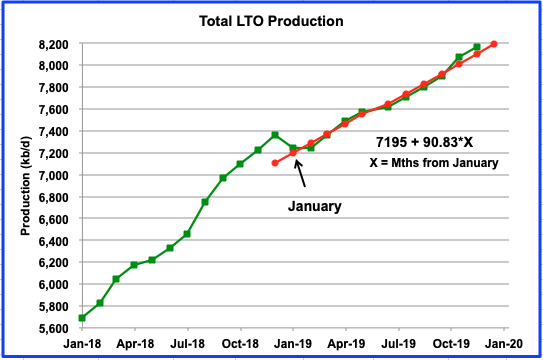
The output of all tight oil basins was 8,165 kb/d in November and increased by 95 kb/d from 8,070 kb/d in October. The average monthly increase from January to November is 90.83 kb/d/mth. The primary contributor to the November increase was the Permian, which provided an additional 100 kb/d and is detailed further down.
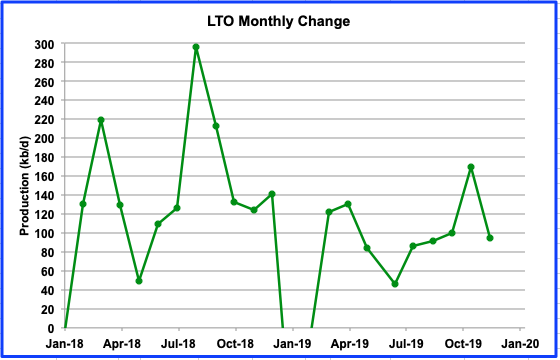
Similarly to the DPR report, one can look at the monthly additions to LTO output. By comparing this chart with the similar DPR chart above, the similarity from January 2018 to November 2019 is very close. So while the DPR is projecting a significant slowing in LTO production out to January, the November LTO report can only confirm this trend up to November 2019. A few more months of LTO data will be required to see if the monthly production growth continues to decline and confirms the trend in the DPR data. One indicator that has a trend that is similar to the declining production growth trend shown above is the recent drop in the number of frac spreads.
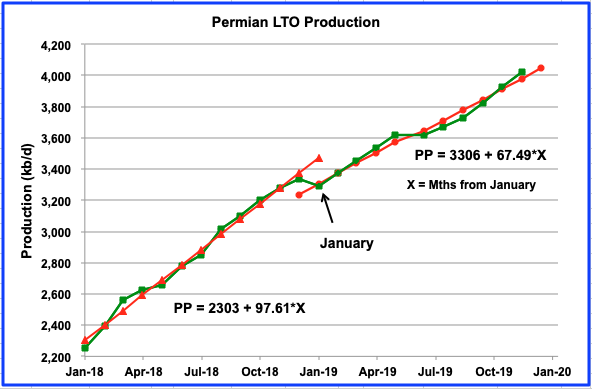
The Permian is the largest contributor to US tight oil growth. The average growth rate in 2018 was 97.61 kb/d, fairly consistent month over month, while the average rate in 2019, up to November, is lower at 67.49 kb/d. However in this case, averages are deceptive because starting in September, the Permian output growth was 100 kb/d/mth for September, October and November. It is difficult to explain this continuing linear increase in output in light of the falling rig counts and plummeting frac spreads.
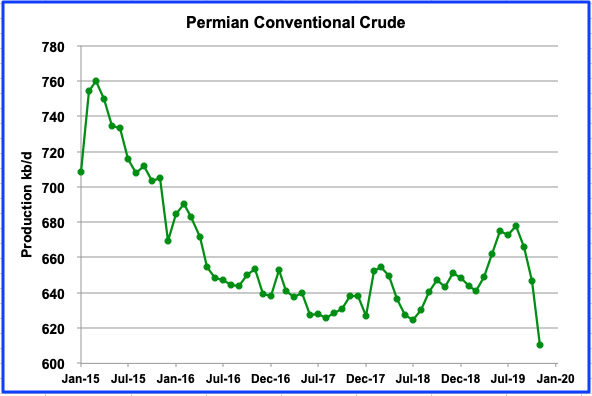
This chart shows the conventional oil component of the Permian output. It was obtained by removing the LTO output from the DPR production. The sharp drop in conventional oil starting in August 2019, may account for the similar drop in the net monthly production shown in the DPR section above. Since this chart represents the difference between total and LTO production, it is not clear if the sharp drop is the result of too high LTO output shown in the previous chart or too low total output. A few more months of data may clarify the situation.
3) Short Term Energy Outlook (STEO) Report
The STEO provides projections for the next 13–24 months for a number of sectors, oil, coal electricity, etc. and is updated monthly. For this post, only their oil production projection is of interest. The upcoming January release will project production out to December 2021
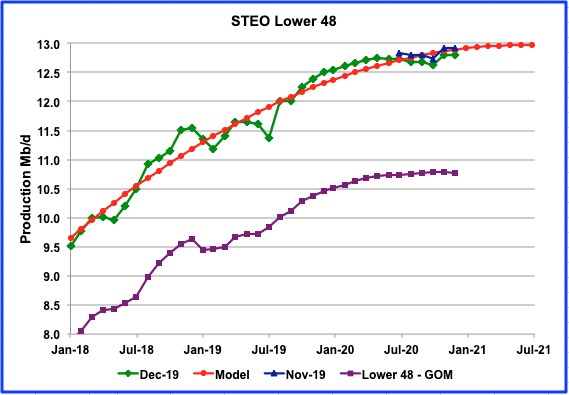
This chart provides the STEO estimate for US oil production out to December 2020. The green graph is the latest December 2019 prediction and is approximately 100 k/d lower than the November 2020 prediction, deep blue, taken from last month’s November 2019 publication. Recently the trend shown in the latest 2019 monthly publications has been successively lower estimates for 2020 output.
The purple graph represents oil output from the onshore L48 states, i.e. it excludes the GOM. Both the green and purple graphs are showing signs of decelerating US production in 2020. Some of the slowing is associated with the reduced number of operating rigs. From January 2019 to December the rig count has fallen by 261 from 1,065 rigs to 804 rigs. Note that while the rig count has been coming down, output has been increasing because the older rigs have been replaced with more efficient and powerful ones.
While the chart is showing signs of US oil production peaking in 2020, we should expect continuing slow growth into 2021 if the price for WTI stays above $60/bbl and heads toward $70/bbl.
Estimating Decline in US Conventional Oil Fields
US output has increased yearly from gains in the LTO basins and the GOM. In order to estimate the average decline rate in US conventional oil fields, two approaches are taken. In one case, the decline rate in states with declining production was estimated. In the other, the decline rate for the onshore L48 conventional fields was estimated by removing the LTO component from the L48 onshore oil output.
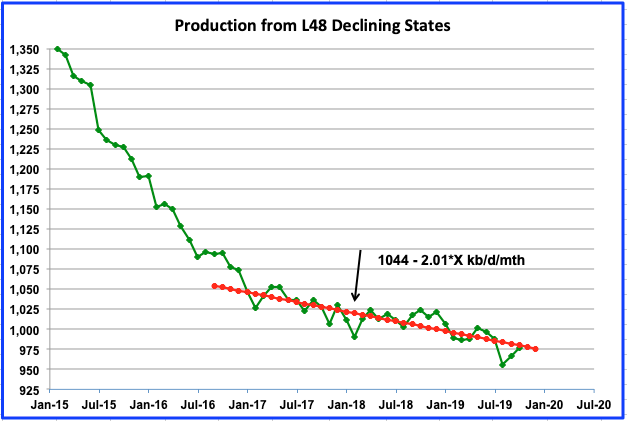
In the above chart, which looks at the L48 states with declining production, we can see a rapid decline in conventional oil output from January 2015 to Dec 2016 at approximately 150 kb/yr. However from January 2017 to the present, it slowed to 2.01 kb/d/mth.
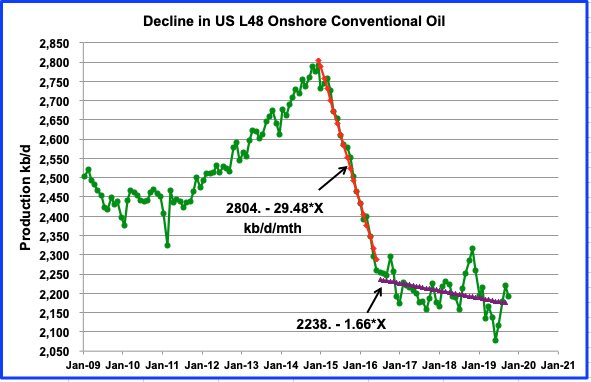
In this chart, the tight oil component was removed from the L48 state’s production using the LTO data. As can be seen, there is a rapid decline in output from January 2015 to June 2016 at an average decline rate of 29.48 kb/d/mth or close to 355 kb/d/yr or approximately 15% using 2,525 kb/d as a mid point reference. The decline rate after June 2016 then falls to 1.66 kb/d/mth and is not that inconsistent with the decline rate estimated using output from declining states above. It is not clear why there is such a sharp change in the decline rate in conventional oil output starting in 2016 to the present.
The above noted decline rate of 15% seems extremely high. However it may give credence to the following statement: “Historically, Permian conventional wells have shown an annual decline of 13%.”, taken from here.
Taking the average decline rate from these two estimates, gives an average rate of 1.84 kb/d/mth. Adding in the decline rate from Alaska of 1.425 kb/d/mth gives an overall average of 3.27 kb/d/mth or 39.2 kb/d/yr which is less than 2% of current conventional output.
In the text portion of the Alaska report above, the following statement is made : “In October, with production facilities back online Prudhoe was up to 270,658 barrels per day but still below October 2018, when Prudhoe averaged 283,754 barrels per day, according to the state revenue data.” If this decline was strictly due to natural decline, then it equates to a decline rate of 1.091 kb/d/mth, which is a significant portion of the overall yearly Alaska decline rate noted above.
On the other hand, a review of the tight oil production data gives a totally different picture for decline in LTO basins. Looking at the production and growth chart in the DPR section above, the expected production increase in January is 609 kb/d while the decline rate is 579 kb/d. In other words 95% of the projected January output is required to offset the decline from all of the earlier wells. It will take a few more months of data to determine whether the monthly decline and production growth will equalize in March, as suggested by the chart in the DPR section above.
World Oil Production
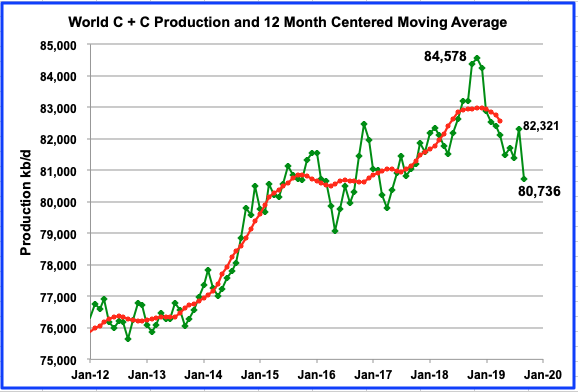
World C + C production fell by 1,585 kb/d to 80,736 kb/d in September 2019. Of the 1,585 kb/d, 1,350 kb/d was due to the attacks on the Saudi Arabia Abqaiq processing plant, one of the world’s most important oil production facilities. The Khurais processing facilities were also attacked.
254 responses to “U.S. Oil Production Is Competing Against Decline”
A fantastic post Ovi, thanks. That last graph, World Oil Production, says it all. Does that look like a peak or what?
Thanks Ron
I was thinking of holding it back for the Non-OPEC update, but when I saw it, I thought to myself, Ron will love this one.
Yeah, I did love it. I am looking forward for the 2020 data to come in. It’s looking more and more like the world is peaking.
I will have a comment on Russia a little later this morning, along with a couple of links. Russia has as much as admitted they are at their peak right now. They say they hope to keep production flat for the next four years but I don’t think that is a feat they can accomplish. Two years perhaps, if that?
?Burn Baby Burn?
“Now, there is simply too much natural gas, and drillers in the American shale patch must face the not-so-pleasant music, with only one question remaining: which shale drillers can hold on until more pipeline capacity comes online?”
https://oilprice.com/Energy/Crude-Oil/Burn-Pay-Or-Shut-It-Down-Three-Evils-For-Permian-Drillers.html
Ron, this must be the 25th year in a row in which you have been predicting the peak in Russian oil production. You are a rival for The Economist in that regard.
I think it’s getting closer.
Ron, this must be the 25th year in a row in which you have been predicting….
Hey asshole, I am not predicting anything. Read my post below on Russia. I am just quoting what the Russian Minister of Energy is saying! The post starts:
Russia has Peaked, according to the Minister of Energy.
Russian oil executives and officials have been making such comments for many, many years. It’s part of the game. They may be after a better tax regime (Russian oil production is heavily taxed) or they may be jawboning the oil price higher (unlike the US, EU, China, Japan etc, Russia prefers a high oil price rather than low oil price) or they may be playing the misinformation game, they don’t want to reveal their strongest card in the public sphere.
Ron,
It’s looking more and more like the world is peaking.
Perhaps Stavros was referring to the sentence above, that sounds a bit like a prediction, though you certainly did not say when that peak would occur in that statement and perhaps you meant soon. Could be that we are on a plateau between 82.5 and 85.5 Mb/d that started in 2018 and will continue until 2030, with a peak near the middle of that plateau, we will know more in 5 years.
Perhaps Stavros was referring to the sentence above,…
Not possible Dennis. The sentence above says “World”, he said “Russian”.
Ron,
Sorry, you are correct, I missed the “Russian” in the comment, you actually have not made that prediction as far as I remember. More focused on World output and perhaps OPEC.
I was thinking of holding it back for the Non-OPEC update, but when I saw it, I thought to myself, Ron will love this one.
Why would somebody who fears the consequences of the downfall of world crude oil production so much, love to see Peakoil happening now or in the rear-view mirror ?
From my own experience I can tell that most people don’t take me serious when I talk or write about Peakoil and the potential destructive consequences. Many don’t even understand the phenomenon Peakoil (“Still crude oil left for many decades”).
So for people not laughing at me and calling me a nutcase or something like that it would be some kind of victory when at last (after a few false declarations in the past) PO or near PO is a fact now.
I am afraid even then people won’t accept peak oil, they will just blame something else, politicians, immigration whatever…
Ron,
Fairly similar to the peak in 2015. When oil prices rise, output is likely to surpass the 12 month centered moving average peak in November 2019, in my opinion. Probably by November 2022, perhaps May 2023 at the latest.
Ovi,
Great post thanks.
As to a possible explanation for conventional decline rates changing consider the chart below.
Data from
https://www.eia.gov/dnav/pet/hist/LeafHandler.ashx?n=PET&s=RWTC&f=W
Oil price can make a difference.
DUC completion can compensate for falling drilling rigs to some degree. The completion rates do not correspond very well with frac spreads, but we do not know the breakout between tight oil focused frac spreads and those working the shale gas sector. Keep in mind that both the DPR and LTO estimates get revised monthly, the most recent three months for the DPR are based on the model and tend not to be as variable as real output data, looking back at old DPR reports makes this quite clear.
A drop in completion rates by 10% from the November completion rate level may result in a temporary pause in tight oil output increases, at some point oil price increases, completion rate increases and tight oil output resumes its increase by 2021. It is not clear how much completion rate will drop and perhaps it will simply remain constant. Note that until November the drop in the frac spread count had little effect on the completion rate in tight oil plays, most of the decrease in completion rate through October 2019 occurred in the shale gas plays. From March to Oct 2019 the tight oil plays completion rate decreased by 2% and the shale gas plays completion rate decreased by 16% over the same period with 56% of the total decrease in completions for both tight oil and shale gas due to the shale gas completion decrease (27 fewer vs 21 fewer in tight oil plays).
Dennis,
That google drive excel data and model. Did you do all that ? 25MB of data is a hell of a lot of data to enter in a spreadsheet.
Cheers,
Ovi,
Thanks for the effort, some interesting plots and insights. I still think it’s too early to call peak, but I also tend to agree with what Ron said a while ago, when U.S peaks, the world peaks.
Dennis’s position seems to be when oil prices increase, U.S output will also increase, which as he mentioned happened before already, so could happen again. That could very well be true.
I also have a back of the closet hypothesis that we are possibly entering peak consumerism. Possibly due to the decline of birth rates in the west. If that is the case, oil prices won’t be rising substantially without causing a severe recession.
“we are possibly entering peak consumerism. ”
perhaps, but very slowly. We are adding something like 70-80 million people per year, and will have about 1.5 Billion more alive on the planet within 20 yrs.
GDP is growing at around 3 % in world, which very roughly equates to increase money in the accounts to purchase fuel and items derived from it.
The U.S. Energy Information Administration (EIA) projects that world energy consumption will grow by nearly 50% between 2018 and 2050. Most of this growth comes from countries that are not in the Organization for Economic Cooperation and Development (OECD), and this growth is focused in regions where strong economic growth is driving demand, particularly in Asia.
All in all- it looks to me like this coming decade will see brisk increased demand for energy of all sorts. The scenario of price rise in crude seems highly likely. We’ll see to what extent drilling can keep up.
Hi Hickory,
You may very well be right. I will elaborate why i say we maybe entering peak consumerism. Look at the central banks interest rates of OECD countries. They are all following Japan, nearing or are at negative rates. Why? Because there is very little to no inflation. I assume because people are not buying things as much anymore. The 3% global GDP growth, majority of it is I assume from emergent economies such as India and China. The OECD countries are very close to recession (excluding U.S for the moment). The manufacturing PMI data from Europe and Australia is abysmal. I don’t agree with the EIA’s long term forecast. They are projecting current models and making a huge ASSumption that the current trend will continue. It almost certainly won’t.
Again this is a back of the closet hypothesis. I am very open to being wrong here.
I share your concern about economic growth. It always looks extremely fragile to me. At some point there will be a significant global economic contraction. Will it come in the next 5 years, and take the steam out of exploration and drilling via slack in demand? If so, we are very close to peak oil right now.
Or will an economic contraction come later? If so, there may be persistent demand growth, rising prices, and enough wind in sails of the industry to reach a higher peak in the next few years. Irans production could come back up in the next few years also, depending on policy decisions.
Either way, we are very close to peak. If you define peak as the band between 82-85 mbpd global C + C 12 month average-
we are at Peak Now regardless of price/demand, etc.
Hickory,
Say oil production remains on a plateau from 2016 to 2030 in some “band” of perhaps +/-2% of some average level (maybe 84 Mb/d), when someone says the peak is now, it would be any time over that 15 year period, I tend to pick the midpoint of the plateau as the peak in that case, so 2023/2024 for the example I have given.
My best guess scenario has the peak at 84.51 to 85.49 Mb/d from 2022 to 2027, I would call this a 2024/2025 peak, the average World output from 2022 to 2027 in this scenario is 84.99 Mb/d with output ranging from 84.54 to 85.25 Mb/d over that 6 year period.
I just double checked and the +/-2% plateau actually has a plateau from with an average output of 83.46 Mb/d with a range of output from 2018 to 2030 with a range of output from 82.36 Mb/d to 85.25 Mb/d, midpoint would be 2024.
Its very reasonable Dennis, just longer and higher than my imagination takes me. I am much more interested in the duration of the ‘plateau’, than the peak. The implications for global adaptation to “beyond peak’ times are huge, of course.
Hickory,
In chart form it looks like this.
If this is close, the world has about 10 years supply at current levels, with 800 million additional people by then.
Some countries will be very shorthanded by then, unless they learn to use much less per capita, and total.
Got copper? Got lithium? Got $’s?
Hickory,
I agree the transition will be difficult, higher oil prices will lead to less waste and better fuel efficiency in land tranport, more hybrids, plugin hybrids, and EVs and possibly natural gas or fuel cells used in land transport. In densely populated areas perhaps more light rail and rail as well as rail for long haul goods transport.
There is a lot of waste in the current system, high oil prices will reduce that waste, but it will not be easy.
Iron Mike,
I agree EIA’s long term forecast is likely incorrect. Future is quite difficult to predict, nobody will get it right. The future surely cannot be predicted by a simplistic extrapolation of past trends, the trends will undoubtedly change, but how much they will change and how fast those changes will occur is unknown.
…there is very little to no inflation. I assume because people are not buying things as much anymore.
A more likely explanation is that steadily increasing productivity both in terms of labor and raw materials combined with a vast new workforce coming online in poor countries are keeping prices low.
Found this from some economics dude a few days ago and your 3% comment reminded me of it-
“If the global economy continues to grow at 3% per year, we will consume as much energy and materials in the next 30 years as we did cumulatively in the past 10,000.”
My guess is that’s not actually gonna happen. Something will prevent it, and I don’t mean Tech Daddy’s love.
Errr..Hickory, allow me to slightly modify “We’ll see to what extent drilling can keep up” to “We’ll see to what extent geology can keep up”.
I am of the opinion that all the world’s accessible oil-bearing sedimentary rock formations have been explored, and the economically viable formations already producing.
Peak for all the world’s conventional crude + condensate was November 2005. Peak for all the world’s hydrocarbons is 2019-2020.
Mike,
Consider the following chart with annual output of World C+C minus extra heavy (XH) oil minus tight oil (LTO), the peak was 2016.
Data after 2018 is an oil shock model scenario with conventional URR=2800 Gb.
Iron Mike,
Much of the data is formulas copy and pasted, and much of the data is copied and pasted from other sources. The model has been built gradually starting in 2012, for a very early iteration see
http://oilpeakclimate.blogspot.com/2013/10/exploring-future-bakken-decrease-in.html#more
What oil price would you expect a recession to be caused? $110/bo in 2018 US$ from 2011 to 2014 did not lead to a major Worldwide recession and claims that the high oil price in 2008 lead to the GFC are disputed by many economists, from my perspective it played a minor role relative to lax regulation of the financial industry and poor mortgage lending practices.
Note that my model assumes that oil prices rise to only $90/bo for Brent in 2018 US$ by 2025. That scenario is unlikely to lead to a recession in my opinion. Also note that although you are correct that I expect rising oil prices may lead to increased US output, I also expect that beyond 2027 that even very high oil prices will not be enough to overcome the geophysical characteristics of tight oil plays and that reduced profitability will lead to lower completion rates and falling output regardless of the price of oil.
I also expect that eventually higher oil prices (say $130/bo or more) will lead to demand destruction to keep the market balanced, people will gradually move to alternatives to oil for land transport and by 2040 oil prices may start to fall due to lack of demand for oil.
Dennis,
That’s some dedicated effort, good stuff. Do you by any chance have the annualised U.S tight oil production data or even just the Permian historical production data. I wanted to play around with it.
Nah i don’t believe high oil prices caused the GFC. I think at that time the U.S Fed rates was around 6% or something. So the economy was humming (globally also) in terms of oil consumptions, hence the high oil prices. Now it’s a different ballgame. OECD interest rates are negative or close to record lows. So consumption seems to be a factor in oil prices and why they have been so low, in my opinion. And i don’t see consumption or inflation picking up anytime soon, so oil prices will be contained, assuming no dramas in the middle east, which is almost certain to occur at some point. I think right now oil prices of $80+/barrel will hurt a lot of economies.
Yes i totally understand, you are saying by 2027ish geology will be the key factor in U.S production. Very reasonable.
It’s hard for me to picture that long term as you already know and agree, but i can see oil prices rising dramatically only if there is a war or some third world countries becoming emergent economies.
Iron Mike,
I expect oil prices to rise gradually until the peak becomes apparent, there might be a spike when people realize that the peak has been reached, but that may not be understood until 2030 as there will likely be a plateau for a few years. I think price is determined by both consumption and production and essentially serves to match the two, at some point as production growth slows prices will need to rise to destroy some demand. It is unclear what price will be needed as there are too many unknowns so I just have a straight line increase from $60/b now to $90/b in 2025, quite arbitrary and likely wrong.
The US tight oil data is at link below, Permian is Wolfcamp, Spraberry and Bonespring columns added together. All columns for US tight oil data, data by month.
https://www.eia.gov/energyexplained/oil-and-petroleum-products/data/US-tight-oil-production.xlsx
Iron Mike
Oil price was the trigger. The housing mortgage crisis set it up. Something had to trigger the beginnings of mortgage defaults. That’s why oil price was the trigger.
Dennis said “people will gradually move to alternatives to oil for land transport….”
I find that to be quite a supposition, unless you mean that the alternative will be to move by foot. In that regards, you are definitely on to something.
It takes lots and lots of hydrocarbons to mine and refine lithium, steel, cobalt, coal, copper, nickle, chrome, tantalum, titanium, vanadium, niobium, magnesium, etc etc. Even more to transform these into electric cars, windmills, silicon panels, power plants, power lines, transformers etc.
I think the window on this has been largely missed by probably a decade. Unless the world starts a crash construction program for nuclear power plants, I suggest that the putative upcoming optional ‘alternatives’ will be largely limited to ‘by foot’.
Hey Mike,
Thanks for your contributions, I think they are great.
What do you think the feasibility of the USA implementing a Coal to Liquids program are?
thanks!
Mike,
I disagree, I think we will utilize scarce resources efficiently and will find a way, but I agree it will be difficult. Keep in mind that only about 33% of the energy in fossil fuel is transformed to work (as defined in physics Force times distance). Move to a mostly electric economy powered by wind, solar and hydro and there is far less energy wasted as heat. Also utilizing heat pumps where heat is needed is far more efficient than boilers.
There is a huge amount of energy waste in the current system. Higher fossil fuel prices will eliminate much of this waste.
Also utilizing heat pumps where heat is needed is far more efficient than boilers.
Dennis, boilers are primarily used to generate electricity, or power for ocean-going vessels. Heat pumps cannot possibly replace boilers in either of these cases. Boilers to generate heat for heating are seldom used anymore.
Heat pumps for heating homes are great if you live in the southern part of the USA, or in any climate with warm winters. But they are woefully inefficient in super cold weather.
>> Heat pumps … are woefully inefficient in super cold weather. <<
Remember Paul in Halifax from the Oil Drum days? He swore by his heat pumps, even in Nova Scotia.
Will a Heat Pump Work in Cold Weather? Bold theirs.
How heat pumps work in cold weather
An air source heat pump is like a heat sponge: it absorbs heat from the outdoor air and transfers it inside your home.
Because they use outside air, air source heat pumps work especially well in moderate temperatures. But when temperatures drop below 32° F, they lose efficiency, meaning they have to rely on a secondary source of heat to properly heat your home.
Secondary forms of heat come in two forms:
Electric resistance coil heaters (the default)
Gas furnaces (when combined with a heat pump this is called “hybrid heat” or “dual fuel system”)
Air source heat pumps do lose efficiency as temperature declines but many are capable of producing their rated capacity in the -15 degree Fahrenheit range. These units are extremely efficient to zero Fahrenheit. There are actually very few places in the lower 48 where heat pumps aren’t fully competitive. They can also always be augmented by pellet stoves and the like in more trying locations.
Ron,
In cold climates ground source heat pumps work fine.
Many homes, as well as commercial and industrial buildings use boilers for heat and hot water. Heat pumps are more efficient.
I am sure ground source heat pumps work well, as long as there is no permafrost. But I think they are as scarce as hens’ teeth. I never heard of one in the South. And down here there are a lot of heat pumps with electric resistive heat as a backup. Yes, they need a backup, even down here as the temperature often drops below 32 degrees.
I have never heard of a heat pump water heater. Are you sure they exist?
There has been innovation in the heat pump sector. Geothermal works very well, but newer application not requiring the piping of water, is the “Cold Climate heat Pump”, and the RCC [reverse cycle chiller].
The RCC looks very promising (even in cold weather), and also can be used to heat water. All forms serve as efficient air conditioners.
description of RCC near the bottom of the page-
https://www.energy.gov/energysaver/heat-pump-systems/air-source-heat-pumps
Ron, regarding your comment above – heat pump water heaters do indeed exist. I have one in my basement. Its annual electricity cost is less than 1/4 of my old electric resistance unit. It also doubles to dehumidify my basement during summer months. It has a hybrid mode I use in winter that also uses resistance heat.
Ron,
There have been improvements in air source heat pumps see
https://mitsubishicomfort.com/coldsnap/?gclid=CjwKCAiAu9vwBRAEEiwAzvjq-1sryMrwaLIKnNU8VoTstU3eVpQ26xPPO7TbUpeOXAZlm5Qe3MpPvhoCUpYQAvD_BwE
and for a possibly less biased information source
https://www.efficiencymaine.com/heat-pumps/
Cold temperature performance – Because heat pumps extract heat from outside to provide warm air inside during the heating season, as it gets colder outside, the heat pumps work harder to keep up, making them less efficient. For example, a system that delivers four units of heat for every unit of electricity at 50°F, may deliver only two units of heat for every unit of electricity at temperatures below zero. There is evidence of the highest performance units operating and providing heat even below -15 °F in Presque Isle. But if the temperature drops low enough, the system may turn off completely. Be sure to check out the minimum operating temperature listed for your heat pump. If you experience prolonged periods below that temperature, consider a secondary backup heating system to maintain your desired comfort level through the chilliest nights. If you use a backup system, just be sure to switch back to your heat pump once temperatures rise, or you could quickly lose your energy savings.
https://www.energy.gov/energysaver/water-heating/heat-pump-water-heaters
The heat pump water heater probably works best in warmer climates, unless it is tied to a ground source heat pump system.
Ron, you equal heat pump with air as source, that is a useless simplification.
Ground source heat pumps work very well in cold regions. I have no issue to get 4 units heat for one unit electricity, that at -15 °C….
What does DUC stand for? Just asking for a friend…
Drilled But Uncompleted Shale Oil Wells
It means the well has been drilled and the drilling rig removed but the well has not yet been fracked.
Thanks!! That provides a much clearer picture
So, if the drilling rig has been removed, can the fracking take place or does the rig need to be brought back and reattached, etc.?
No, the drilling rig has nothing to do with fracking. The fracking spread is enormous and requires many truckloads of equipment.
https://www.bing.com/images/search?q=Images%20of%20Fracking%20Spread&qs=n&form=QBIR&sp=-1&pq=images%20of%20fracking%20spread&sc=0-25&sk=&cvid=C4D2406AFFCB49808EFAEF8B29114367
Click on any of the images of fracking spreads to enlarge.
So currently Texas is the Second Largest Producer in the World? Do I have that Right? I wonder what their daily consumption is?
Longtimber
Here are the C + C numbers for September (World) and US October.
USA 12,655 kb/d (October)
Russia 10,860
Saudi Arabia 9,895 in August. 8,545 in September
Texas 5,273 (October)
Iraq 4,680
Canada 4,390
Ovi , thanks for a great work. In my eyes to have a compleatly picture I should wish a diagram showing world oil production , world demand and oil price. Perhaps it will show based on your graph that oil growth in US is now 29,5 kb/d and DUCs dropping 100 monthly is seems clear the picture will continue the next 6 months at least. Based on historical data I believe than the oil price should be a lot higher than 55-60 usd wti.. ? As a producer in the shale patch I believe the banks , investors are focus on a future price of the shale oil. 10-15 usd increase wti will change this picture. On the other side Opec might be satisfied as things are as they want to take back market shear. If trade war stops , world growth comes back on track we will see oil growth demand exseed 2% or 2 mill bpd . Saudi might add that for 1 year perhaps 2 but than there will simply be lack off oil in rabge wti 55-65. My guess is than oil price will go to 80-100 usd wti or above. Thiere 2 wells will than be profittable and there will be same situation for some time as with the sweet spots, but first all curves shows a decrease in US oil production. This will make US a significant swing produsent because of the caracteristick of US Shale. First also many Company in US shale patch will go bancorupt as they will not be able to pay their bills with their profit. Investors in thoose Companies normaly loose most of their assets as liability is transfered into stock with values close to cero..
Freddy
I don’t think that I can come up with a chart with all of your variables.
I agree that the price of oil is critical. I also think that production will depend on how many small players are left and the big guys. They will have a much more disciplined approach that would keep the market supplied but not threaten the price.
As for oil price, I think the Saudi’s would like $75 to $80 to meet their social payments obligations. Not quite sure if $80 would slow the US economy. $80 would translate into an average gasoline price of close to $3.00 per gallon. Anything over that starts to worry the US consumer. Probably would unleash a tweet storm from you know who.
Ovi, 3 USD each gallon is not much for gazolin. In Norway that is a oil producing Country where it is also refineries for gazolin cost 1 liter 16,50 nok. Exchange course 8,8 nok/ usd and 1 gallon is 3,785 literes gives it 7,10 usd / gallon and half of that is vat, roadtax to goverment. Just wait to next time.Donald visit here and he will learn how the wall can be built…
Rather than using STEO to project future output, we could fit a quadratic to EIA monthly estimates from Jan 2017 to October 2019. Note that there is no particular reason we would expect future C+C output to be modeled correctly by using a second order polynomial fit to the past 34 months of data, but this is what we would get. I expect this will not reflect future output very well.
I use the STEO data because it shows definite signs of rolling over. Both the total and L48-GOM are rolling over, the later even more so. I have to assume they must have plans from some of the major LTO players. So in essence I am curve fitting some unknown physical/semi-factual data. Interestingly, that quadratic doesn’t peak till mid 2021.
As pointed out above, I think that the next STEO is going to lower the 2020 estimates again. Also it will be interesting to see what it will show for 2021.
On another subject, I find it interesting that the OPEC additional production curbs end in March. Do you think that OPEC is looking at the EIA estimates that are showing a flattening in output in mid 2020. (I was also dreaming if they were checking peakoilbarrel . com). NAH.
Ovi,
My guess is that OPEC is just as skeptical of EIA estimates as I am, they also have access to the earlier estimates. I am skeptical of all models of the future, including my own.
The curve I show (also based on the problematic practice of curve fitting), uses actual output data as its basis. Even this data is often revised, but it tends to be far better than a model of the future.
Dennis
Looking at the STEO chart in the post above, the increment from January to December 2019 is close to 1 Mb/d. The increment from January to December 2020 is approximately 300 kb/d. That is a significant change. The EIA must have some data that makes them predict such a dramatic slow down. Even the quadratic that is shown doesn’t do a very good job. It will be interesting if they will show some kind of a plateau into 2021.
Ovi,
The STEO from Dec 2018 showed the same type of scenario with output flat the second half of 2019. Part of the problem is the oil price scenarios are not very good, the EIA STEO team thought the price of Brent would fall to $51.50/bo by May 2020, then gradually rise to $59.50/bo by Dec 2020. A poor future oil price may be messing up their model results.
https://www.eia.gov/outlooks/steo/data/browser/#/?v=8&f=M&s=0&start=201807&end=202012&linechart=BREPUUS&ctype=linechart&maptype=0&map=
I am far less confident than you that the EIA has learned from past mistakes.
The Jan 2020 STEO will be revised lower for Nov 2019 and they may adjust their oil price assumption and get a model that better reflects the future. My guess is the scenario will become higher rather than lower for the second half of 2020 and 2021 will show continued growth at 400 to 500 kb/d over the Dec 2020 to Dec 2021 period.
Chart below shows Brent oil price scenario for Dec 2019 STEO.
Ovi,
I looked back at STEO versions from Jan 2019 to Dec 2019, the changing scenarios are due to changing oil price assumptions. They also reflect actual output estimates up to two months before the STEO is published. I focused on L48 excluding GOM price assumptions for Brent in Dec 2020 vary from $57/b to $68/b, with low prices corresponding with lower output and higher prices corresponding with higher output (which seems reasonable).
Clearly nobody knows the future price of oil, they may use demand projections based on economic forecasts, OPEC decisions and the futures strip as the basis for their oil price scenarios (or it may be some sophisticated model). If their oil price scenarios are correct their model may be close, I tend to think their higher oil price scenarios (say $65/bo for Brent in Dec 2020) are more reasonable, but I never get future oil prices right. 🙂
Page with STEO archives below
https://www.eia.gov/outlooks/steo/outlook.php#issues2019
Russia has Peaked, according to the Minister of Energy.
Russia’s Interest In Oil Production Cuts Is Waning
Russia is planning level production for the next 4 years.
“As far as the production cuts are concerned, I repeat once again, this is not an indefinite process. A decision on the exit should be gradually taken in order to keep up market share and so that our companies would be able to provide and implement their future projects. I think that we will consider that this year.”(2020)
Meanwhile, Russia’s energy ministry is assuming that the country’s total output is to average around and slightly above 11.2 million barrels per day until 2024. In other words, it is not building any cut into its plan.
Russia’s peak month, so far, was December 2018 at 11,408,000 barrels per day. The average daily production for 2018 was 11,115,000 bpd. Average production for 2019 was 11,211,000 bpd. This is the level they hope to hold for the next 4 years.
Russia’s production increased by an average of 96,000 barrels per day in 2019. They are not expecting any further increase at all. They just hope to hold at 2019 levels for another four years. I think they will be very lucky if they manage that.
Point is, the world’s largest producer, the USA, will likely peak in a few months. The world’s second-largest producer, Russia, is admitting they have peaked. The world’s third-largest producer, Saudi Arabia, has very likely peaked though they do not admit it. OPEC likely peaked in 2016, *Iran and Venezuela notwithstanding.
*Iran peaked in 2005 at 3,938,000 bpd. My Venezuela records only go back to 2001 when they produced 2,961,000 bpd. However, they peaked several years before that. However, neither is producing at maximum capacity today due to political problems. However both are clearly in decline regardless of political problems keeping them from producing flat out.
If we are at peak oil right now we are damn close to it.
The Russian Chart below is C+C through December 2019.
Ron(if you prefer Ronny, let me know),
Agree Russia is probably on a plateau, I disagree on the US reaching peak soon, I expect 2025 or 2026, depending on the price of oil. I agree once US tight oil output peaks in 2025/2026 the World will be at its peak within 2 years (one year before or after the peak in US tight oil), so 2024 to 2027 for the World C+C peak window (12 month centered moving average of World C+C output).
No, I prefer Ron. I just logged in on an older computer and it forced Ronny on me.???
I must emphatically disagree. The US is all that is keeping the world from peak oil right now if it is. But even if the US does not peak in 2020 oil production will dramatically slow down. That will not be enough to keep the peak oil wolf away from the door. Only Brazil and possibly Canada can show any appreciable increase in production while almost every other nation in the world has either plateaued or is in decline.
Ron,
Perhaps. I think there is more output that could come from Iran, high oil prices would probably change Trump’s posture on Iran. Also high oil prices would lead to faster development of tight oil resources, oil sands, and conventional resources,
much changes with higher oil prices, by 2023 we will have surpassed the 2018 peak, probably sooner than that, perhaps 2021.
Ron
Guyana is coming.
Dec 26, 2019, 10:39am
December 20th marks a historic milestone for Guyana, the small South American country that is soon to become the fastest growing economy in the Caribbean. Late in the evening, ExxonMobil and its partners announced that it had produced the first commercial crude from the Liza field, located in Guyana’s offshore Stabroek Block. The output from the first phase is expected to reach capacity of 120,000 gross barrels of oil per day (bdp), utilizing the Liza Destiny floating production storage and offloading (FPSO), and the first cargo is set to be sold within several weeks. Stabroek Block is expected to produce 750,000 bpd by 2025.
Looking at the time scale, this field will add about 150 kb/d/yr up to 2025.
https://www.forbes.com/sites/davidblackmon/2019/12/26/exxonmobil-announces-transformative-first-oil-in-guyana/#9e9e42f6d27e
Ron
I wonder if you saw this article.
https://uawire.org/russia-announces-plans-to-withdraw-from-opec#
I found this statement interesting, in that if they can’t increase production, and are at max, why are they worried about market share.
“We will still need to gradually make a decision to withdraw, in order to preserve our market share, and so that our companies can promote and implement their future projects. I think that we will consider this, even this year,” the minister added.
Another article says they are at a new high. Mind you it is the highest average. Maybe 2020 will be lower.
https://oilprice.com/Energy/Energy-General/Russian-Oil-Production-Hits-New-Records-Despite-OPEC-Deal.html
What message are they trying to send
Ovi, the data in my chart above is from the official Ministry of Energy web site, converting tons to barrels at 7.33 barrels per ton:
MINISTRY OF ENERGY OF RUSSIAN FEDERATION
The site has not updated the December numbers but the Minister has released them. They can be found here:
UPDATE 1-Russian oil, condensate output surges to record-high in 2019
In December, total oil and gas condensate stood at 11.262 million bpd, up from 11.244 million bpd in November, according to the data.
Those are the exact numbers I used in my chart above. And yes, 2019 was a new high, exactly as I stated in the post above. Its yearly average beat the 2018 yearly average by 90,000 bpd.
Concerning 2020 average, it could not be stated any clearer than this:
Russian Energy Minister Alexander Novak expects Russian oil and condensate production of between 555 million tonnes and 565 million tonnes in 2020, or 11.12-11.32 million bpd using a conversion rate of 7.33 barrels per tonne of oil.
Or this from the link:
Russia’s Interest In Oil Production Cuts Is Waning Bold mine:
Russia did not comply with the cuts in 2019.
Got an exemption for condensates at the OPEC meeting, though this was not discussed in the press conference.
Achieving another cut of 70,000 b/d in first quarter appears to be beyond its capability, given past statements.
Russia is planning level production for next 4 years.
And is prepared for oil prices to drop to $25-30 per barrel.
You wrote: I found this statement interesting, in that if they can’t increase production, and are at max, why are they worried about market share.
I really don’t understand that question. If they plan on producing 11.2 million barrels per day for the next four years, then they should be worried about their market share. Whether they can or cannot produce more than that is beside the point.
Ron
My point was if they are at Max production and they can sell it all, I did not understand why they would be concerned with Market share. If the market were over supplied and they couldn’t sell it all, then I could understand their concern with market share.
Hey, And is prepared for oil prices to drop to $25-30 per barrel. at that price, the market would be definitely oversupplied. And they would be extremely concerned with market share.
Ron
I think that you and I, along with a few others on this board, are headed for peak oil soon, so oversupply should not be an issue
Ovi,
When is soon? Do you have a window? Perhaps 2020 to 2022? Soon can cover a lot of ground, I expect a peak soon as well, in the 2024-2026 range. I think you expect a peak sooner, perhaps the March 2020 date you have mentioned.
I think if the slope of the output curve becomes zero, it will be an inflection point rather than a peak, if the second derivative (of output curve) becomes negative, it will be brief, (3 months or less) in my opinion.
Dennis
Yes I meant March, but only as a first one. As prices rise I think we will see an undulating plateau until the supply/demand market direction is clear to OPEC. They are looking for a peak or definite slowing in US production so that they can begin to increase their output and regain control. They also will keep an eye on Brazil and Norway for their upcoming bump up in output along with Guyana. However I do believe that 2020 will provide us with a much better picture of what to expect.
Ovi,
It seems pretty clear that US oil output growth is slowing. I imagine OPEC may continue its cuts to keep oil prices up.
If you play with my model you will see why I think tight oil output will continue to grow.
Ron,
My guess is the market would not be oversupplied for long at $25-30 per barrel unless we are in the middle of Great Depression 2.
In fact I doubt we will see Brent under $50/bo unless there is a major Worldwide economic crisis prior to 2040 (and I expect there may be a major economic crisis around 2030.)
Dennis, I agree. I doubt we will ever see oil prices below $50 again. I think the mid $60s will be the norm for the next couple of years, then perhaps higher.
Of course, we are both just guessing, trying to predict the future. And if I was any good at it I would be filthy rich today. I am not, which means I am a lousy predictor.
Ron,
I am also a poor predictor of the future, but I agree with you on oil prices, so maybe we are right (or more likely both of us are incorrect.)
Dennis.
I do think you are learning! You continue to post that you are more than likely incorrect on your future oil price predictions.
Don’t feel bad, a famous CNBC talking head commodity trader (who recently announced he was hanging it up) predicted less than three years ago that WTI would never be above $44 again in his lifetime.
In the past 20 years we have ranged from $8 to $140. In June, 2014 $99.25. In February, 2016 $25.
The past two years have been somewhat stable. Just a range from $42 to $74. Lol!!
Shallow sand,
Yes I have learned to state the obvious very clearly.
Early on I thought it need not be said that nobody can predict the future, this has always been as clear to me as 1+1=2, my scenarios have always been what might happen under a certain set of assumptions, there are many and any one being incorrect will make the scenario wrong.
Not many get this, though I am sure you and a few others probably do.
I agree that future oil prices cannot be predicted, but I do think a scenario with high consumption of oil and low output of oil is likely to lead to higher prices.
Dennis.
Just being sarcastic.
Heck, who in 2007 would have predicted 13 million BOPD of C + C? Maybe one person in a thousand?
I know you have to plug in something. I don’t equate your oil price predictions to those of CNBC talking heads.
Thanks shallow sand,
I have learned a ton from you, and I appreciate that you have taken the time to teach us about the real world of the oil field.
This is what tight oil output might look like with a low oil price scenario (Brent at no higher than $70/bo in 2018 US$).
I just don’t think oil prices could remain low under this type of scenario, but I certainly was not among those predicting US C+C at 13 Mb/d back in 2007 (or even 2012 when I started blogging), so I do not predict the future very well.
chart kind of small, click on chart for larger view.
Wow . What a great effort and what terrific output . Hats off to you Ovi . I just like to add my two bit . In my opinion the DUC stuff is a red herring . Nobody knows what their output will be . Hell they could be all dry being located in Tier 3 or 4 area^s . Nobody has any information on these ,so count them as a future source of supply is tossing a coin in the air , I will go a little further , I would call the probability of the DUC accounting
being a fraud at more than 50% . Mike Shellman and SS can pitch in ,because they have their ears to the ground .
hole in head
Thanks
I just try to analyse the data I find and try to make some sense of it. Unfortunately I do not have any insight on what it really happening in the fields. I assume the big banks like GS and JPM, who also make predictions send their analysts out to interview some of the bigger drillers to get some further insights.
As for the DUCs, I appreciate your comments regarding the quality of the DUCs. I have been asking myself the question “How do we know all of these DUCs are so good”. Thanks for answering. Like you say, we don’t know.
Ovi,
Excellent work!!!
hole in head, I also think the DUC inventory could be a red herring. The best DUCs would be completed first and some of the remaining DUCs could be dry, or of such low quality, that they are never completed.
I agree with your STEO Lower 48 model fit (red line) predicting production under 13 mbd. We’ll see if the EIA weekly supply estimates for last week of December stay below 13 mbd.
https://www.eia.gov/dnav/pet/hist/LeafHandler.ashx?n=PET&s=WCRFPUS2&f=W
I know these weekly estimates are just estimates but they are indicating a short peak plateau from Nov 2019 to Dec 2019, as the numbers oscillate between 12.8 and 12.9 mbd.
Tony
I think they will but will cross 13, possibly in January.
Informative post again. Thanks Ovi.
Crude is up over $2.00 as the US apparently killed Iranian General Soleimani. There is speculation this could lead to all out war in the region. This definitely could put peak oil in the rearview mirror, or it might just be a lot of noise. We will see.
A drone strike.
If true, some good intel.
Iran holds the trump card unfortunately.
Another gift to Putin
OPEC probably thinks that US shale oil is peaking about now
“Output from the Organization of Petroleum Exporting Countries fell by 90,000 barrels a day to 29.55 million in December, according to a Bloomberg survey of officials, ship-tracking data and estimates from consultants including Rystad Energy AS and JBC Energy GmbH.”
https://www.msn.com/en-us/money/markets/opec-output-falls-as-gulf-nations-step-up-delivery-of-oil-cuts/ar-BBYyrZh
WTI almost $63 now
Has anyone heard of ESAI Energy which provides energy data services?
https://esaienergy.com/
https://www.bloomberg.com/news/articles/2020-01-02/permian-pipeline-competition-heats-up-as-capacity-outruns-supply
Oil producers are warning that they are preparing to curb spending this year to boost investor returns. “The Permian is definitely slowing down,” said Elisabeth Murphy, an analyst at ESAI Energy Llc. Declines from legacy wells are outstripping the new wells, and there aren’t enough rigs to offset the decline in the legacy wells, she said.
https://esaienergy.com/eia-and-iea-are-too-optimistic-on-shale/
ESAI Energy believes both the EIA and the IEA are overly optimistic in their November projections of US crude oil production in 2020, according to the company’s latest North America Watch. ESAI Energy sees a deceleration in growth to about 650,000 b/d next year, in contrast to the EIA and IEA forecasts of 1.0 million b/d and 900,000 b/d, respectively.
ESAI increase of 0.65 mbd is year on year increase. EIA STEO is 12.25 mbd average for 2019. Add ESAI 0.65 mbd to get 12.9 mbd average for 2020. EIA MER says first estimate US crude oil production 12.847 mbd for Nov 2019, page 57.
https://www.eia.gov/totalenergy/data/monthly/pdf/mer.pdf
Elisabeth Murphy says Permian legacy decline outstripping new wells so US peak oil about now.
Tony
One of the problems that is difficult to sort out is what oil are they talking about. On this board, we mostly think in terms of C + C. IEA and OPEC quote US numbers that include NGPLs, which currently is running at close to 0.5 Mb/d. If we look at C + C, average 2020 over 2019, it will also be close to a 0.5 Mb/d. There is the 1.0 Mb/d. But going forward from today, it looks like the C + C increment will only be about 300 kb/d. So it comes down to trying to clarify we are are discussing apples to apples or apples to apples + oranges.
I am still sticking with March on LTO and the whole US.
You will never get a definition. Lease condensate, plant condensate, NGPLs and pentanes+ overlap — particularly via natural gasoline. The API number for where crude becomes condensate has changed and is changing. Delineation from NGPLs will not define either.
Watcher,
In the US crude plus condensate has always been grouped together so the API gravity that determines the line between crude and condensate does not affect output of C+C. It would make sense for natural gasoline from NG processing plants to be included in the C+C numbers as many nations do, but the US has always done it this way and will not change. The amount of natural gasoline produced in natural gas processing plants in the US is relatively small.
In October 2019 there were 5022 kb/d of NGPL produced and only 591 kb/d of natural gasoline (aka pentanes plus). The rest was LPG (sum of ethane, propane, butane, and isobutane) or what Ron refers to as “bottled gas”. In 2000 the US produced only 2000 kb/d of NGL, output of NGL has increased sharply since 2010. Natural gasoline output was about 300 kb/d in 2000.
https://www.eia.gov/dnav/pet/pet_pnp_gp_dc_nus_mbblpd_m.htm
Ovi,
Consider what a projection using a second order polynomial (quadratic) to the STEO from December 2018 would have looked like had you done so in December 2018 and compare that with a similar projection based on EIA monthly data from Jan 2017 to October 2019. The results are very different, also notice how the Dec 2018 STEO flattens in the second half of 2019, just like the Dec 2019 STEO for the second half of 2020. It might give one pause. I think both of these projections will be incorrect, but the higher of the two will be closer to reality (I think it is a bit too high).
In the chart below the dashed line is EIA monthly data and the solid line is the Dec 2018 STEO, the dotted trendlines are quadratic (or 2nd order polynomials) fit to the underlying data.
Dennis
I agree. Different starting points and different order polynomials are going to give you different answers. The DPR and LTO net production charts started in Jan 2018, along with the STEO. I guess the point I was trying to make was there may be a first peak in LTO production sometime between March 202o and Mid 2021.
Ovi,
The same second order polynomial was used in every case, generally if one is going to curve fit, using more data makes sense, in addition for the fit to the monthly data the R squared is higher for Jan 2017 to Oct 2019 than it is for Jan 2018 to Oct 2019 for the second order polynomial trend line.
Does the Brent Oil price scenario from the December 2019 STEO look reasonable to you? Seems a bit low to me, especially if one believed that World oil output will peak before the end of 2020.
Ovi,
My main point is that if that is correct, the peak is likely to be temporary, there have been many pauses in the past where output growth of World C+C was close to zero. This might be one of those cases, if oil prices remain at $60/b or less for Brent, I think it more likely that Brent will be at $65/b0 or higher and there will be slow growth in US output at an average annual rate of about 430 kb/d from 2020 to 2024 and gradually slowing to zero from 2024 to 2026. The Scenario for US L48 excluding GOM C+C in chart below is my current best guess.
The second order polynomial trend line fit to monthly EIA data (dashed line) shown for comparison, dotted line is trend for quadratic fit.
Dennis
I find it difficult to believe the EIA projection for Brent. It is based on this premise: “EIA expects crude oil prices will be lower on average in 2020 than in 2019 because of forecast rising global oil inventories, particularly in the first half of next year.”
With OPEC cutting another 500 kb/d starting yesterday, I can’t see the inventory build they mention. I think that Brent will be between 65 and 70 after mid year, as summer demand starts to kick in and it is clear that US crude production growth is slowing.
Attached is the futures curve for Brent. While it is showing decline prices out to December, the more important thing to notice is the strong backwardation, i.e. each successive month, the price is lower. Looking at the front month, what this curve is saying is the following. The refiners are saying we want your oil NOW, not 12 months from now. The 89¢ drop from the front month to April is big compared to WTI which is 23¢.
I would be interested on hearing other opinions on the meaning of backwardation
Ovi,
Agree with your price prediction, the July 2019 STEO has Brent at 67 per barrel in 2020 with L48 excl gom at about 11 Mbpd in December 2020.
Not sure about backwardation have never traded in futures market.
Dennis
I have not traded futures either. However I have heard market analysts talking about it. Some say why buy oil stocks when the futures curve is showing the price of oil will be cheaper one or two years from now.
Other analysts say, no no no, that is not what the futures curve is saying. When it is in backwardation, it means that demand is good/high and that is why refiners pay a premium over the next month contract to get their oil now.
The other mode, when the price is higher for each future month, is known as contango. I think the drillers like this. Say Front month oil is $50 and 6 months out it is $53, which was the situation in early 2018. A driller could drill a well, and knowing its potential, cap it and then sell a contract to deliver the oil 6 to 9 months out at a higher price and not have to pay a storage charge for tank usage in Cushing.
I wish that someone on this board with experience would confirm or correct my thoughts on the proper way to interpret the curve and whether it is effecting the rig and frac spread count.
Ovi, I have traded futures, though I never made money doing it.
Backwardation or contango, they both represent nothing but the traders’ consensus of opinion. Traders look mostly at stocks to decide whether or not the price of oil will go up or down. However many look at other price signals also.
The futures price has very little to do with hedging by the actual buyers and sellers of the physical product. Well over 90%, likely closer to 99% of all contracts traded have nothing to do with the physical product. They are paper barrels that are closed out for cash, either before expiration or at expiration.
So the futures price represents nothing but the traders’ hopes and expectations.
At expiration the closing price must represent the spot price, or very nearly so. In other words, the futures price is always a guess at what the spot price will be at expiration.
Many people think the spot price follows the futures price. It does not. It’s the other way around. The spot price represents a negotiated price between the buyer and seller. Only a tiny fraction of all oil bought and sold, are deliveries taken as a result of a futures contract.
Thanks Ron,
Sounds reasonable.
Tony,
The legacy production change becomes smaller in absolute value as fewer new wells are completed (see the numbers from 2015 to 2017 in the DPR), also as oil prices rise the completion rate will increase (see US tight oil output from 2016 to 2018 as completion rate increased.) Perhaps the growth in US tight oil output will fall to zero for a month or two, this is less likely a peak and more likely to be an inflection point as for y=x^3 at (0,0).
Just read a Bloomberg piece claiming that the US has become a net exporter of petroleum.
This is not true for C+C where the US remains a net importer as of October 2019 at 2861 kb/d, I do not trust the weekly estimates they tend to be very inaccurate and shed little light in my opinion.
The US produces significant quantities of NGPL and that is what is exported (and products created from NGL). There is a net export of petroleum and petroleum products, but it is crude oil plus condensate that is used to produce the liquid fuel needed for transport, that is the number to focus on and the US remains a net importer of C+C, though much less is imported than the 10,000 kb/d imported in 2000.
The killing of Irans mastermind behind the Iraninan expansion strategy and proxy attacks, Soleimani will change a lot … it’s like killing Pompeo.
Are you saying Pompeo is a mastermind? I’d say he’s a political hack dreaming of the Rapture. There’s no way he can understand what is happening in the region with those blinders on.
Anyway after a Confederate raid made off with 12 mules and captured a brigadier general, Lincoln said, “How unfortunate! Those mules cost $200 a piece!” On another occasion he remarked he could make a general with the stroke of a pen.
No, but Soleimani was seen as 2nd important person/influencer of iranian foreign policy, which I think is a good match to Pompeo in terms of the ranking.
Not a fan of Pompeo.
Graduated first in his class from West Point, which, like all the US military academies, is far more difficult to be accepted into than other undergraduate universities, like Stanford or Harvard or Duke.
Left the Army after serving the academy time obligation at the rank of O3 (Captain). Went to law school at Harvard. Joined Williams & Conolley, the most selective law firm in the US, located in Washington DC.
Parents not rich. No evidence accomplishments derive from anything but intelligence and merit.
Not pleased with him having a Koch swamp aspect the President hoped to drain, but suggesting he is unable to grasp concepts just cannot make sense given the credentials.
Oh, and he once ran Sentry International, an oil equipment firm. Pretty sure they were non fracking equipment at that time. Conventional well pumps.
Hint:
He is military, not from a educational perspective (or he would not be military)
I don’t know what that means.
His Bachelors degree was in Engineering Management. Most in that discipline seek a Masters but West Point’s program encompasses both. Stanford, Duke and of course Hopkins offer degree programs in Engineering Management. The academies bestow bachelors degrees on graduating cadets and they usually are well beyond any accreditation minimums. These are undergraduate institutions. Military subjects are in addition to what civilian schools would teach. Not instead of. Degrees offered at West Point include all of the sciences and engineering disciplines as well as Philosophy, English, Foreign Languages, Psychology, Sociology and PoliSci.
A graduating cadet this year from West Point has been selected to be a Rhodes Scholar.
A typical 4.0 GPA is required in high school of applicants to the academies. Operative word is typical. There have been 3.95 applicants accepted. It’s very rare because there will be competing applicants with higher GPA. An applicant must have participated in leadership positions at their high school in extracurricular activities of both athletic and non athletic sort. This usually means some kind of debate club plus lettering on some sports team.
Additionally, each member of Congress is allowed to make 2 recommendations from the district (or state if a senator) per year per academy. Without such a recommendation the applicant will not be accepted. If the applicant with a Congressional recommendation does not have a 4.0 or a history of leadership in high school, they will be rejected. Congress staff people know this and they no longer recommend applicants with no chance.
You don’t see anything like this for other universities. They are accepting less qualified candidates. I don’t know where you got the impression that academy grads are uneducated, but it’s essentially absurd. These kids are the cream of the national crop.
You don’t comprehend what I’m saying.
He was going to a Military School– you have subtracted your ability to educate yourself by agreeing to those conditions.
Having “requirements” to enter is just having selective agreement among people wanting those reductions in their “education”.
Look at the result of that “education”.
Reality often brings enlightenment.
50 Universities with the Most Nobel Prize Winners
https://www.bestmastersprograms.org/50-universities-with-the-most-nobel-prize-winners/
West Point is absent–
What a surprise!
West Point is not a research institution. How could there be Nobel Prize winners? None of the academies are research institutions.
There is a Naval Post Graduate Institute in Monterrey, but generally, advanced degrees for academy grads are sought from civilian universities who have research programs. This usually happens after some years of service when it becomes clear senior ranks require an advanced degree.
Graduating cadets who wish to compete for med school will nearly always win that competition because they will have superior qualifications. On graduation from med school they will be expected to serve as military doctors X number of years. Most choose to stay and complete a career. The same is true of JAG oriented cadets, who will apply to law school and generally always be accepted in any competition.
I don’t think you understand these kids are in a different, higher league than elsewhere.
Norman Foster Ramsey’s father went to West Point—
Fill me in– where and who are they?
Berkeley has a parking lot for theirs—
Law is nice (my daughter is a lawyer), and we need doctors, but they are not research scientists, getting Nobel Prizes.
Technicians at best.
Enlighten me– surely a few are able.
Hightrekker, what institution of learning endowed you with your irrefutable reasoning?
Surely you can enlighten me on Nobel Prizes from West Point grads.
There must be hundreds—–
Pompeo is a Jesus freak. That mans he is not mentally capable of understanding what is going on in the Middle East and Central Asia, because he sees everything through the filter of fairy tales and outright lies that make up his world view.
The brainwashing that American military training puts you though is increasingly influenced by crazy Christian ideologies.
He claims to be doing “God’s work” in the Middle East, but that mans trying to foment a nuclear war between Israel and Iran, which nutjobs of his ilk believe will trigger “The Rapture”.
https://www.dailykos.com/stories/2020/1/5/1909619/-Pompeo-Awaiting-the-Rapture-Pushed-Trump-to-Strike-Iranian-General-Soleimani
No, but Soleimani was seen as No2 in Iranian foreign policy, same ranking I would give Pompeo – without weighting his skills…
In think Envision is right. Soleimani was a high ranking figure. While it’s difficult to define an equivalent in another country, Pompeo looks like a good shot (no sarcasm intended here).
This will bring global volatility to new highs, including oil prices and economic development. Now it’s absolutely impossible to predict the developments that will take place in 2020.
From now on it’s not just flipping a coin anymore – it’s rather playing Russian roulette.
it’s like killing Pompeo
Really? Taking that idiot out of the picture would be of no concern.
Lets refrain from talk of killing individuals. Thanks.
Agree, sorry for the post
Gosh, ~20 ignorable posts just because OP compared Soleimani to Pompeo-really folks?
Anyway, Trump is insane. I hope the Iranians will somehow refrain from reacting and wait for the Democrat candidate to (hopefully) win.
Soleimani was much more important to Iran, than Pompeo to USA.
Pompeo is a dime a dozen.
Lets remember- the biggest qualification for being a Trump appointed official is being ‘a yes man’. Thats all that counts with him.
Soleimani was the orchestrating the international operations (Quds forces) of the Iran’s Revolutionary Guard Corps, ‘in direct support of non-state actors in many countries, including Lebanese Hezbollah, Hamas and Palestinian Islamic Jihad in the Gaza Strip and the West Bank, Yemeni Houthis, and Shia militias in Iraq, Syria, and Afghanistan.’
On a similar topic- it was extremely foolish to pull out of the Iranian nuclear deal. Major foreign policy blunder.
^There is a lot of waste in the current system, high oil prices will reduce that waste, but it will not be easy.^
This is from Denise . I fully agree with you . But now the paradox ^ My waste is your income ^ . A living example tourism . All tourists do is sightseeing, eating and buying souvenirs . Pure entertainment . But take this away Turkey,Greece,Egypt , Thailand etc would all collapse and not to mention the low cost airlines,hotels etc, and the municipalities like Charleroi which have outstanding bonds for loans they took to to build the airport . Easier said than done . Our economic system has two important characteristics without them it would collapse .
1 . Continuous growth
2. A landfill economy .
So choose your poison .
“There is a lot of waste in the current system, high oil prices will reduce that waste, ”
Hole in the head- “Easier said than done . ”
Absolutely true. but not as if there will be a choice.
Time to start developing priority of use in a rational way.
But that won’t happen- available oil will just follow the money, and towards economic allies.
Holeinhead,
Perhaps humans will change their social structure, takes some time, but it can happen. What structural changes am a pointing toward? No idea, these types of changes happen gradually, sometimes the physical and social changes reinforce each other, today’s society would be almost unrecognizable to someone from 2000 years ago.
Maybe the donut economy is one approach we will move toward, note that there are no perfect solutions.
https://en.wikipedia.org/wiki/Doughnut_(economic_model)
Fred Magyar was a fan of doughnut economics, IIRC. Where is Fred? We miss you!
John,
I miss Fred too, he wanted to get away from POB, hopefully he will stop by from time to time.
Denise ,you are basing your idea of the ^perhaps change^ on a rational human behavior . Unfortunately ,human beings are not rational but rationalizing creatures . We do the action we want to do and then rationalise it later . Further with so many black swans around we now do not have the time and nor the ability (no surplus nett energy) to allow change to happen gradually . The world has now entered the ^musical chairs^ phase where one chair is removed and then two and so forth . Those who can^t get a chair are thrown on the roadside . Example Venezuela,Yemen,Iraq, Afghanistan etc . You say ^ There are no perfect solutions^ . I say there are absolutely no solutions except chaos and mayhem as we enter the end of Industrial civilisation . There will be many false hopes and rallies, like EV will save our butt and AI will take care of this and that , renewables, but they will be just that, false prophets . We are now at the edge of the Seneca cliff ,the question is how fast will be the slide and slide it will ,I promise you that .
Holeinhead,
Perhaps you have a crystal ball. Mine is in the shop. The future is unknown.
Holeinhead,
I am basing a theory of future social change on a study of human history for the past couple of millenia. If you think social change has reached some final endpoint beyond which we will never go strikes me as an absurd point of view.
Note that the donut economy was simply pointed to as a possible alternative to the current system, I make no claims to know what form a future social structure might take. It will simply be different from the current system, the possibilities are literally infinite.
My dear friend ,you just confirmed what I said . BAU is coming to an end . I agree that the possibilities are literally infinite but the all will be to the negative side of the equation . Nobody including me knows the shape of society to come but I am ready to make a bet that the outcome will be a fall in prosperity,living standards and chaos . The number of people who understand the phenomenon of peak oil and its dynamics(tks Rockman) are numbered the rest continue flying blind . Robert Hirsh said a 20-30 year period for transition, but we missed the bus . The shale story has only extended our road to the Seneca cliff , not obliterated it . All on this forum understand very well that ^ Energy Rules^ and we cannot escape this fact . Be well and your response is appreciated .
holeinhead,
This is where you claim foreknowledge, I claim none.
My claim is the more realistic of the two.
We do not know the future, end of story.
ButtHead
“without them it would collapse”
Nonsense, continuous growth and a landfill economy are signals of cheap abundant resources. Man will continue economic activity without them for survival. Change is not collapse. You write like a spoiled child threading a temper tantrum.
Economics is the study of societies use of limited resources. Expectations like yours will change over time as resources become scarce. Also, man will find substitutes and alternatives
Just came across two recent articles on energy-economy-environment that might be of interest to others:
Hagens, N.J., 2020. Economics for the future – Beyond the superorganism. https://doi.org/10.1016/j.ecolecon.2019.106520
King, C.W., 2020. An integrated biophysical and economic modeling framework for long-term sustainability analysis: the HARMONEY model. https://doi.org/10.1016/j.ecolecon.2019.106464
Primary vision has frac spreads down another 10 to 280 for the week ended 1/3/2020. I thought it might bounce up after the 30 drop last week, but its down 10.
Frac spreads now down 40% to 280 from peak of 465 ~6 months ago. That has got to have a tremendous impact on the growth story going forward, the LTO growth is decreasing over the same period is surely a coincidence … not
With rig counts and frac spreads down expect further drawdowns of DUC, I don’t see refreshed drilling budgets saving the day here in 1H20…
I do not see growth in 2020 that treadmill is speeding up and the runner ain’t as fit as he thought ….
Frac spreads down when oil prices have been going up means US shale oil probably peaked, meaning US crude oil peaked in Dec 2019.
Tony,
It takes some time for prices to affect things, give it a few months. Also we do not know the split between oil and gas focused frac spreads. Through Nov 2019 tight oil output has continued to increase, a winter slowdown is pretty common.
Dennis, I think there’s already been enough time. Frac spreads have continued dropping since early 2019. That’s several months. Have a look at the light blue line in the chart below – a huge drop since mid 2019.
“Proppant loadings currently sit at 5 year lows, with little indication these will rise into year end.” (Proppant includes frac sand which is used by frac spreads)
http://blogs.pvmic.com/tag/frac-spread-count/
“The proppant data shift in the Permian supports the decline in completion crews, and shows the extent of the slow-down. The fact that completion crews in the area continue to be released means the proppant loadings will shift lower into year-end. This will keep pressure on pricing and remain a headwind well into the middle of next year.”
Permian Proppant Seasonally Adjusted
Tony its interesting to note PVMIC are no more in the loop re predictions
noting in late September they expected the count to bottom out. Since this time close to another 100 spreads down.
https://www.rigzone.com/news/frac_spread_drop_could_end_soon-25-sep-2019-159898-article/
It seems the drops each week are increasing in the past wee while how much longer they can continue to decrease is a complete guess. One thing is for sure completions and new oil coming online must be well below any forecasters model ….
https://twitter.com/primaryvision?lang=en
Note that we do not have the frac spread counts for the Permian basin only all frac spreads in the US (oil and gas). Proppant loadings can also change if drillers realize they were using more proppant than necessary and cut back. So far output has continued to increase in the Permian basin through Nov.
We don’t really have decent information on frac spreads, only output, completions and drilling rigs.
Tony,
I am referring to recent increase in oil prices. For most of 2019 oil prices have been pretty low.
As Permian oil production falls because “declines from legacy wells are outstripping the new wells” means that US crude oil production peaked in Dec 2019 at around 12.9 mbd.
“The Permian is definitely slowing down,” said Elisabeth Murphy, an analyst at ESAI Energy Llc. Declines from legacy wells are outstripping the new wells, and there aren’t enough rigs to offset the decline in the legacy wells, she said.
https://www.bloomberg.com/news/articles/2020-01-02/permian-pipeline-competition-heats-up-as-capacity-outruns-supply
Tony, if so, I think Ron was right with his 2018 world peak.
if one assumes no increase after Dec 2020 as well as believing this forecast. Most forecasts expect at least a small increase in 2020 over 2019. By 2021 it is likely the 2018 peak will be surpassed, in my opinion.
Dennis, I do not doubt that what you assume could be correct – in a perfect world. But I strongly suspect that we’re close to a cyclic economic downturn – in fact, it’s already overdue, in the whole history of capitalism we never had such a long economic run. So if this downturn strikes, it should be happening very close to 2021 and demand should dip sharply. After that, when recovery reincites demand, the Red Queen will be running like mad. That’s why I see a very high probability that 2018 was the peak year.
Westexasfanclup,
Often during recessions World demand for oil continues to increase, severe recessions or depressions like 1930 or 2008 happen about every 60 years, so I am not expecting another for many years, sure we may have an economic slowdown, in that case the growth in oil consumption may slow a bit and oil prices might even decrease, depending on oil supply. The recession you expect I think will be mild and growth in oil consumption will resume within a year (if it slows at all), then oil prices rise and output goes up. Also keep in mind that as fewer wells are completed in tight oil plays, the treadmill slows (legacy production change becomes smaller in magnitude, aka absolute value).
In short, I disagree that 2018 will be the peak in annual output for World C+C, I think it will be some year after 2020, with the most likely years being 2024 to 2027.
This graph seems right at the current oil market with ballance between demand abd supply even storage off oil starting to go below 5 years average. Think now WTI will be in range 55 – 65 USD each barrel. Most reasonable if market get more tight Opec and espesialy Saudi might be able to add 2- 2,5 million bpd to the market. That might be enough for handeling growth in demand together with increased output from Norway, Brazil, Guyana for 2020,2021. Think US shale increase will be zero in 2020, and -500k to 1 mill k bpd in 2021 before activity gradualy will increase with increased oil price in 2022. Oil market will than in 2023 again be over suplied and price will again drop to 55-60 usd WTI.
I doubt Saudi Arabia can add 2- 2,5 million bpd to their production. They’re facing a natural decline rate of around 800,000 barrels/day per year, which they so far have been able to overcome with mega projects of their existing fields. But there’s no more mega projects in the foreseeable future that are able to compensate for natural decline. At the moment, the only hope for increased Saudi production is to start up their portion of the Neutral Zone.
Frugal , I agree it might be difficult for Saudi Arabia to add 2,5 mbpd. As of today I believe their production is about 10 mbpd and according to this Oxford study their goal have been to have a total capacity of 12,5 mbpd. https://www.oxfordenergy.org/tag/spare-capacity/?v=c2f3f489a005
Regarding the Neutural Zone according to this report it will soon be solved. Seems now they are ramping up drilling activity and investments to add more resourses and get more oil out of exsisting fields. Will be very interesting to see what future will bring. I believe from what I read here Russia have not much to add…
In the last 8-10 years, the increase in production in Russia was mainly due to Eastern Siberia, but it seems that this source has been exhausted.. Here:
https://burneft.ru/archive/issues/2019-07/9
Tony,
The MER most recent month is simply based on EIA weekly estimates, it should be ignored.
US c+c output will be roughly 12.75 Mbpd for Dec 2019 and about 13.2 Mbpd for Dec 2020, consistent with the IHS estimate.
Tony
I have to wonder what her information source is. The latest LTO report states that the Permian output has been increasing by 100 kb/d, noted in the post. If the LTO data is correct, Permian will continue to be net positive till mid 2020.
Ovi,
I just sent her this question through LinkedIn.
Elisabeth,
Could you please tell me the basis for your statement of “Permian legacy decline outstripping new wells”? The recent EIA DPR shows Permian new wells just ahead of legacy decline by 48 kbd for Jan 2020.
https://www.eia.gov/petroleum/drilling/
Thank you, Tony
Her linkedin profile is here
https://www.linkedin.com/in/n-elisabeth-murphy-445774115/
Tony
Good thought. Interested to see if they have some extra info.
You have to wonder how many forecasts have factored in the absolute plummeting of franc spreads from 465 earlier this year to 280 last week. It would appear as though a bottom has yet to be found with such a profound deceleration when combined with the continued rig count drop how can forecasters expect continued growth, its a double edged sword to take so long for the reduced franc spread to impact production to the downside will create the same lag on the way up in due course….
Jack, watching forecasts change in response to the dropping spread count seems a bit like watching paint dry. But, many forecasts have been dropping, very slowly. I am still with my guess that we will see lower 48 onshore decline beginning with Nov 19 monthly data. Although, the effects of new Permian takeaway, may delay that till Dec.
The primary vision frac spread graph (which Tony has imported above) starts out in 2014, and is mostly in the mid 400’s for the year. Horizontal rigs were 1200-1400 in 2014 with directional and vertical totaling around 550 to 600. In 2019 we started the year around 950 horizontal rigs and ended it around 700, there were only around 100 directional and vertical rigs almost all the new production will be from horizontal wells.
The intensity of the fracs from 2014 to 2019 increased a lot. As we know the amounts of sand and water per foot fracked were up along with the resulting volumes of oil and gas produced from the later wells. This shows up as more spreads are needed to service a given number of rigs. With spreads continuing to drop, the effect will be larger than expected, when it hits.
dclonghorn,
For horizontal oil rigs the start if 2019 was about 775 rigs and the year ended around 600 rigs a drop of about 22%. If we assume a 5 month lag from rig count changes to production changes, then October 2019 output would correspond with the May 2019 rig count, which was 708 horizontal oil rigs, a drop of 8% from Jan 2019. Note also that the completion rate was fairly flat over the June to October period with rising tight oil output. From May 2019 to Dec 2019 the horizontal oil rig count dropped another 16%. The December rig count may be reflected in May 2020 tight oil output, though note that when the horizontal rig count was previously this low in early 2017, output was rising at a pretty good clip, legacy decline is higher today so we may see no increase in tight oil output in the April to June period as the completion rate may fall to a level where output growth ceases.
If this proves to be the case, oil prices are likely to rise and in 6 months or so rig counts, frac spreads, and completion rates will rise leading to resumed growth in tight oil output.
Iran consumption 1.8 mbpd. Population is 81 million.
A bit surprising, but best to recall that a great deal of production is from the offshore liquids of the shared gas field with Qatar. The consumption may not all be refineries. Lots from petrochemical plants.
Sinopec is expanding their largest refinery to somewhere between 500K and 1 mbpd. Another minor refinery does 120K bpd. One does wonder about the output from the petrochemical plants. Might not be sanctioned.
One could say the consumption outstrips refining capacity so they must be importing product, but as just noted, a chunk of that consumption is not refinery output, regardless of where the refinery is.
Might need clarification. The light oil or condensate from the offshore field may never go to a refinery. It can be direct feedstock to their big petrochemical plants.
This would mean 1.8 mbpd may not all go to a refinery. Their consumption could be substantially those plants, generating plastics and not fueling transport.
And the Sinopec activity is to expand a refinery in Iran.
It’s interesting in that article they state analysts think growth could slow down to as little as 650kpd then in the next paragraph the analyst states new Permian wells will be insufficient to replace legacy decline – jointing one and two together what am I missing if the Permian is going backwards where are they going to get 650kpd from without mentioning the legacy decline in other LTO fields …. MSM is going to have a field day when production growth goes negative in the weeks/months ahead ….
Jack
Are you sure they didn’t say it will be difficult to overcome legacy decline?
Just because something is difficult doesn’t mean it cannot be done.
Agreed but where are the barrels to come from with both rigs and fracs down, it is clear the reduction in completion activity has taken everyone by surprise especially primary vision who produce the frac count they were of the opinion fracs would bottom put in the high 300s in September now we are at 280 and show no signs of bottoming out. This lack in completion activity will come home to roost in the weeks and months ahead I trust no one was forecasting such steep and prolonged reduction in activity.
Jack,
If we focus on the Permian basin (where close to 70% of the US tight oil growth in output has occurred) the 5 week centered average of the horizontal oil rig count is in the chart below. I used pivot table from page below (Baker Hughes data)
https://rigcount.bakerhughes.com/na-rig-count
From the chart above we might expect to see output drop after April or May 2019. In Permian output chart below (in kb/d) I have marked the May 2019 output (3617 kb/d). Do you see the big drop in output starting in May 2019? Me neither. 🙂
There was a sharp drop in the completion rate in November 2019 according to the DUC spreadsheet, so either that estimate or the output estimate may be in error (probably both are incorrect). I expect the completions will be revised higher and output will be revised lower in the future.
Article from Sept 2019
https://www.rigzone.com/news/frac_spread_drop_could_end_soon-25-sep-2019-159898-article/
Johnson attributes the downward movement in frac spread counts in recent months to operators’ ability to do more with less.
“It seems that more wells were completed with less spreads,” he said. “When the dust settles, it will be interesting to understand how utilization changed year over year.”
More recent rigzone piece.
https://www.rigzone.com/news/shale_frac_spread_rebound_hopes_fade-05-dec-2019-160503-article/
From the article linked above:
“We’ve tracked an uptick seasonally for four out of the previous five years and it did not materialize in October from a frac spread standpoint as we saw an additional approximately 25 spreads fall off nationally since we last spoke,” said Johnson. “After all is said and done we do think that a lot of wells were completed and maybe more efficiently than ever. The million-dollar question will be, how will this affect production?”
For all of the US notice the sharp drop in horizontal gas drilling rigs in the chart below, potentially there was a sharp drop in frac spreads in the gas sector. In the beginning of 2019 the ratio of oil to gas rigs was 4.8 to 1, by the end of 2019 (mid december) this ratio had risen to 5.5 to 1.
Dennis , your graph looks nice but I believe it does not have implemebted the reality in US Shale patch.
Take some minutes and read this report describing the situation after Q3 2019 results was puplic. https://www.google.com/amp/s/www.nasdaq.com/articles/has-u.s.-shale-seen-its-profits-peak-2019-11-22%3famp
38 oil and gaz Companies in US shale had a negative cash flow off 1.26 billion USD . In 2019 the shale companies should pay 9 billions USD in depth/ballons and for the period 2020- 2022 137 billions. The oil price is much the same , some reported frack hits, oil mix more gazy than exspected as we know this will increase. More frack hits as areas are more exploited. Thoose Companies in the Q3 reports might had a advantage , they could use DUCs , this is soon history as DUCs are reduced about 100 monthly. How many dead DUCs there is nobody knows. I am pretty sure as always the bank want their money instead off bew wells they lost money on in this 55-65 USD WTI world.
Freddy,
It is possible growth in tight oil will stop. If that occurs oil prices will rise. Some poorly performing companies will go bankrupt and some of the debt will not be paid. Stronger companies pick up the worthwhile assets at a discount and will develop resources with a minimum of future debt. Permian basin average well is profitable at $60/bo at wellhead. There is money to be made at higher oil prices. The smart companies will cut back on their completion rate and wait for higher oil prices. If enough companies are smart (cut back on the completion rate so oil supply falls) then oil prices will rise and the health of the industry will improve.
My point is simply that the fall in frac spreads may be due in part to a fall in gas focused frac spreads.
Also majors and better performing oil companies may expand as poorly performing companies contract, overall we might only see a small decrease in the completion rate, it is impossible to predict.
Jack,
What has been surprising is the increased efficiency of the frac spreads. It may be that as less efficient equipment is idled that more completions can be accomplished per frac spread in operation. As I have pointed out we do not have information on the split in the frac spreads, like we do with drilling rigs, so we cannot really make good predictions based on this information.
How possibly would frac spreads become more efficient on a per unit basis simply because less are operational that makes no sense.
As the absolute number has decreased dramatically in the past 6 months I cannot see how frac spreads have become 50% more efficient in the past 6 months.
Can anyone quantify the effluent year gains that everyone is noting, it would appear as though the lag between frac spreads falling and production being impacted is simply longer than observers expected.
When the worm turns the narrative will change very quickly I trust the next few months data will confirm if the purported efficiency gains have indeed materialised or if legacy decline has overtaken new production.
Jack,
I am focused on tight oil.
Do you know how may frac spreads are used for tight oil wells rather than shale gas wells? I do not have that information.
On efficiency, the least efficient frac spreads will no longer be utilized when demand decreases, so average fleet efficiency goes up.
So the efficiency plus a large decrease in shale gas completions may account for the fact that completions did not decrease significantly for tight oil until November.
I do not believe that information is freely available Dennis i do not see frac spreads dropped being gas based rather than oil based. Perhaps someone more knowledgeable than me can confirm how fracking a oil vs gas well varies i.e. do they on average take the same time to complete.
The key point i think we all agree is a significant lag exists between drilling and fracking a well, the widely thrown about level of 3-4 months could be masked by new pipeline coming on line in september/october – you would expect the data in the weeks ahead will really give an indication as to where oil production is headed – with the rig count and franc spread dropping it is not too much to believe that oil production is likely to decrease in the short term particularly if completion stats do not pick up – will the small bump in oil price bring any more rigs or frac spreads back on line is the $64,000 question.
Jack,
About 30% of the drop in completions were from shale gas, if we assume frac spreads operate just as quickly in the shale gas sector as the oil sector, this implies about 30% of the drop in frac spreads would be in the shale gas sector.
Note that in some cases the shale gas wells are considerably longer laterals with perhaps more frac stages, so potentially a shale gas well frac job may take longer and the completions per frac spread might be lower than for tight oil, we really do not know.
The completion rate must drop in order for output to fall, if the completion rate remains constant, output will increase. If the completion rate for all US tight oil plays remains 1109 completions per month from November 2019 to Dec 2025 (constant completion rate) we get the following US tight oil scenario.
The completion rate will need to fall by about 8% for tight oil output to decrease over the long term.
If oil prices remain low this might occur.
Click on chart for larger view
The completion rate must drop in order for output to fall, if the completion rate remains constant, output will increase.
That assumes production per well remains the same or increases. In other words, sweet spots never peter out. As the rigs move further and further away from the sweet spots, there will be no falloff in production per well.
I really don’t think so.
Ron,
I assume productivity decreases in the model starting Jan 2020 in most of the shale plays (Permian, Bakken, and Eagle Ford) some of the other plays that were developed later I assume the productivity starts to decrease in Jan 2023.
For the average Permian basin well EUR is 378 kbo in Dec 2019 and the average new well EUR falls to 318 kbo by May 2030 due to moving some drilling to less prospective areas.
Model in spreadsheet at link below, row 4 has new wells added, row 6 reduces this number to account for lower productivity, for example if 500 wells were added that were 80% as productive as the Dec 2019 average well, then row 4 would have 500 and row 6 would have 400 as total output would be the same.
https://drive.google.com/file/d/1rFHsprpvN1J2V3-C2RNqSXAGBazSdG-i/view?usp=sharing
(Permian, Bakken, and Eagle Ford) some of the other plays that were developed later I assume the productivity starts to decrease in Jan 2023.
Dennis, productivity has already started to decrease in all these places. It has been decreasing for over a year in Eagle Ford, this past year in the Bakken and is starting about now in the Permian.
Permian basin well EUR is 378 kbo in Dec 2019 and the average new well EUR falls to 318 kbo by May 2030 due to moving some drilling to less prospective areas.
May of 2030? My calculations say March 23rd of 2030. 😉 Of course, I am being facetious. But such a precise prediction deserves facetiousness.
I cannot make heads or tails of your spreadsheet. Probably a good thing as I cannot make a facetious comment about something that I do not understand. 😉
Hi Ron,
The model makes assumptions, for the assumptions given (new well EUR starts to decrease for Permian basin in Jan 2020) and number of completions remain constant from Nov 2019 to May 2030, the result is given above. Row 4 is the number of completions, row 5 is the ratio of new well EUR of a well starting production in any month from Jan 2020 to May 2030 compared to a well starting production in Dec 2019.
The concept behind the spread sheet can be found in post below:
http://peakoilbarrel.com/oil-field-models-decline-rates-convolution/
Ignore the mathematics, focus on the pictures.
All you need to know is arithmetic. It is an accounting exercise.
No decline in new well EUR is apparent in Permian or Bakken. For Eagle Ford I assume new well EUR (or productivity) starts to decrease in Jan 2019. By May 2030 (end of scenario) the new well EUR for the Eagle Ford has fallen to 57% of the December 2018 average EUR. For the Bakken I assume new well EUR start to decrease in August 2019, by Sept 2029 (last Bakken well completed in that month in scenario) EUR is 55% of the July 2019 average new well EUR.
Of course we don’t know precisely when any of this will occur, these are the assumptions of the models which result in a TRR (where economics are ignored) for a given number of wells (about 60,000 wells for Bakken and Eagle Ford assumed for mean TRR of about 11 Gb for each play) URR for Bakken and Eagle Ford are 8.5 Gb and 9.9 Gb respectively. For Permian the URR is about 58 Gb. The USGS TRR estimates are about 100 Gb for all three of these plays vs my URR estimate (assuming maximum Brent price of $90/bo in 2018$) for the three plays is about 75 Gb, with another 12 Gb from other US lto plays (Anadarko, Niobrara, any other plays, and condensate from shale gas plays). There is no recent Niobrara or Anadarko USGS TRR estimate for tight oil so that part of the analysis is more speculative.
Lots of assumptions, but generally they are pretty conservative, the model fits the data well up to November 2019, the future will depend on oil prices, completion rate and the rate that new well EUR decreases in the future. Number of possible scenarios is infinite, this scenario is very specific, one of infinity. Chances it will be correct, approximately zero (1 divided by infinity).
Ron,
As a simplification, the model assumes the EUR decreases each month after Dec 2019 by some percentage, given the fixed completion rate in this scenario, there are 125 months in the scenario from Nov 2019 to May 2030, that is simply an arbitrary date where the scenario ends. So each month the EUR decreases by 0.14% for this scenario, when this happens over 125 consecutive months the EUR decreases to 86% of the original EUR after 125 months.
Obviously we don’t know, I am giving you the assumptions based on assuming a mean TRR with 255,000 total wells completed in the TRR case (where economics are ignored) over the Jan 2010 to Dec 2079 period. Note that for this scenario only 87500 total wells are completed in the Permian basin through May 2030. To reach 255,000 wells at 488 wells completed per month would take until 2058.
Hey Jack, I agree with you. While there may have been some gains in the efficiency of frac operations over the past few years, I understood that they generally had little downtime, and performed effectively over the last several years. I am not saying that techniques such as zipper fracs, or improvements in frac design haven’t improved their productivity, but they were pretty productive five years ago.
Drilling rigs now take a lot less time to drill an average well. Dennis seems to think that there has been a corresponding change in the time to frac a well. I don’t believe the improvements in frac efficiency are of the same magnitude. If someone has some info on this I would like to hear it, either way.
dclonghorn,
Actually I am simply saying that when there is a slowdown (as occurred when oil prices dropped in Oct 2018) if there were 500 frac spreads operating in November 2018 and the frac spreads operating dropped to 400 by July 2019, that the least efficient equipment and crews would be idled and the best equipment and frac spread personnel would remain active. The overall number of wells completed per frac spread operating would increase under such a scenario, this seems to be what the articles I linked were saying, that frac spreads companies were completing more wells with fewer frac spreads. I call this an increase in efficiency, you may have a different name.
Dennis I get where you are coming from can we agree that the remaining frac spreads become no more efficient – the net loss of frac spreads even if we assume less efficient ones will have an impact on total completions.
What I am reading is a lot of spreads are being retired and parts being used to keep existing spreads in action, the fast return of spreads on a rebound in oil might not be as quick as they have been lost.
I think we can all agree the next few months data will be very interesting to watch re production trends new monthly totals cannot be expected as rigs/frac spreads and completions fall simultaneously
Jack,
If we assume all frac spreads and frac crews are identical, then you would be correct.
My assumption is quite simple any business might be running several frac spreads at any given time. If I were running the business I would keep the best equipment and crews working when I reduced crews/equipment.
Did you the articles where they said they were completing just as many wells with fewer frac spreads? If you are claiming this will reach some limit at some point, I would agree. I do not know that we have reached that point, we will know when we have more data.
I do agree the data will be interesting to watch going forward and frankly it is surprising given rig counts and frac spread counts that tight oil output has continued to increase. I do not have a good explanation.
There is $12 trillion dollars of USD denominated debt that exist outside the US borders. As oil production falls so will the amount of US dollars circulating outside the US that must service this debt. Falling oil production leads to lower price because those outside the US don’t have and can’t get the dollars needed to service their debt. Global Oil production has fallen since Nov 2018. So outside the US there is already a serious dollar shortage.
Higher oil prices don’t solve this. They compound the problem. As more dollars are used to buy oil instead of servicing debts. I don’t believe there is any other country outside the US with more dollar denominated debt than there is in China. Huge wave of dollar denominated loan defaults are coming. And i’m going to give you a hint. The FED isn’t going to be buying these loans made outside the US.
HHH,
In a loan default there are two groups the borrowers and the lenders, one group loses the money owed the other is off the hook. Net change for all parties is zero.
This is part of the reason interest is paid, lending can be risky.
Yes, lending can be risky. But if a default of such a dimension happens, the whole system disintegrates. IMO the crisis of 2007 was in part initiated by high oil prices that redirected big amounts of money from serving debt. Then all that defaulted debt got papered over and fracking, coupled with near-zero interest rates, enabled a new oil boom. This time, in 2020, when oil prices go up because of a shortage, the same will happen – but in an even bigger dimension and without the possibility to paper it over to create a new fracking boom with cheap money. Things will be pretty screwed, especially if this time China gets sucked into that mess.
What is important in today shale buisiness is in 2020 lots off billions in ballons will be default. The day it seems clear that the Company not are able to pay or not are able to comply with covernants often related to equety to lender have set it is insolvent, means the bank or kreditor deside. The stock will fall as owners fear bancurupsy next. For the Company such situation very often means cut in spending, sale of assets and as seen resently the price for thoose assets have been very low related to what it was bought for.
Freddy,
All true. In the bankruptcy the assets are sold to highest bidder, the wells will be bought up by those that operate more efficiently and in the long run the industry will be healthier. This is the way capitalism works, businesses fail all the time.
This analysis does not take into account money creation. In order for the economy to function, M2 must increase. If investors decide that the best investment is to pay down debt rather than to borrow and put the money to work, you get a deflationary debt spiral in which liquidity leaves the system. This leads to recession because there is less money in the system to pay wages, etc. Remember that 85 to 90% of the money in circulation is created through credit. Debt defaults lead to a lack of confidence on the part of lenders and thus to less lending which can lead to a deflationary debt spiral.
Schinzy,
That is when fiscal stimulus is needed by governments. Pretty basic Keynesian theory.
Thank you HHH, interesting information.
I have thought for some time that over the last 5 years OPEC production has been in decline with relatively low oil prices so OPEC nations have had less revenue coming in. My suspicion is that they have dealt with the lack of revenue by increasing debt. Eventually lower revenue will lead to a decline in spending. What do OPEC nations spend money on? Well they buy lots of military hardware. So military hardware makers may see lower sales unless WWIII starts.
“Global Oil production has fallen since Nov 2018. So outside the US there is already a serious dollar shortage.”
Not sure if this is true. Dollar is declining, perhaps b/o QE by another name adds liquidity?
Jeff,
The trade weighted dollar index has risen a bit from 2018 to 2019 from about 120 to 130, an increase of about 8%. I would not characterize this as a “serious shortage”.
see
https://fred.stlouisfed.org/series/TWEXB
Ovi,
You say:
This chart shows the number of wells completed each month. Note that the number of completions from March 2019 to August 2019 slowed relative to the previous few months.
Over that period, tight oil completions were rising at an annual rate of 105 completions per year. Chart below has tight oil completion rate (Permian, Bakken, Eagle Ford, Niobrara, and Anadarko basins) the overall completion rate was fairly flat from Jan 2019 to Nov 2019, if we look at it on a zero scaled chart.
In November, completions were down by about 9% from the average level in 2019 and about the same level as February 2019.
Dennis, your chart shows more than you may realize. Completions were at their highest during 2019 yet production slowed dramatically that year. That means production per new well must have been dropping by a similar amount.
It may be that sweet spots are petering out. That plus a drop in completions should reflect a production drop beginning in November…
The decrease in completations might also have to do with development of DUCs where the most profittable based on core samples is starting to dry up…
Yes, that is a definite possibility. If you think about it, you will realize that samples taken after the well is completed, will give a pretty good idea of just how productive the well will be after fracked. Therefore the DUCs most likely to be good producers will be fracked first. Therefore the DUCs left are the ones least likely to be good producers.
It is never very clear how the ducs actually turn over, also the well is completed after it is fracted, they can only guess at future output based on nearby wells until the well starts producing, production starts after the well is completed, or that is my understanding.
I would agree that the better prospective DUCs are completed first, generally they do not bother to drill a well unless they expect it to be worthwhile. So the “dead duc” theory may or may not be correct.
For Permian basin ducs started to decrease in August 2019 and have decreased by 130 over the past 4 months (32.5 per month). Recently the DUC to completion ratio was about 7 and from June 2016 to June 2018 the ratio was about 5. If we assume 5 is the optimal ratio and the completion rate remains at about 500 per month then the DUCs should fall to about 2500, so a reduction of 1059 from the Nov 2019 level, if the monthly fall in DUCs remains at 32 per month, it would take 32 months to reach the 2500 DUC level at a completion rate of 500 per month. Of course drilling or completion rates will likely change in the future.
Chart below has Permian DUC to completion rate ratio
they can only guess at future output based on nearby wells until the well starts producing,…
I am sorry Dennis but that is simply not the case. They always sample the rock that comes out of the hole. Or at least that is the way they always did it with conventional wells. Would they simply stop sampling the rock on shale wells? I seriously doubt it.
They know the porosity of the rock and how much oil it is likely to contain by the samples they pull up. If the sample looks like shit that DUC will likely remain a DUC until there are no DUCs left. And if the sample indicates a dry hole, that DUC will never be completed.
Ron,
Perhaps it is the same for unconventional wells as conventional, but I think it is more complex than simply taking core samples. Pretty sure they know very little about how the well will perform until the well is fracced and starts producing, but I will defer to those with real world production experience with tight oil wells.
My understanding is that there are very few dry holes, just wells that produce less and wells that produce more, perhaps there are many wells that have been drilled in poor productivity areas.
It is far from clear if this has changed much over time from say 2013 to 2020, there is likely some percentage of wells that will be failures, perhaps 5-10% that will not be worth completing at current price levels.
Bottom line is that only the operator has this information, everything else is speculation.
Ron,
No there is little evidence that the average new well EUR has decreased, but the high completion rate from 2018 to 2019 leads to increasing legacy decline, that is why production growth has slowed.
Chart below has tight oil completion rate from Jan 2018 to Nov 2019.
Are you sure all of the slower increase was due to the increased legacy decline? Are you sure none of the slower increase was not due to lower new well production?
Just checking.
Ron,
impossible to be sure of anything. If one looks at the well profile data at https://shaleprofile.com it is far from clear that average new well productivity has decreased.
See “Well quality” tab at page linked below.
https://shaleprofile.com/2019/12/03/us-update-through-august-2019/
Chart below has average annual US tight oil well profile from 2013 to 2019. No sign of decrease in average productivity through 2019.
Enno Peters uses actual data from state agencies, these are not models, it is data.
Dennis,
Would it not be safe to assume the average horizontal length in 2019 is a larger number then previous years, perhaps also average barrels water and sand volume is also larger and it still looks like its plateauing to me.
Baggen,
Probably true from 2013 to 2018, though I do not have the data to confirm this, yes more sand and water as well.
I agree it looks like 2019 is about the same as 2018 so new well EUR may have plateaued.
For Permian Basin there has been an increase in lateral length from 2016 to 2019 which has lead to an increase in average new well EUR, according to Enno Peters when normalized for lateral length output per lateral foot has been relatively constant, not sure about other plays.
My thinking on this is that we will reach some optimum average lateral length at some point (perhaps we are already there) and when that point is reached lateral lengths, proppant load, etc will change very little going forward (after the optimum well setup is determined).
I have access to EIA data and the shaleprofile blog data that is publicly available, I do not have the money to spend on proprietary data, I do the best I can with the data available.
I have no access to data from the future, my time machine broke. So scenarios of the future should be taken for what they are, models based on assumptions about the future, all of which will be incorrect, which means of course the scenarios will be incorrect as well.
Dennis,
“My thinking on this is that we will reach some optimum average lateral length at some point (perhaps we are already there) and when that point is reached lateral lengths, proppant load, etc will change very little going forward (after the optimum well setup is determined).”
I think the same, and as you say perhaps we are already there or close to it where those metrics will start to be relative constant per well going forward on an average.
Then we just have geology that will be going in a given direction. Will be interesting in the coming year to see how it plays out.
Baggen,
I agree it will be interesting to watch.
One thing to consider is that the Bakken has had lateral lengths around 10,000 feet (3000 meters) since about 2008, there no doubt have been changes in number of frack stages, proppant loading, etc. The interesting thing is that average EUR has not decreased over a 12 year period. I have been thinking EUR would start decreasing in 1 year for the past 7 years in the Bakken.
So I hesitate to predict decreasing EUR too early as it might stay on plateau, even with fixed lateral length, for many years.
So I continue to guess, probably badly. 🙂
Scenarios below use a low, medium and high completion rate for Permian basin from Nov 2019 to May 2030 (end of scenario), other US tight oil basins have a flat completion rate in this scenario from Nov 2019 to May 2030 for all three scenarios.
I believe there is a high likelihood that future US tight oil output will fall between the low and high scenarios in the chart below, perhaps a 3 in 4 chance, with a 1 in 4 chance that output will fall outside this range. The medium scenario is similar to my best guess and I expect there is an equal chance that actual output will be higher or lower than that scenario. The probabilities are subjective and are also likely to be incorrect guesses.
Dennis
Thanks for pointing this out. If you look at my original chart it shows the huge jump in the rate of completions from December 2018 to March 2019. What I intended to say, and not very clearly, was that the rate of change of the completion rate from March 2019 to August 2019 had slowed relative to the previous few months. Essentially I was looking at the second derivative but did not state it correctly.
Ovi,
Sorry I misunderstood, clear now. Perhaps “rate of increase” might be clearer?
>>
There is $12 trillion dollars of USD denominated debt that exist outside the US borders. As oil production falls so will the amount of US dollars circulating outside the US that must service this debt.
. . .
I don’t believe there is any other country outside the US with more dollar denominated debt than there is in China.
>>
Not sure why denomination is presumed important given FX, but moving right along . . . last I looked total foreign Treasury holdings are about 8T. And . . . sorry, it’s Japan, not China.
Why are you concerned about servicing this? China pegs their yuan. They can collect interest (until it goes negative, then pay) in yuan by creating some and paying it at the peg rate. When you’re pegged, why do you care? And why do they need USD cash anyway? This T paper is rolled over on maturity. No cash has to change hands.
As for Japan, hell, they could pay KSA for oil with the US Treasuries in inventory. Once more, no cash reqd.
This is clearly not being well understood. Ben Bernanke just gave a speech this weekend that the new tools available to central banks like the Fed to combat slow or negative growth will include those “pioneered” elsewhere in the world, namely negative rates. If people pay you to borrow, what’s the problem?
Oil Drillers Keep Removing Rigs From Permian & Cana Woodford
Total US Rig Count Decreases: Rigs engaged in the exploration and production of oil and natural gas in the United States totaled 796 in the week through Jan 3, lower than the prior-week’s count of 805. The current national rig count is also below the prior year’s 1075.
The number of onshore rigs, in the week ending Jan 3, totaled 773 compared with the previous week’s 781. Moreover, the tally of rigs operating offshore plays through the week till Jan 3 was 22, lower than the prior-week count of 23. However, in inland waters, the count was one, in line with the week-ago tally.
US Removes 7 Oil Rigs: Oil rig count was 670 versus 677 in the week ended Dec 27. Thus, drillers in the domestic plays removed rigs for two weeks in a row. The current total, far from the peak of 1,609 attained in October 2014, is also below the year-ago 877.
Natural Gas Rig Count Declines in US: Natural gas rig count of 123 was lower than the prior-week tally of 125. Moreover, the count of rigs exploring the commodity lagged the prior-year week’s 198. Per the latest report, the number of natural gas-directed rigs was 92.3%, below the all-time high of 1,606 recorded in 2008.
Rig Count by Type: The number of vertical drilling rigs totaled 44 units versus the prior-week 49. Moreover, the horizontal/directional rig count (encompassing new drilling technology with the ability to drill and extract gas from dense rock formations, also known as shale formations) was 752 compared with the prior-week level of 756.
Gulf of Mexico (GoM) Rig Count Declines: GoM rig count was 22 units, of which 21 were oil-directed. The count was lower than the prior-week tally of 23.
Rig Count in Major Basins
From Permian and Cana Woodford, drillers removed two and one oil rigs, respectively, in the week through Jan 3. Notably, oil drillers in the most prolific basin removed rigs in nine of the past 11 weeks. In Cana Woodford, the count of rigs fell for three straight weeks.
For Permian basin horizontal oil rig count see chart at comment linked below.
It is the 5 week centered moving average of the Permian basin horizontal oil rig count from Baker Hughes.
http://peakoilbarrel.com/u-s-oil-production-is-competing-against-decline/#comment-694934
https://oilprice.com/Energy/Energy-General/US-Shale-Struggles-To-Ride-Out-The-Storm.html
According to this survey from oilprice.com there are few positive signals in todays shale patch. In Colorado much of the assets have Zero value because off new Goverment policy. Seems some CEO are starting to concern off enviroment issues, flaring off gaz is wastedvresourses i.e. Seems the most important indicators for 2020 shale buisiness still is negative that means less activity and new production.
Freddy
I am not quite sure how this comment:–
“Increasing regulatory pressure in Colorado has resulted in a complete loss in value of wells in that state, and in my mind, it has become a ‘no investment’ state.”
— squares with the increase in output in Colorado shown in the original post and this comment:
“Six months after shouting that new legislative drilling regulations were an existential threat to their industry in Colorado, the state’s oil and gas producers are now whispering a different message to Wall Street:
“We do not foresee significant changes to our development plans, as we have all necessary approvals of more than 550 permits to drill wells over the next several years,” Noble Energy representatives wrote to investors.”
Ovi , I believe they exsperiance increased cost related to enviroment regulations and there might also be rules related how close to houses where pepole live they can frack. Normaly it take some time before impact off such new regulation impacted the oil producers but I believe the CEO that lives in this shale Buisiness have made their estimates off impact. If they than already have sign leasing agreement for land for 99 years without been able to drill as planned that will impact vreak even price.
Freddy
We will keep tracking Colorado and in 3 or 4 months we will see which way production goes. That will provide a clue on the impact of the new regulations. Sometimes regulations sound good to the general public but the industry affected knows subtle work arounds that minimizes the impact.
Ovi,
The horizontal oil rig count may give some indication of the future. Typically a 4 to 6 month lag between changes in rig count and changes in output. Niobrara horizontal oil rig count 5 week centered moving average in chart below data from Baker Hughes pivot table.
https://rigcount.bakerhughes.com/na-rig-count
Ovi,
They might be talking about future growth, if completion rate decreases due to increased regulation, output growth may slow down or even cease depending upon how quickly the regulations are implemented. There are a number of areas in the Niobrara where the wells are fairly close to suburban neighborhoods (or that is what Boomer has explained). The regulations are likely affecting those areas most, so companies with planned wells in those areas will be affected, in more rural areas there may be less of an effect.
New significant oil discovery offshore Suriname..
https://www.rigzone.com/news/apache_and_total_hit_oil_pay_offshore_suriname-07-jan-2020-160735-article/
Good they find more oil that is profittable at 50 USD or below, but guess it will take at least 3-5 year or more to get it online abd to the market..
“In 2012, Suriname was ranked joint 22nd with Japan in the worldwide Press Freedom Index by the organization Reporters Without Borders.[77] This was ahead of the US (47th), the UK (28th), and France (38th).”
From the 2019 report:
– Surinam 20th
– France 32nd
– UK 33rd
– USA 48th
– Japan 67th
https://rsf.org/en/ranking_table
Japan sure has fallen—–
Saudi Arabia nr. 172 …
WTI up by $2.25 in after market trading because of Iranian missile attacks on US bases in Iraq. I this the start of a war?
Iran attacks two Iraqi bases housing US forces in revenge for Soleimani’s death
Just transitioning from low intensity conflict to higher. Still shaking it out. Assassinating generals is a feature of high intensity conflict. Do it all the time. Trump just kinda amped up a years long low intensity conflict out of the blue with no warning by assassinating the local heroes of the War Against ISIS. F35a’s took off from UAE; Iran stated second round of ballistic missiles launched.
So it may turn into a game of ping pong: (1) US kills general, (2) Iran fires missiles into US bases, (3) US bombs Iranian military sites, (4) Iran retaliates, etc.
But what if each strike is more powerful than the previous one? One side will have to call it quits at at some point or it’ll turn into a real war.
IMHO low intensity conflict is a real war. It just doesn’t make the news much. “War” with Iran started a long time ago. It’s real. People been dying for quite some time. It’s just gonna prob be high intensity now, so yeah more of USA forces vs Iran forces, and not just their proxies.
PMF have now announced they are launching ‘Operation Crashing Comeback’ against the US troops presence in Iraq.
This is a measured face saving response with the hope that no US personnel are injured and that T does not respond. This is a calming response.
Interesting update from Shale Profile for US production.
Month: August-2019 from August 2019 update
Output. 2,922,210 (of 7,129,942)
Wells: 7,258 (of 111,851)
Month: August-2019 from September update
Output 3,078,976 (of 7,328,823)
Wells: 7,719 (of 114,543)
Output increase 199 kb/d from 461 wells
Month. September-2019 from September update
Output. 3,296,426 (of 7,339,569)
Wells: 8,527 (of 115,351)
Output increase of 11 kb/d from 809 wells
I know that data will be further updated in a few months but I think there is a hint of US plateauing. 809 new wells and 11 kb/d doesn’t sound encouraging.
I was going to post this exact same thing. I believe something like 95‰ of production increase MoM was just to offset decline. Perhaps future revision will make the numbers more favorable than that.
I am wondering at what flow rate are the new 809 wells reported. Is it initial production rate, peak production rate or a mix?
Maybe Dennis knows.
Ovi, it has to be the average flow rate for the entire month.
Ron
Makes sense.
Ovi,
I can only guess. I am pretty sure that all monthly output is reported for the calendar month. The problem is that the first month is variable from well to well due to different start dates as well as differing well productivity.
On average for the first month the average month will have 14 to 16 days of output (some wells start the 1st of the month and others might start producing on the 31st). Typically month two will be the highest month of output because the average well might have 28 to 30 days of output (I am assuming there are always a few wells that have problems and miss a few days of output on average each month).
Note that the total output is just the output reported by operators and the wells producing is also just the number reported by the producers.
The well profile data is put together based on this, an is a complex data task far beyond my capabilities. Enno Peters does an amazing job taking the data from 114,543 wells ( start dates, basins, flow rates, etc) and putting it into a very useful format.
We are very lucky he provides the information for free, this may not always be the case.
The 11 kb/d increase will become 200 kb/d from 1250 wells after revisions.
Ovi,
For an apples to apples comparison, for August we need to look at the change from July in the Sept report.
For July to Aug 2019 from Sept 2019 report:
delta output=115 kb/d
delta new wells=1073 wells
The expected increase after revisions according to Mr. Peters is 7500 kb/d of a delta output of 286 kb/d from the currently reported August number, but I expect the July estimate will also be revised up over time by 86 kb/d so the final difference might be 200 kb/d. The delta new wells will eventually be revised upward as well, possibly to 1250 new wells, also keep in mind that many of the wells reported are natural gas wells in shale gas plays.
For July to August 2019 deltas (from September report) with only Bakken, Niobrara, Eagle Ford, and Niobrara selected under basins (so we focus on tight oil):
delta output is 112 kb/d
delta new wells is 867 wells.
In other words the 206 wells completed that were not in the 4 major tight oil basins led to a 3 kb/d increase in output.
In my view we get a clearer picture of tight oil output when we focus on the tight oil basins.
Dennis
It is pretty complicated. Looking at previous results and the current numbers, I looked at the average shape. Those 800 wells will go from average IP to max in one month. All previous months drop down from peak. So I will guess that there will be a net gain of 210 kb/d/well from looking at the chart. Roughly 380 to 590 where the black dot is. That would give an increase of 809 x 210 = 170 kb/d. A little short of your 200 kb/d estimate.
Ovi,
Note that the estimated number of wells is likely to increase in future estimates.
My estimate would be 692 b/d times 1250 wells (after revisions)=865 kb/d from new wells, this would then be offset by legacy decline of 665 kb/d to get the 200 kb/d overall increase. Note that I do not know what the legacy decline is, nor do I know the number of new wells after revisions, Enno Peters does say very clearly in this month’s post that he expects US tight oil output will be about 7.5 Mb/d after revisions, note that Enno Peters does not include tight oil output from vertical wells and also does not include Oklahoma output. Without Oklahoma his estimate matches the EIA “tight oil estimates by play” for September quite closely.
For Sept 2019 the increase in output from October for the EIA (excluding Oklahoma) was 70 kb/d, if legacy decline was about 560 kb/d, this implies a future revision to about 908 wells completed in September.
This assumes that both the EIA tight oil estimate and shaleprofile well profile data are accurate, it is possible either or both will be revised in the future.
The well profile is the output from an average well in month 1, 2, … of the wells life from first month of production. So the peak of that purple line is the number to use for new well output. Then one has to figure legacy decline from all wells already producing.
Dennis
Where did the 692 and 1250 wells come from.
Ovi,
In my previous comment where I said October, I meant August.
Last month the number of wells for August was about 400 wells lower than the current report so I assumed the 808 wells might be revised in the next report to 1208 (I misremembered the 808 as 850 so the 1250 is a mistake). The 692 is the maximum output for wells that started producing in August 2019 (using shalprofile data). In the second part of my comment I revised the 1250 to 908, so 692*908=628 kb/d from new wells, EIA estimate is an increase of 70 kb/d in Sept (excluding Oklahoma, because shaleprofile does not cover Oklahoma in the blog). The implied legacy decline would be 558 kb/d (628-70). Also if you look at the chart in your comment the peak of the purple line would be new well output which looks like about 690 b/d on your chart.
An alternative is two consider the most recent two months for new well output, in that case we would use 908*374+(679-374)*1073=667 kb/d increased output from new wells for the past two months (because on average month 2 will be higher than month 1, so we add the increased output (674-374) of last month’s wells to the new wells from the current month. Again EIA tight oil estimates by play (excluding Oklahoma) ha an increase of 70 kb/d in Sept, implied legacy decline is 667-70=597 kb/d for US tight oil excluding Oklahoma in Sept 2019.
Note if one uses the 2019Q3 well profile it would be (692 and 382, instead of the annual estimate of (674 and 374). For the Q3 estimate we get new well output of 679 kb/d and legacy decline of 609 kb/d.
see chart below
Here is chart for 2019Q3 from
https://shaleprofile.com
Now as the gulf crisis is over and sun shine everywhere…
Too late for the latecomers to hedge, now oil prices are falling rapid back into the shale hurting range. Let’s see if the downtrend in rigs and spreads continues.
Eulenspiegel,
For Permian, Eagle Ford, Williston, and Niobrara basins, horizontal Oil rig count was about 317 at the start of 2017, increased to 495 at the beginning of 2018 rose to 595 at the beginning of 2019 and fell to 507 at the beginning of 2020. It is not clear what will happen going forward, but for the past 10 weeks the horizontal oil rig count in the major basins has held fairly steady at an average of 502 rigs with fluctuations up and down between 495 and 513. Future rig counts are of course unknown, my guess is they will increase, decrease, or remain the same. I could be wrong. 🙂
On the frac spread count, without breakdown by basin or at least the tight oil/shale gas split, the information tells us very little. I guess we will know in a few months, how many wells can be completed with fewer frac spreads.
Lots 2 Ponder over with the Bizzar events of last few days..
RT – The Real Reason for cooler heads- , US does not need MENA Oil – Oh Really? But Everyone else does? Oh BTW, Did Trump got a dose of reality by talking with MBS last eve? Everyone has more than one Pony in this Rodeo.
https://www.youtube.com/watch?v=F2nb22EiGus&t=210s
This POB Post is Pure Gold.
+ more to chew on. Huh? Google and Amazon now in the Oil Business? https://youtu.be/v3n8txX3144
Sometime in the somewhat distant past we had some visibility into where Bakken oil was being shipped. Don’t remember how. But we need to resurrect that information because of the recent developments in Canada.
They’re not going to need diluent. So where is that stuff going?
Watcher,
North Dakota and Montana have been sending Bakken oil to Washington State through pipeline for some time. Pipeline and rail have carried Bakken oil to refineries on the East Coast; they aren’t equipped to handle the heavy stuff the way Gulf Coast refineries are.
US – update through September 2019
Even preliminary production data has September oil production in all these states at a new record, at over 7.3 million bo/d. After upcoming revisions, I expect it to eventually settle at around 7.5 million bo/d. These figures are somewhat higher than the previous US update, as we are now able to include more production data for recently completed wells in New Mexico, and Ohio is also up-to-date.
Shale only:
Aug. 7,328,923
Sep. 7,339,569
Dif……..10,646
Ron,
The data gets revised as it becomes more complete. Mr Peters clearly says he expects Sept output to rise to 7500 kb/d after revisions, August will eventually rise to about 7430 kb/d, the increase will be about 70 kb/d.
New posts up.
http://peakoilbarrel.com/eias-electric-power-monthly-december-2019-edition-with-data-for-october/
http://peakoilbarrel.com/open-thread-petroleum-january-10-2020/
US oil companies to release fourth quarter 2019 results in about a month. EOG Resources is the top shale oil production company in the US, according to shaleprofile.com, and had oil production of 614 kbd in Sep 2019. (oil includes crude, condensate and NGL)
According to EOG, their oil production for 2019Q3 was 604 kbd. EOG midpoint of guidance range indicates 605 kbd for 2019Q4. EOG next quarterly will give more accurate results but it does seem that EOG production may be peaking.
http://investors.eogresources.com/Investors