The Texas Rail Road Commission has just released their Oil & Gas Production Data through May. There are four categories of data, Crude, Condensate, Gas Well Gas and Casinghead Gas. Casinghead gas is what most folks call Associated Gas. That is gas that comes up with the oil in oil wells.
On all oil charts the July Report has data through May 2014 and is in barrels per day. Also the last month, May in this case, is always exaggerated on the low side. That is the data is incomplete back to about two years. But the last month is always far more incomplete than the previous months.
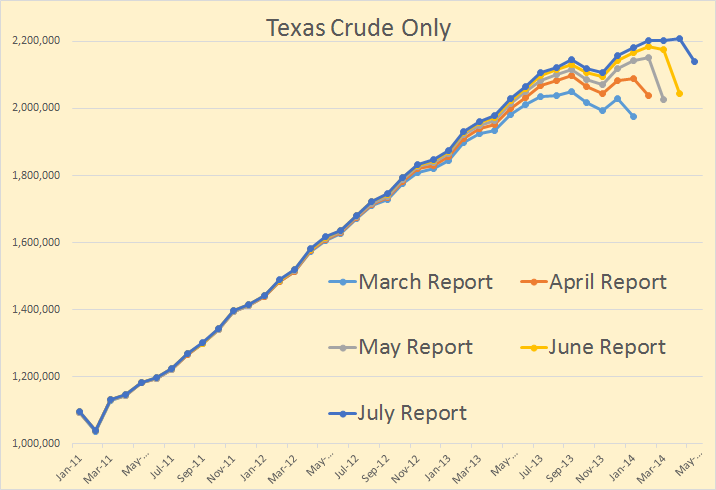
This data is of course incomplete but even from the incomplete data we can get an idea of the average monthly increase. I calculate that Texas Crude only is increasing at about 40,000 barrels per day per month.
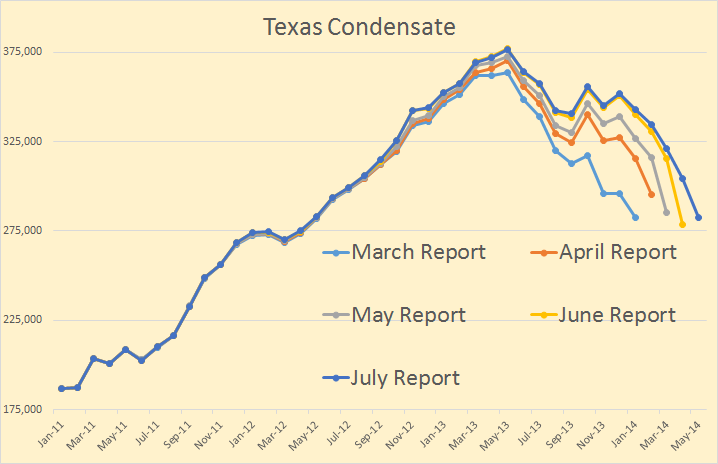
I think Texas Condensate peaked back in May of 2013 and is now declining at about 500 bp/d per month.
Read More
