An interesting analysis was recently published by BNP Paribas (one of the top 10 banks in the World by assets) entitled Wells, Wires, and Wheels… . In that analysis they argue that long term oil prices will fall to $20/b or less in order for oil used for personal land transport to compete with EVs powered by wind and solar at current cost levels.
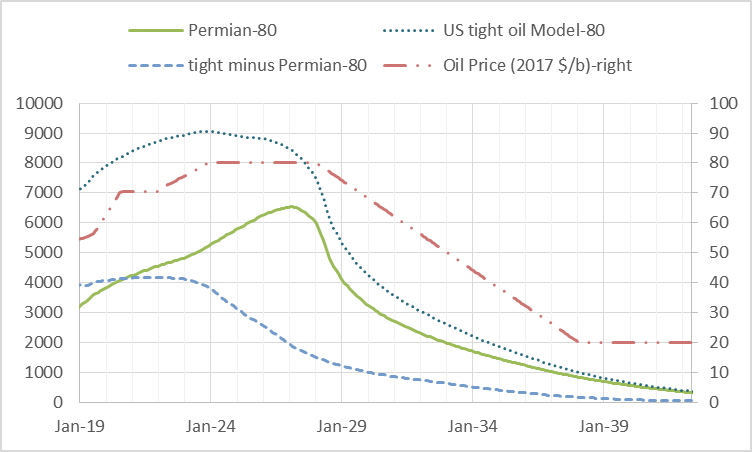
I reworked my oil price assumptions, first with a simple scenario that follows the EIA’s AEO 2018 reference oil price scenario up to $70/b in 2017$ and then remains at that level long term. Second I noticed that a scenario with such an oil price assumption sees tight oil output fall in 2022 so the scenario was revised with oil prices rising from 70 to 80 per barrel from 2022 to 2024 and then remaining at that level until 2028. The BNP Paribus analysis suggests that EVs will have cut significantly into oil demand by 2022 to 2025 so I assume oil prices fall to $20/b over the next 10 years.
Scenarios below.
Tag: Permian
US Light Tight Oil (LTO) Update
by Dennis Coyne
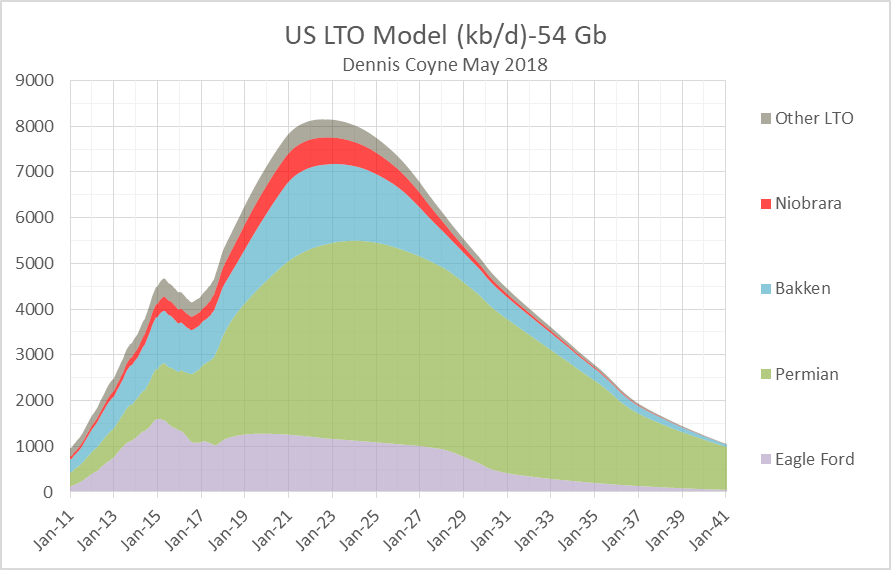
I have updated my scenarios for US LTO output, based on both EIA tight oil output data and average well profile data from Enno Peters’ shaleprofile.com. I have also created a scenario for the Niobrara shale oil play and for “other US LTO” which excludes the Permian Basin LTO, Eagle Ford, North Dakota Bakken/Three Forks, and the Niobrara.
US Crude plus Condensate and Tight Oil, Jan 2018 Update
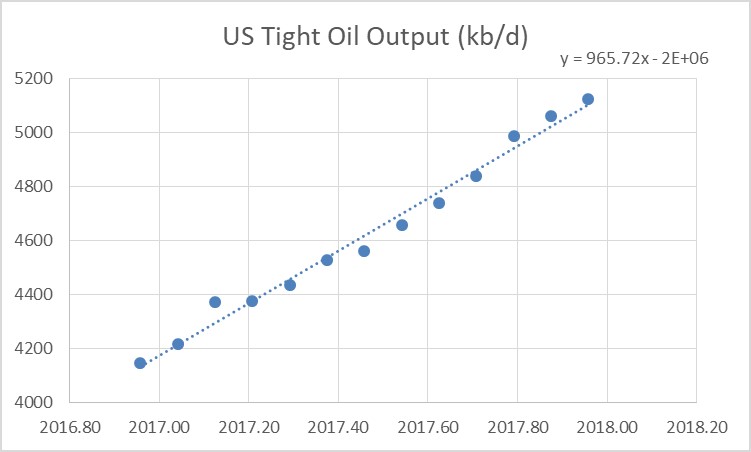
From Dec 2016 to Dec 2017 US Tight oil output has increased by 975 kb/d based on US tight oil output data from the EIA.
For the entire US we only have EIA monthly output estimates through Oct 2017. Over the Dec 2016 to Oct 2017 period US output has increased by 866 kb/d and the OLS trend has a slope of 821 kb/d.
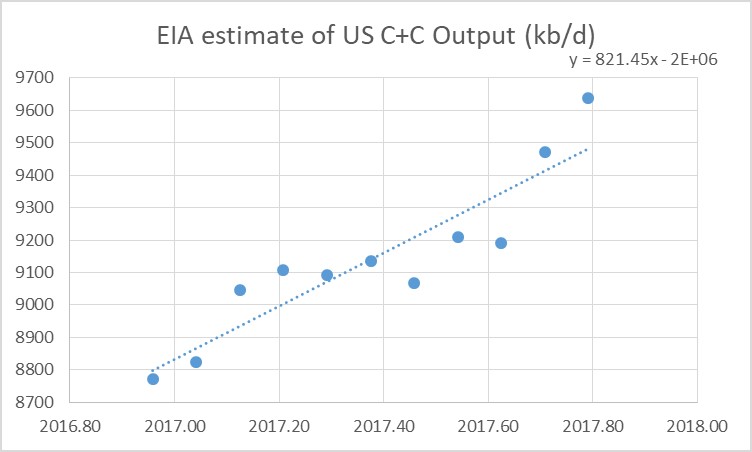
Note that the 866 kb/d increase in US output over 10 months would be a 1040 kb/d increase over a 12 month period.
Most of the increase in US output has been from increased LTO output. The forecasts by several agencies (EIA, IEA, and OPEC) of more than a 1000 kb/d increase in US output in 2018 may assume that the recently increased oil price level will lead to increased investment in the oil sector.
Much of the increase in LTO output has been in the Permian basin and several factors may slow down the recent rapid growth. Among these are limited fracking crews, inadequate pipeline capacity for natural gas, which will limit output as flaring limits are reached, and potential water shortages.
Longer term the various LTO plays will run out of space to drill more wells in the tier one areas (the so-called sweet-spots) and this will limit the rate of increase within 2 or 3 years. It is likely that the Eagle Ford is close to this point, the Bakken might reach that point by 2019, and the Permian basin perhaps by 2021.
For US C+C output, I expect about a 600+/-100 kb/d increase in 2018.
Oil Price Outlook December 2017
A Guest Post by David Archibald
The views expressed in this post are those of the author alone.
This assessment is based on the data in the 2017 BP Statistical Review of World Energy available here. As such it uses that review’s definition of oil which is crude and condensate and natural gas liquids, uncompensated for their different energy contents or values of refined product components.
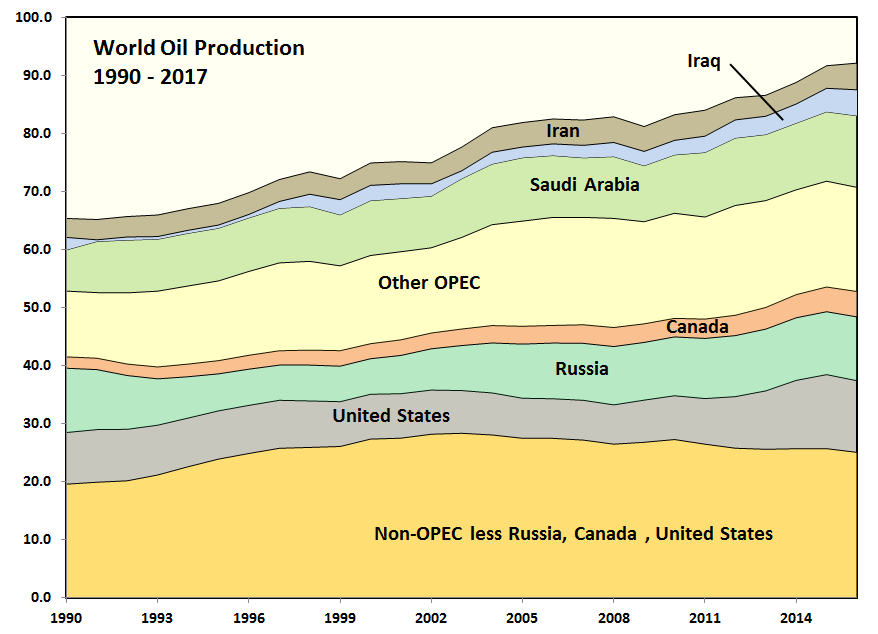
Figure 1: World Oil Production 1990 – 2017
This analysis was prompted by a chart by Ovi showing that Non-OPEC production less Russia, Canada and the United States has been in decline since 2004. That decline rate is 0.25 million barrels/day/annum. It had previously risen strongly from 1990. Read More
Texas Update- June 2017
Dean Fantazzini has provided me with updates to Texas Oil and Natural Gas estimates, the data shifted about a year ago so I use the most recent 13 months of Texas RRC data along with the “all vintage” data estimate which uses all data from Jan 2014 to April 2017 for oil and April 2014 to April 2017 for condensate. The most recent EIA estimate is shown for comparison. In April 2017 the EIA estimate is 3345 kb/d, the 13 month corrected estimate is 3443 kb/d, and the all vintage estimate is 3572 kb/d. Read More