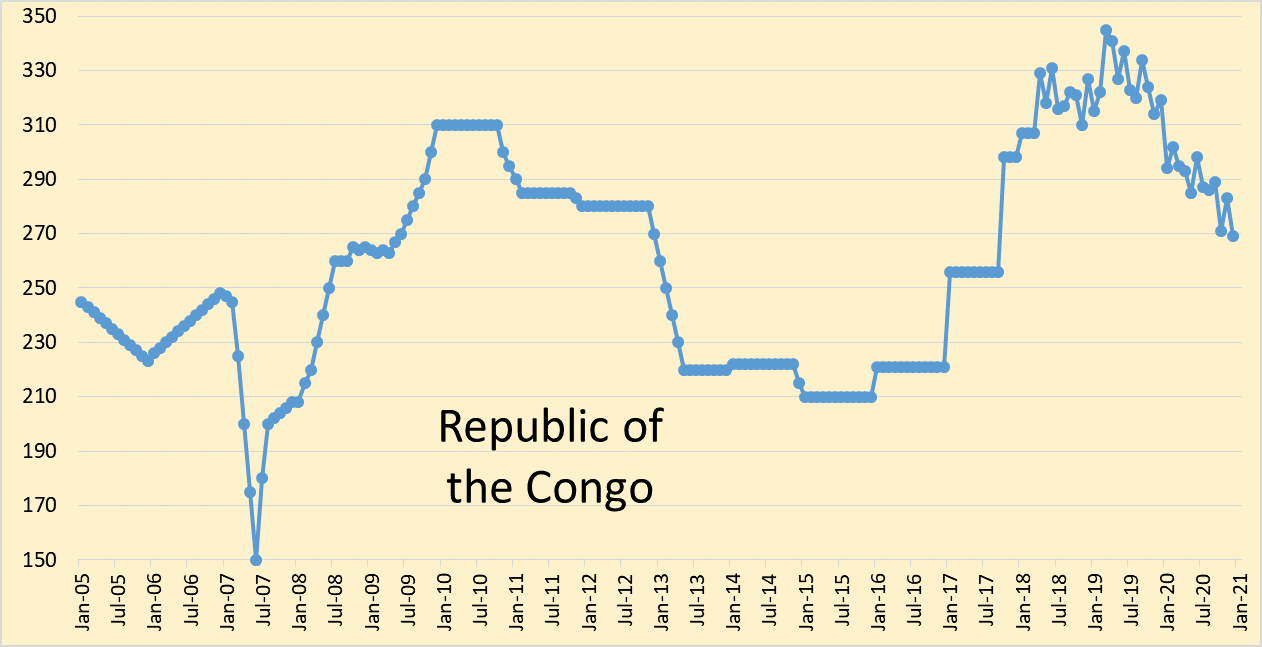
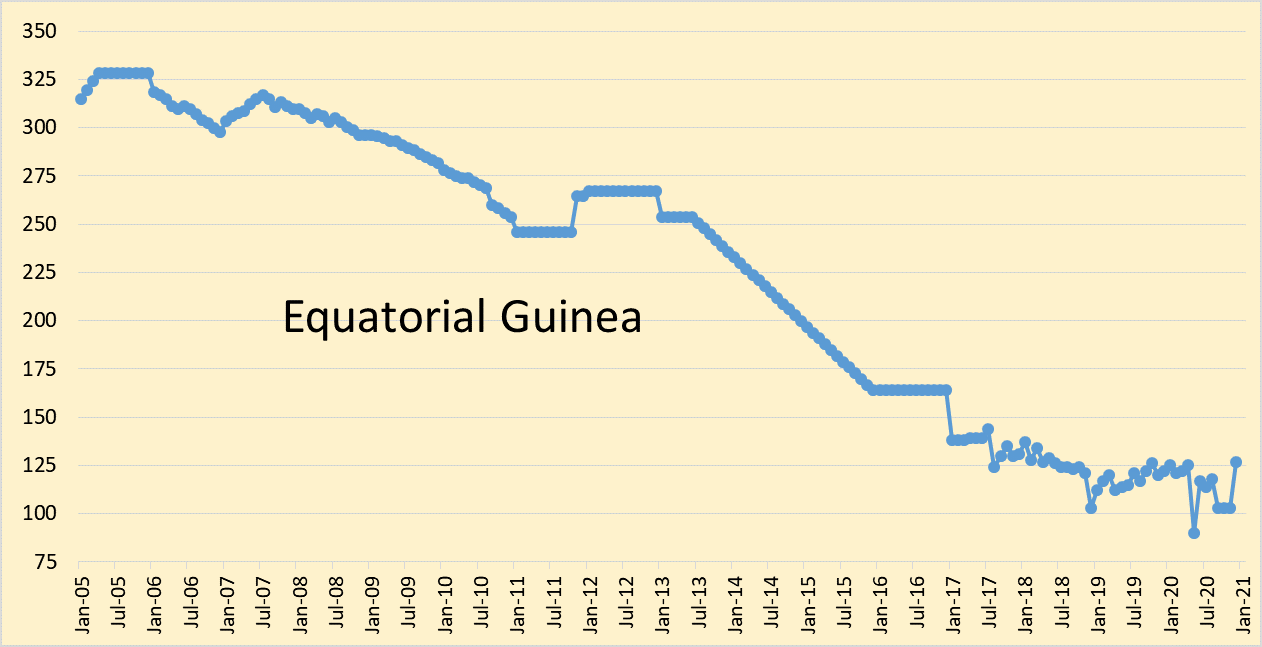
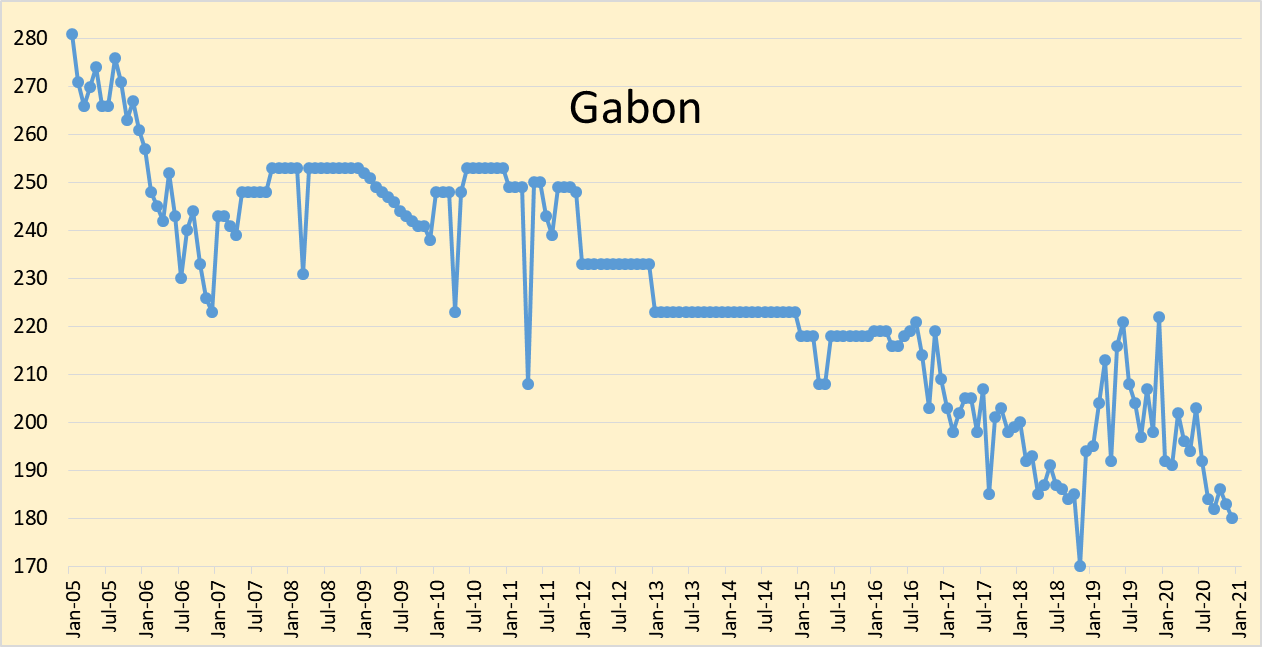
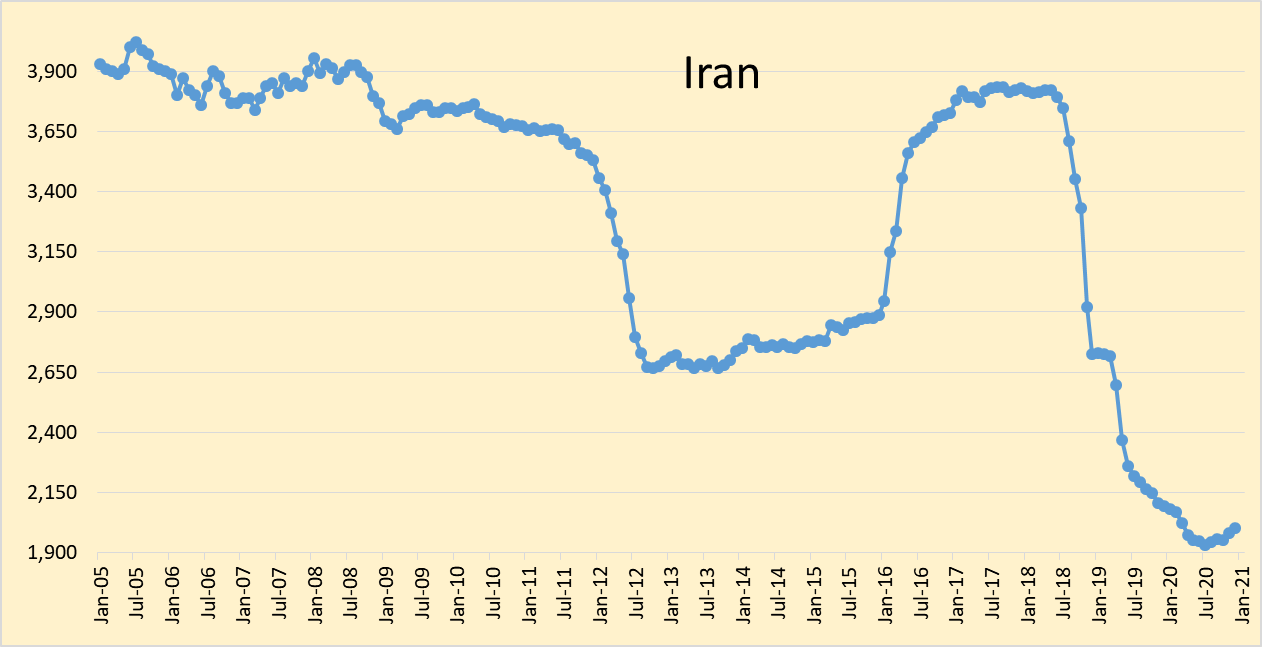
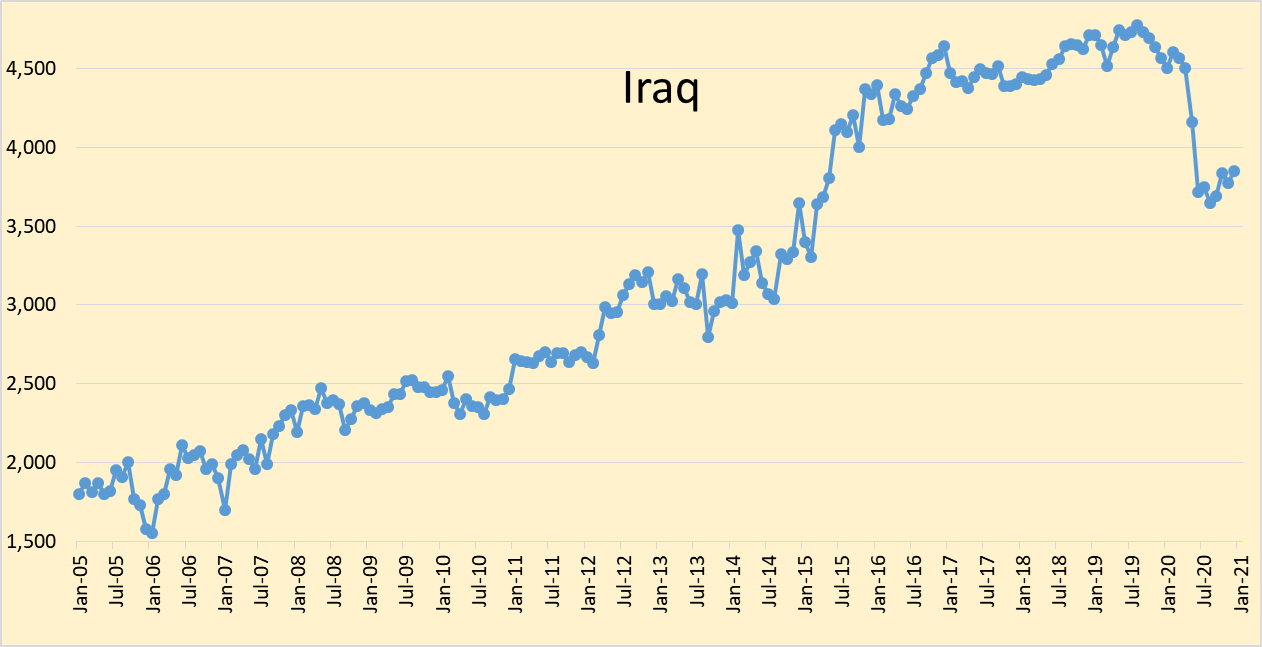
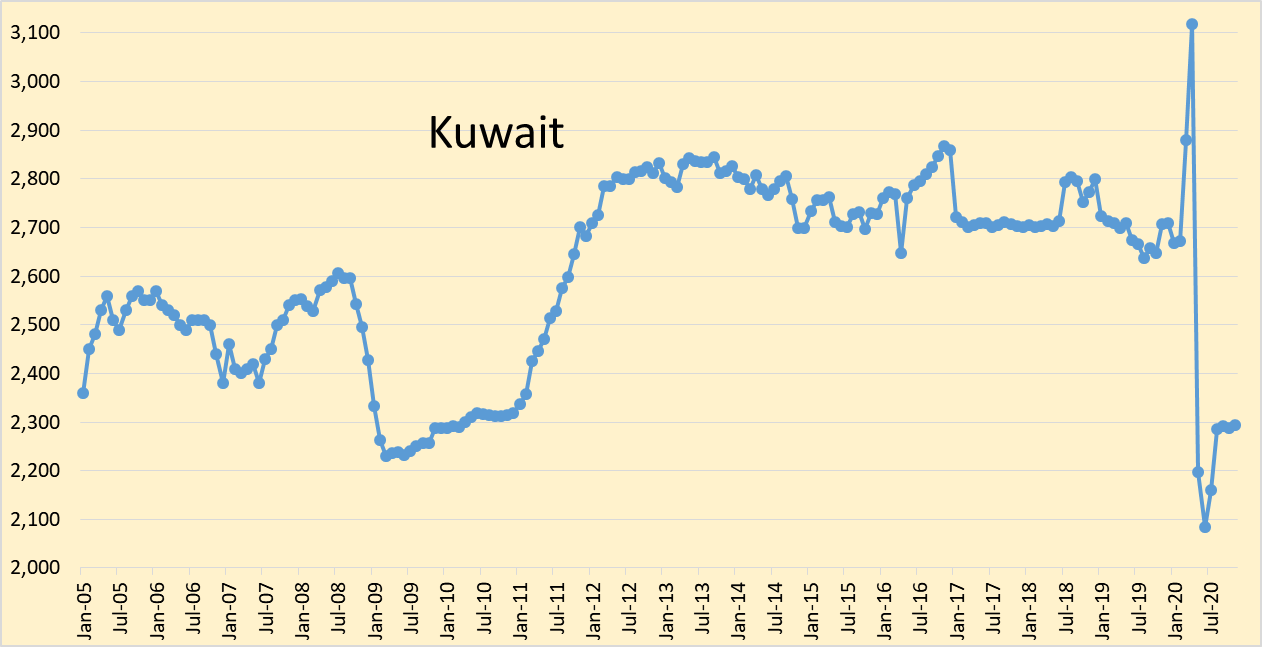
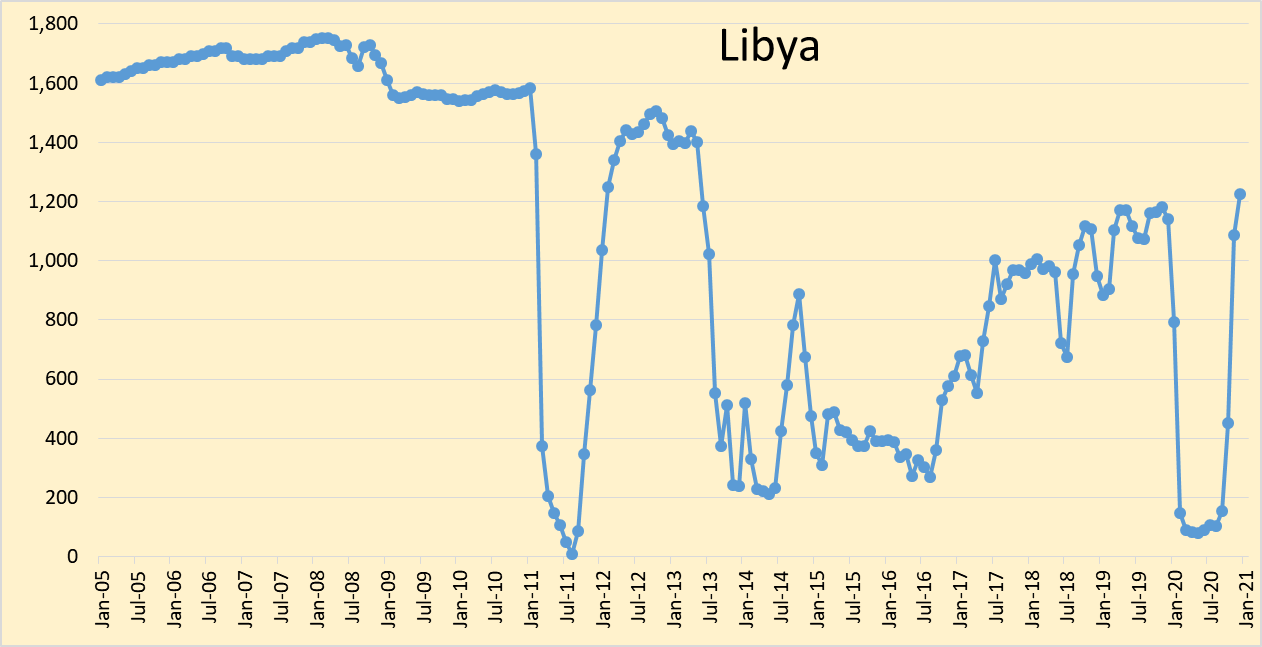
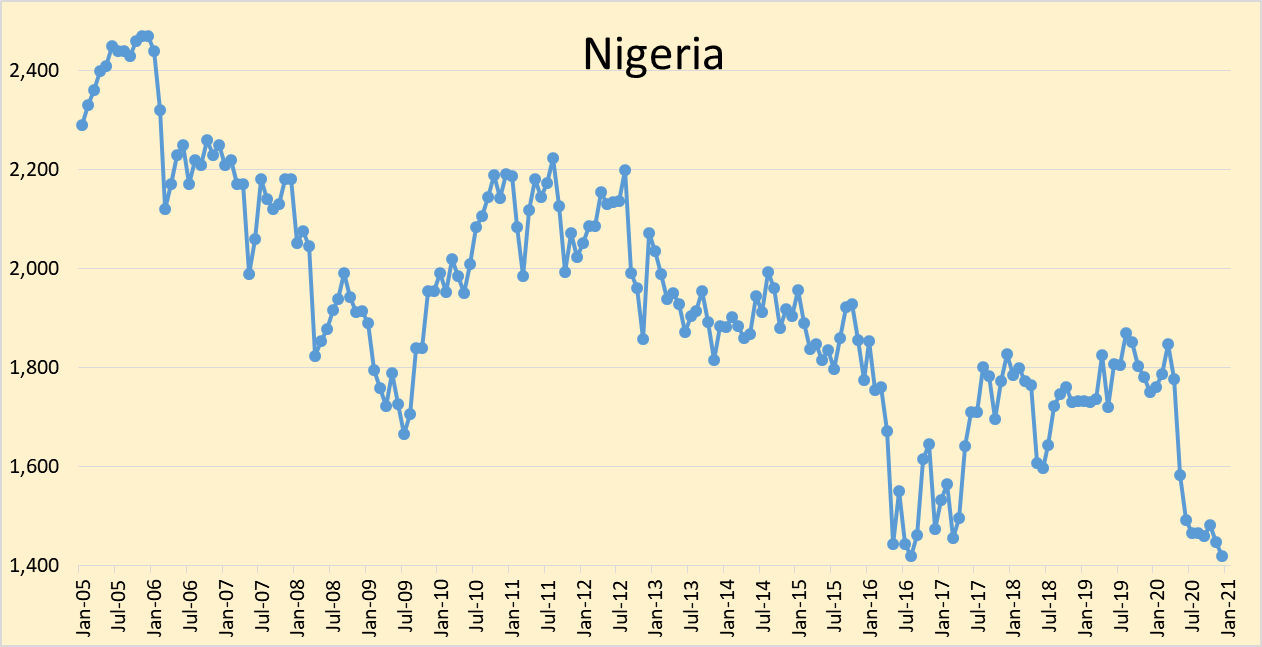
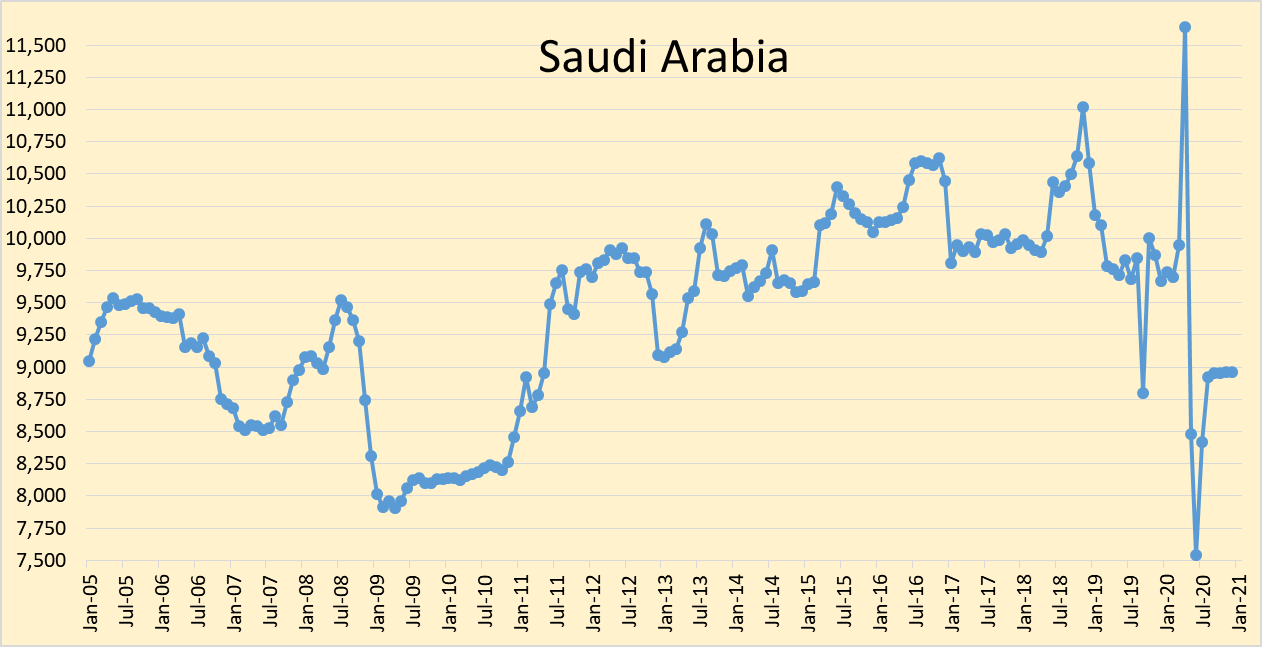
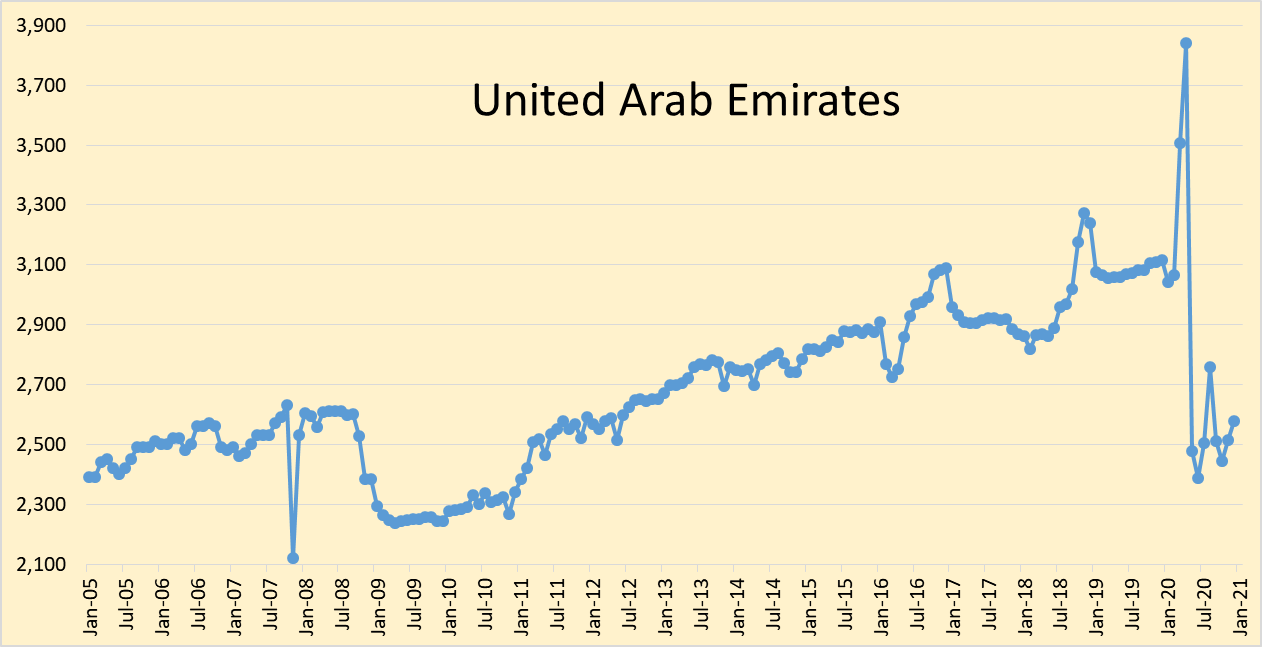
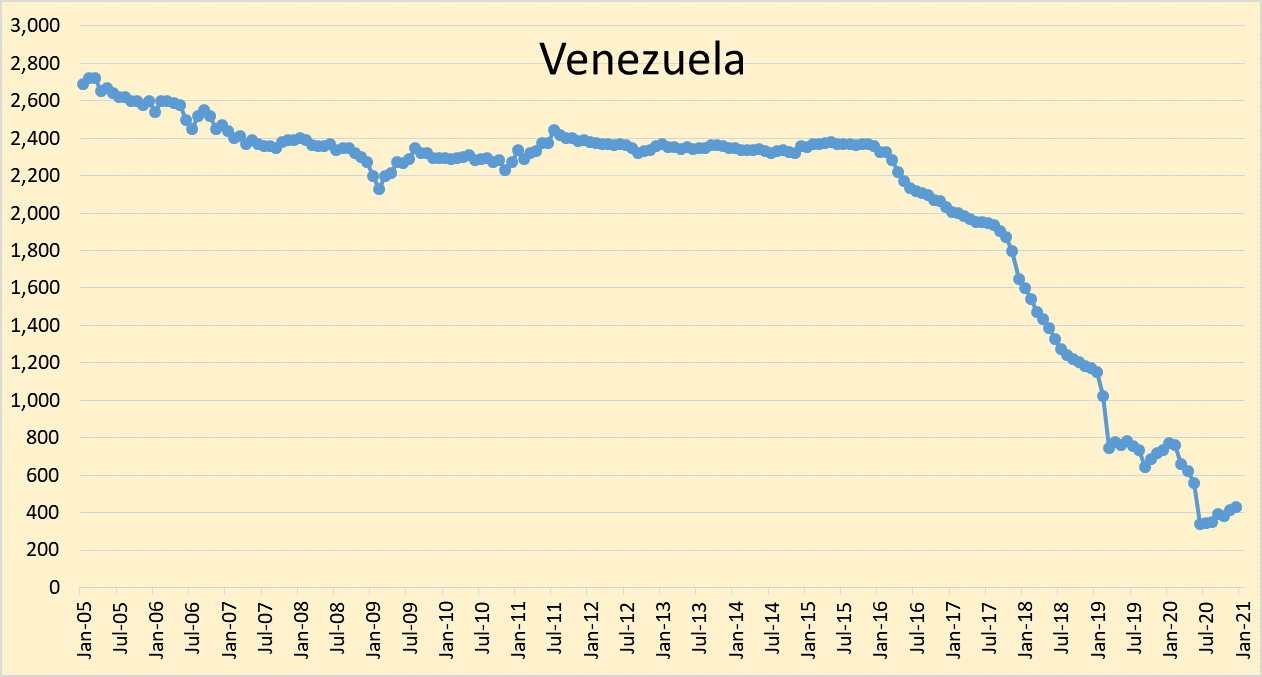
OPEC Monthly Oil Market Report for December 2020 was published this week. The last month reported in each of the charts that follow is December 2020 and output reported for OPEC nations is crude oil output in thousands of barrels per day (kb/d).
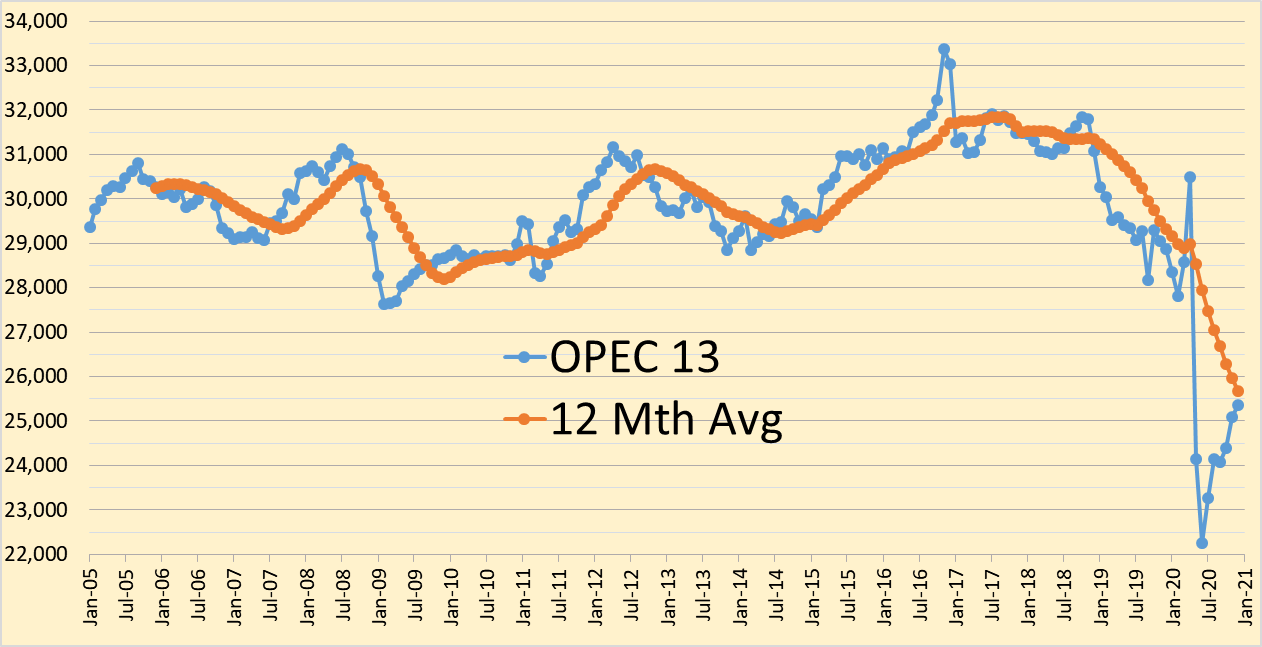
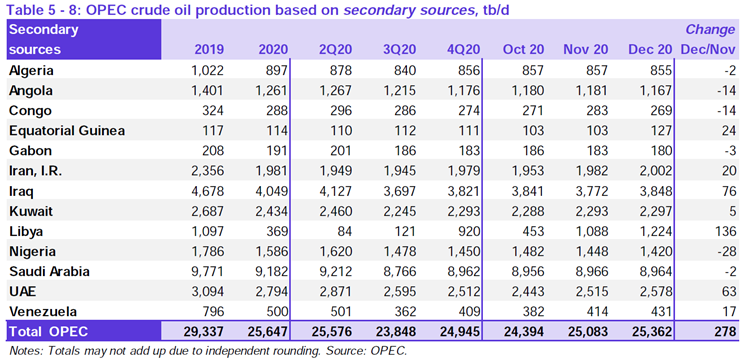
OPEC crude output increased by 279 kb/d in December, November output was revised down from last month’s report by 26 kb/d.
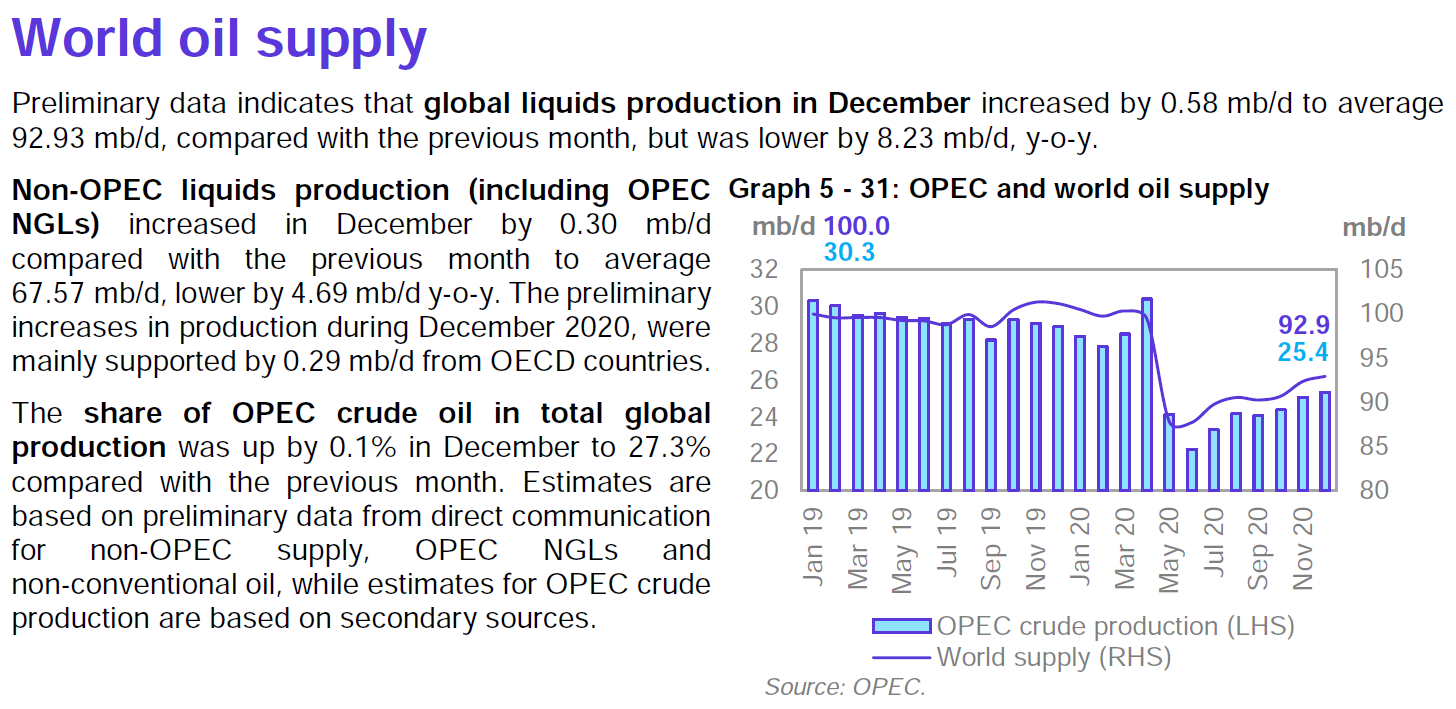
World liquids output is down by 8.23 Mb/d from 12 months ago, roughly 8%.
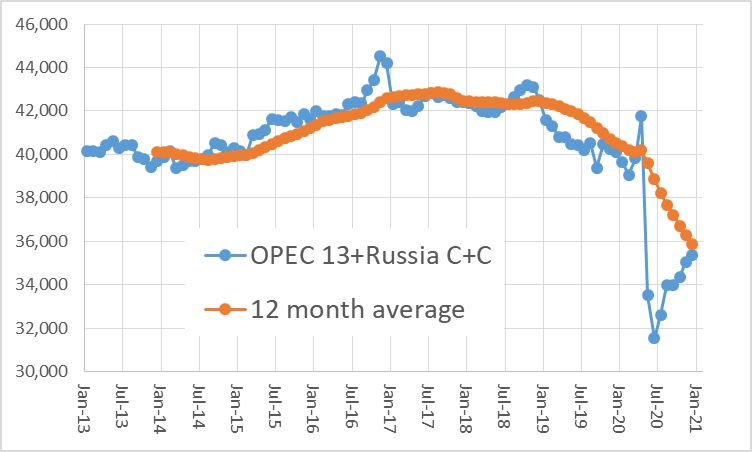
The chart above uses data from the Russian Energy Ministry and converts from metric tonnes to barrels at 7.3 barrels per tonne, the combination is OPEC crude plus Russian C+C output. Russian output increased by only 13 kbo/d in December 2020, OPEC13 crude + Russian C+C output increased by 292 kbo/d in December 2020.
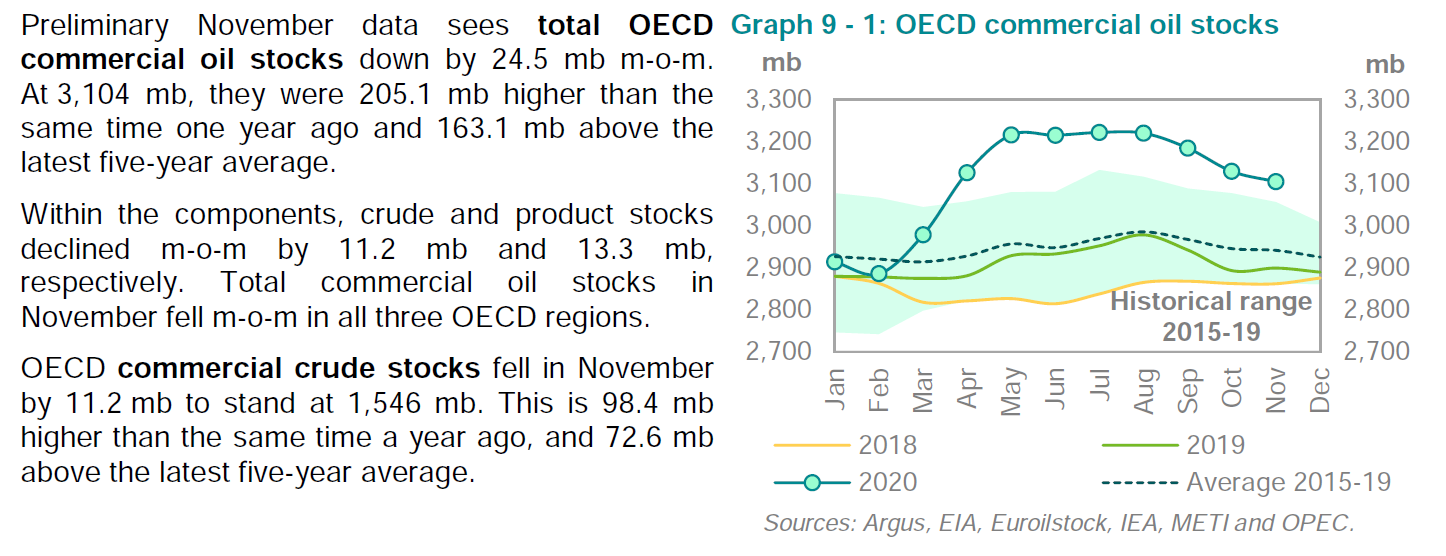
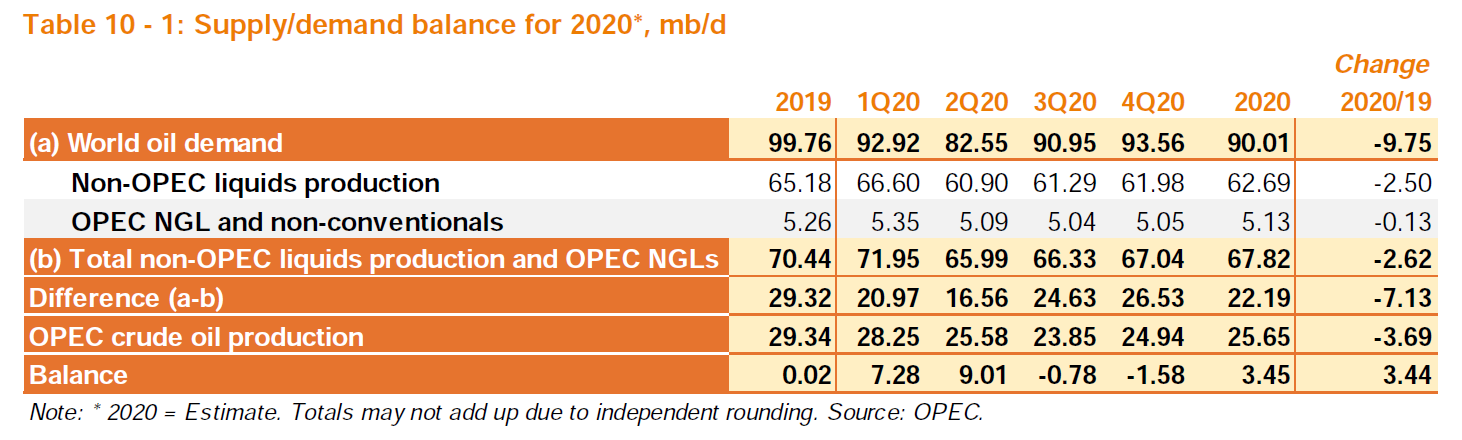
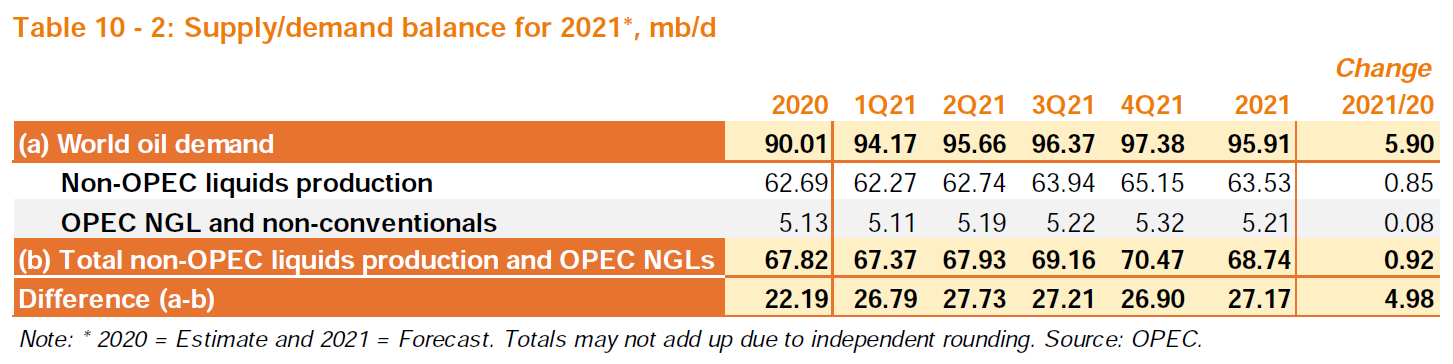
If OPEC’s World demand estimate for 2021 is correct and their estimate for non-OPEC liquids output is also correct, then an OPEC average output level of 25 Mb/d in 2021 would reduce World stocks of petroleum products and crude by 730 million barrels per day (365 times 2) because average demand for OPEC crude is about 27 Mb/d in 2021. Note that only 205 million barrels need to be drawn from OECD stocks to bring them close to the December 2019 level when the market was fairly balanced. At a 25 Mb/d crude output level for OPEC, only 103 days (3.5 months) is needed to get back to a balanced oil market under the assumption that OPEC estimates of future World oil demand and non-OPEC output are both correct.
Of course nobody correctly estimates the future.
82 responses to “OPEC Update, January 15, 2020”
Dennis , tks for the update . Summary at the end regarding worldwide inventory is interesting .
Thanks a lot Dennis. I really appreciate the effort you put in to things here. If there was a “pass the hat”/donate button I’d hit it.
The latest from Art Berman . Always interesting .
https://www.artberman.com/2021/01/15/duc2k-drilled-uncompleted-wells-wont-save-u-s-oil-production/?utm_source=feedly&utm_medium=rss&utm_campaign=duc2k-drilled-uncompleted-wells-wont-save-u-s-oil-production
Dennis, how is Ron? Where do you take the data from for the period BEFORE certain countries joined OPEC, for example Congo (Brazzaville) between 2005 and 2018? EIA? OPEC reports crude w/o condensate but EIA includes condensate in crude.
Matt,
I got the data from Ron, so not sure where he got the data, possibly EIA, so yes there would be a problem with condensate for those nations that have recently joined OPEC. Last I heard about a month ago, Ron is doing fine.
Just a thought . WTI is now at $ 52 and the buzz is that shale is coming back . My question ? How much have the inputs gone up that this is an uneconomical price for shale comeback ? In India price of steel is up 55% since 2019 , just received an e mail from an old associate of mine from China says steel is up 35% . Why this cropped up ? In India currently there is a farmer agitation on which I have posted on the other thread . The govt raised the minimum support price for buying grains etc but simultaneously increased price of diesel + 50 % , reduced fertiliser subsidy , pesticide prices up +30% , abolished electricity subsidy etc . The result is that the farmers loose money even though the minimum support price is increased . SS and other stripper well operators are a low OPEX operation , but shale is a high OPEX operation . How much did the cost inputs viz; price of steel ,sand ,crew etc increase in the oil patch ? I doubt that there will be a comeback at this price for shale . It is comfortable for the stripper wells but not for shale .
The price of steel affects us too. It went up in US awhile ago due to steel tariffs.
We don’t use as much, unless we drill. Down hole rod and tubing failures is where it affects us. A joint of tubing costs over $1 more per foot than it did. So around $40 per per joint. From $2 per foot to over $3 per foot. A scrapper buys our old tubing and rods, he’s paying us more too.
Also matters regarding pumping units. Fortunately we don’t have to replace those often. Maybe 2-3% a year. We keep an inventory of spares and have the ones that break down repaired by a machine shop.
Also affects the price of stock tanks. We probably average replacing one a year. Replaced several proactively when oil was high.
High steel prices will definitely be a drag on US shale.
Shallow sand,
Can you give more detail on when this increase in steel price occurred? Some tight oil companies did quite well in 2018 (EOG and Occidental which between them have produced about 30% of cumulative US tight oil output since 2008).
Started going up for us in 2018.
Thanks Shallow sand.
That is a big increase in 2 years time, mostly due to US tariffs on China?
Dennis. I don’t know the answer. We have checked around some and can’t find a better deal than where we have traditionally bought rods and tubing.
Went from mid $2 per foot to mid $3 per foot.
Thanks shallow sand,
Hopefully things will improve during the Biden administration, at least the trade policy will likely be more sensible. That is a big increase in price.
When they put tariffs on foreign steel and aluminum, including Canada.
Nothing like protecting declining industries, including domestic FF production.
The wild card in all these supply predictions is the stability of the ME. One missile and one retaliation and we’re back to $100 oil, imho.
SS , not only steel but also sand ,the crew etc,, a better term would be THE FULL PACKAGE to bring the oil up from the shale plays to Joe six pack in Montana .
HNH.
Labor will continue to be the biggest problem for US upstream going forward. It is seen by many young people as a dying industry.
I have stated here before that the workforce in our field mirrors the age of farmers. Many in 50s and 60s.
And yet there is a desperate line up of applications for high paying Canadian FF jobs.
Pay, and they will come. If everything is a cost cutting exercise in a low price oil environment, including valuable skills and knowledge, the result is inevitable. What would it take for wage stability and job security, an additional $10/bbl? Maybe it’s time for a nationalised oil marketing board for price and supply stability for domestic production? Otherwise, it’s always boom and bust with predictable results. And no, it isn’t always this or Venezuala. There is a lot of room in between.
Paulo. We are in a small, conventional field. There may be more younger people in larger areas such as Canada, US shale and GOM.
We have many young workers here in refining. Pay and benefits are much better. Job stability was, but there was a big reduction in force this past summer.
I live in Düsseldorf, a hot spot for seamless steel tubing. The technique was actually invented here by Mannesmann before WWI, but the company sold the business to a French company (Vallourec) about 20 years ago.
There are several factories making pipes in a cluster about five miles from my house. The high quality steel needed comes from a plant in Duisburg, about 25 miles north of here. My neighbor is in the business and exported tens of thousands of tons of seamless steel tubing to America for frackers.
Some years ago they built a factory in Youngstown to save shipping costs, because the tubes take up a lot of space. He still ships the steel from Duisburg though. He was worried when Trump announced those tariffs, but in the end it didn’t harm his business much. Of course, 2020 was terrible.
https://www.industryweek.com/the-economy/article/21951798/pipe-maker-to-build-new-mill-in-youngstown-ohio
Ovi in the last thread wrote the U.S. could only supply 300 thousand barrels a day of global demand. What is stopping the U.S. from importing oil, slapping a ‘Made in America’ sticker on the barrel and exporting it as U.S. crude oil and having it appear in an EIA report as U.S. production?
Hume , an interesting thought .
Hume
I took that number from Dennis’ Permian chart. The US forced OPEC and Russia to cut back its production. One of Dennis’ Permian charts showed a roughly 300 kb/d increase between 2022 and 2023.
The EIA requires oil companies to report their production and collects royalties. Not sure why anyone would want to import oil and claim they produced it.
Ovi,
EIA does not collect royalties in US, the royalties are paid directly to landowner by producers, state and local governments collect excise taxes, where production occurs on federally owned land, royalties might be collected by the federal government, but that is likely the only case this occurs. I am not a lawyer, it is no doubt far more complicated than I have stated above in practice.
I agree that oil that is imported and then exported (this does occur for imported crude that is exported in product form) is likely accounted for properly by the EIA.
You’re right Dennis.
Royalties are federal lands are paid to the feds. That is certainly the case offshore, and I suspect it is also the case for onshore Federal lands.
That wouldn’t increase net exports, which is what counts.
Data from MOMR Dec 2020 chart on page 41 pf that report.
OPEC reports 481 completed wells in US shale plays in Nov 2020 and 523 completed wells in Dec 2020, down by 169 completed wells from the December 2019 completion rate. Note that this number likely includes both tight oil and shale gas wells (the split is unknown). Using September data from shale profile, about 80% of all completed wells in shale plays (oil and natural gas) were tight oil wells in ND Bakken, DJ-Niobrara, Eagle Ford, and Permian basin. If we assume this ratio is unchanged through December 2020 (we do not know the ratio in Dec), then tight oil wells completed in Dec 2020 would be 0.8*523=418 completed tight oil wells in the 4 major basins in December, based on the Rystad estimate used by OPEC.
Dennis
There seems to be a number of sources for completions and to be frank I do not know which one to believe. Attached is a chart that may help in trying to shed some light on this issue.
The chart contains latest well data for the Permian from ShaleProfile. The SP data is for the number of wells started in that month, which I assume would be classified as completed.
As can be seen, from January 2019 to March 2020 there is some consistency between SP and EIA completions as the graphs cross above and below each other. That trend continued through the decline. In March the EIA completed wells are 59 higher than SP. In June it reverses, with SP 57 higher than the EIA. They are equal in August and they diverge in September. I should note that the updated SP well data only changed by a maximum of 3 for the August and earlier data.
Ovi,
We do not have great data, I agree, shaleprofile data is likely better than EIA data in my view, but if you look at past shaleprofile estimates for first flow wells (which is the number of wells completed for any given month) and compare with the most recent estimates, you will see that the most recent months reported are underestimates, likely due to incomplete data from state agencies. Chart below compares April 2020 Permian update with Oct 2020 Permian update. The most recent 5 months for the April 2020 update are about 70 wells lower than the Oct 2020 update on average for those 5 months. Chart below shows first flow wells from Jan 2019 to April 2020 (most recent data point for April 2020 update).
Forgot to mention clearly that the data in the chart for Permian completions comes from shaleprofile.com.
most recent Permian update at link below (Oct 2020)
https://shaleprofile.com/blog/permian-monthly-update/permian-update-through-october-2020/
and from 6 months earlier (April 2020 update) at link below
https://shaleprofile.com/blog/permian-monthly-update/permian-update-through-april-2020/
Go to well status and change to first flow wells only.
Thanks Dennis.
There have been a few suggestions of recent that a spike in oil prices may occur this year. A spike in oil prices suggests oil demand outstripping supply.
The above graphs suggest that OPEC / Russia may have up to about 6 Mb/d spare capacity. Under what scenario can oil demand outstrip supply when there is so much spare capacity? And the economic outlook looks so bleak?
I don’t know myself. Just struggling to see how a spike in oil prices can occur this year. Interested in others thoughts.
MIO , no, oil demand, is not outstripping supply . There is about 7 MOPD that is cut from production voluntarily .If demand was more than supply then why did KSA volunteer to cut 1 MOPD of its supply at the last meeting of OPEC + . The reason price is up is two factors (1) Low dollar (2) inflation . Price can go to infinity . The Venezuelan stock market is all gung ho , do you want to go there ? So now to the last part of your question . Yes ,but in relation to what ? Oil is priced in USD a FIAT currency , so in relative to what, ? Wheat , rice ,copper , gold ? We will see what happens . I have no clear picture at this time as the new Biden administration takes charge , we just have to wait .
Minority of One,
At the beginning of the pandemic it was thought global oil consumption had dropped to 69 million barrels a day. The EIA Short Term Energy Outlook has the figure at 91 million barrels a day. 9 million barrels off pre-pandemic levels. The oil market is showing supply is tight and large inventory draws are being reported.
The link which Hole in Head provided from Art Berman’s blog suggests if U.S. rig count doesn’t increase in 2021 then U.S. production will fall by 4 million barrels a day. If that happened U.S. consumption would represent nearly half of all global spare capacity.
Minority of One,
I do not expect a spike in oil prices, just a steady rise in oil prices if OPEC+ maintains discipline. Certainly if OPEC and Russia pump all the oil they can, prices remain low. Also the price rise I predict is quite slow, oil prices rise to $70/b in 2019$ by 2030, so about $2/bo each year from 2020 to 2030, not exactly a spike in oil prices.
Dennis,
Any guess or data about the correlation of GDP and oil consumption during a recovery, given changes in behavior? In particular, it seems like telecommuting, teleconferencing (like Zoom) and online shopping may have been given a sharp and lasting boost, at the cost of light vehicle and aviation travel. My sense is that a lot of people have wanted to work at home, travel less to conferences & business meetings, and a lot of people have been forced to do stuff like shopping online much earlier than they would have otherwise, and now employers have been forced to allow this stuff. My wild guess is that 30% of the loss in fuel consumption will be permanent.
NickG,
I have not given it a lot of thought. I expect there may be some reduction of travel to work due to more telecommuting in the future. Keep in mind that humans are social animals, so many will continue to want to go to the office for human interaction, though the hours might be more flexible so perhaps there will be less rush hour congestion. I think something less than 30% is more likely, perhaps 10 to 15% reduction due to changes in behavior, in the short term (say through 2022) once the pandemic subsides.
Also there will be a lot of pent up demand for vacation travel, visits to relatives in other nations, or states, etc. so that will have the opposite effect for a year or two.
We will see. The typical rise in C plus C consumption from 1982 to 2019 was an average annual increase of 800 kbo/d in C plus C consumption. I imagine this roughly 1% annual rate of increase in C plus C consumption may continue going forward as low and middle income nations become wealthier and but more light vehicles and consume more durable goods as they increase their average level of income. I expect World real GDP will grow at an annual rate of 2.5% to 3% from 2024 to 2035, as it has mostly from 1982 to 2019 (2.93%/year). Per capita real GDP for the World has grown at about 1.47% per year from 1982 to 2019, I expect that to continue, after the pandemic and UN population projections (or those from Wittgenstein Center in Austria, search on Wolfgang Lutz) can be used with that per capita growth rate to estimate future World real GDP.
Chart below has the World Real GDP in trillions of 2010 US$ from 1980 to 2040, using the UN medium population projection and the assumption that per capita World Real GDP grows at 1.47% per year on average from 2019 to 2040. In 2019 World real GDP was about 85 trillion 2010 US$ and for this scenario it grows to 144 trillion 2010 US$ by 2040.
The above scenario can be improved upon by removing the population growth as a factor and using the PPP measure of GNP per capita. In both cases the measure is approximately linear over the last 20 years. Also it is worthwhile to show what happens by contrasting what will happen with the US versus China over the next 20 years.
https://data.worldbank.org/indicator/NY.GDP.PCAP.PP.CD?locations=US
https://data.worldbank.org/indicator/NY.GDP.PCAP.PP.CD?locations=CN
The US will increase from 65,000 to 124,000 but China will increase from 17,000 to 107,000 per capita PPP. With triple the population and triple the growth rate per capita, China will not only dominate the world economy but seriously bend the growth rate for the world economy upward by a factor of 3. I doubt that the growth will be fueled by crude oil.
The US will increase from 65,000 to 124,000 but China will increase from 17,000 to 107,000 per capita PPP.
Where did those projections come from? Does that just use the average historical growth rate?
Jay Woods,
Not everyone agrees that PPP is the better way to measure GDP.
Accounting for population growth seems the better way to look at things. Growth in GDP per capita has been very steady at the World level from 1985 to 2019, this may continue or may not.
Growth rate for G20 has been lower than emerging economies for quite some time. As China gets wealthier its growth rate will slow,
Thanks for all the feedback.
WTI printed a bearish engulfing pattern last Friday on daily chart. We shall see if it plays out to the downside. Dollar is turning like I mentioned it would. Takes a bit, a few weeks to get all the markets to line up and go the opposite direction. Particularly when the trend has been so strong in one direction. Being everybody is short the dollar and long everything else.
I’m not convinced that the move up in bond yields is for real. Not because the FED can push them lower if they want. But because economic reality don’t really support the whole reflation trade the recovery trade. Hope meets reality at some point. And chances of another US lockdown are pretty good. After Trump is out of office. The 100 day masking up Biden is pushing isn’t going to lower death totals or case totals. Vaccine will likely take months to turn numbers around. So a short term lockdown 6-8 weeks is likely in the cards.
Coppers rise is really due to a physical shortage. Due to supply chains. Mines have been close. China has been hoarding, stockpiling. This isn’t due to the so call reflation trade where things get back going toward normal. Not everything we are seeing is due to a weaker dollar.
There have also been supply disruptions on the farm. Not higher oil prices pushing food price. Gold really should be the the canary in the coal mine here. It’s rolled over heading south. Ditto for silver.
My honest opinion is that the government and central banks of the world can’t fix this no matter how much fiscal and monetary stimulus they do. What they are doing is actually compounding the problems. I understand why they do it. They don’t want to know what real price discovery is. I can’t blame them.
Even if you take away Covid. All the crap that central banks have been doing since 2008 has made it where banks don’t want to lend. What we are facing goes way beyond Covid. I think you could also add that energy supplies going forward will likely be less ten years from now than they are today. Why would any bank want to lend? Governments and centrals banks can do whatever. It don’t matter one bit what they do if banks won’t lend. That is why I don’t see a fix to the situation.
One thing a lot people think is that the FED can print money. That the government can print money by issuing debt. Only thing the FED can do is create bank reserves which aren’t money. They are a form of collateral that they use to swap for another form a collateral when doing QE. That is all they are doing. No money is created.
QE is deflationary. Every time they remove a treasury or mortgage back security from the market it means less collateral is available to be used to make loans. They can hold interest rates down by doing QE. They think lower interest rates will spur lending. But in reality banks don’t want to make as many loans when interest rates are low.
Only commercial banks can create money. And they do this every time they make a loan. So in order to have an actual recovery. Banks have to have a reason to want to lend. What the government and centrals banks do doesn’t matter.
Hume,
Keep in mind that US output has already fallen by 2.3 Mb/d (March 2020 to Oct 2020), shale profile predicts another 1.2 Mb/d of decrease for tight oil output (from Oct 2020 to Dec 2021) to at current rig count levels, note that it is unlikely that rig counts remain at this level, if oil prices continue to increase. A fall in output of perhaps 3.5 Mb/d from March 2020 to Dec 2021 is about as bad as it will get, and another 1.2 Mb/d from the Oct 2020 level. I think a more likely scenario is that C plus C output will fall another 600 kbo/d from the Oct 2020 level to about 9.9 Mbo/d in June 2020, I expect US C+C output will increase from there perhaps returning to the Oct 2020 level by February 2021. I agree with Berman that the STEO estimate is likely optimistic.
Oh My. Holy Dillbit Batman.
https://www.zerohedge.com/energy/buffett-wins-biden-set-cancel-keystone-pipeline-permit-first-day-office
A non-political comment in same post.
“Over the last three years, under my leadership, our economy is stronger than ever before, and America has achieved energy independence.” —Donald Trump
So why do you need a new pipeline from Canada again?
If Janet Yellen comes out and says what she is expected to say today. Which is that they are going to let the market set interest rate and not seek a weaker dollar to gain advantage. And at the same time urges stimulus to be large. Bonds are going to get hit hard. Yields are indeed headed higher. Yen crosses will blowout to the upside.
Only question will be how high can yields go before something breaks. Which will be anything that is a risk on markets which includes oil. Then when something breaks like equities or housing market. Yields head back south.
Yields will be stopped before something breaks.
By the one or other new trillion $ – and as in April they will buy up to junk bonds. And if this is not enough, stocks, too, like the japanese or swiss centrall bank does already. The swiss central bank is already the single biggest owner of FANG stock.
Too high interrest rates and all these zombie companies and red hot housing market will collapse and crash the banks. This may not happen and will not happen – at the price of even more base money.
In the long run this will kill (not necessary crash) the $ and all other big currencies. And no, Bitcoins are no alternative – there can be millions and billions of different private digital coin systems, everybody with computer knowledge can set up his own digital currency (hello Dogecoins, “worth” a billion $ for a fun project).
There will be just a new currency from central banks. And if it’s a digital one, we will be really supervised by big brother. 4 packs of cigarettes? 10% increase in health insurance.
Oil usage in the western states will go down anyway:
– More home office, less business travel
– More Amazon deliveries, less drives to special shops
– Green agendas in the whole west, trillions of state $ invested there the next years
In asian countries I don’t know – but I think China wants to get independent from oil deliveries over vulnerable long routes and in the witches cauldron of persian gulf where the oil price is made ( a war here, and all fracking in the USA doesn’t prevent scare 200$ oil).
Eulen , yields will be stopped . I don’t think so . US needs to sell $7 to 8 trillion of bonds in 2021 . Where is the money ? All govts/CB need money to backstop there own Covid expenses and QE . Will/ can the FED monetise all $ 7 trillion ? If the yields don’t rise there could be a failed auction and the final nail in the coffin of the world’s ” dollar ” trading system . The FED is cornered , but I have seen it cornered before and then wriggle out , the problem is that with every new wriggle the room to maneuver becomes less .
I agree with you 100% on bitcoin . Regarding China the weak point is that it is a nett importer of energy but the real Achilles heel is that it is also plugged into the world’s ” dollar” trading system . Until it breaks away it will be vulnerable .
Where the money is?
It’s a few meetings in the FED, and then someone presses a button. It has been done the last 12 years after the Lehman crisis – why stop it now?
In the most critical week in march they monetised a trillion, so it’s possible.
And it’s like if you hire in the Mafia. At the beginning you can leave (before 2008) when you only did a bit of stealing and dealing – but after your first murder you can’t leave anymore, until the end.
Eulen , yes that is what they will do . Result downward pressure on the dollar , upward pressure on inflation = higher interest rates . It is a self feeding loop , like a snake eating its tail .
The downwards pressure on the dollar will be compensated by red hot printing presses of all other big currencies.
They can’t afford a dirt cheap dollar for their own economies. This strange US FANG stock buying program of the Swiss central bank is the blueprint – they are stopping the rise of their own currency since 2008 by printing more and buying dollars. Otherwise, the swiss industry would have been completely destroyed.
That’s why I say all big currencies will be reset some day. Perhaps it will be even done in the same week. Or in a complete chaos – no other possibilities.
Eulen , a global reset means the end of the ” dollar” trading system and the end of the dollar as a reserve currency . The trading system is a VLCC fully loaded and it takes a lot of time and effort to turnaround . What in the meanwhile it is turning around ? Universal pain for the world since all countries are plugged in the ” dollar trade ” . Frightening .
Swiss CB is the largest owner of FAANG.
Japans CB owns about 60-70% of Nikkei
Yellen will urge congress to allow the Fed to buy stocks.
Welcome to communism.
CBs buying equities is not communism. It’s something bizarre but not that.
The point is to stretch out something that can not be sustained until enough investments have been made in “our green future” to exploit the window. After that I fear that there are few places to hide for capitalists (but a few places maybe; losing less is also a win). The third/fourth gear of this is going to have to get into motion: The fossil fuel conservation based on too high prices. For fossil fuels producers they may have to endure taxation, but not to death, because they are totally necessary sooner or later. During extreme downturns oil/gas producers are the safe haven if they get dragged down to deep, because they have to be kept alive.
Just an independent thought.
In the future there can be a deal to let oil/gas producing nations export the major part of their surplus production to “very fair prices” distributed to most of nations globally. Another part can be exported at exeptionally high prices through independent channels /refineries and give a consumer price that only the rich can afford, and thereby tax the rich and also keep producer nations “happy”.
To make it work the cheap part has to be necessary/important oil consumption – probably rationing in some way.
But governements don’t like independent thoughts nowadays, so better not make this important.
Uhhmmm…I think this belongs in the other, non-oily side.
Let me say: if fossil fuels get very high prices (either to tax the wealthy, or to include the costs of pollution, security, etc,) they’ll simply be priced out of the market. There isn’t any need for expensive FF (except in the short term). Even at current prices, most electricity can be provided more cheaply with wind/solar, and most transportation can be done more cheaply by EVs. This is a pretty new reality, but it’s being accepted and acted upon by power and vehicle markets even as we speak.
There are niches that are much more conveniently served by liquid fuel (aviation, seasonal farming, container shipping by water). Low-carbon liquid fuel is more expensive than diesel currently, but if you price oil properly then oil will even be priced out of that market.
Please reply on the non-oily side.
Kolbeinih, what you are basically suggesting is ” fuel rationing ‘” on a worldwide basis . Will not/cannot happen . Who will decide ? A committee ? ” Fuel rationing by committee ” is the same as ” Death by committee ” . There will be no such action, when push comes to shove it will be every country for itself .
HHH, I think it was Albert Edwards (perma bear at Soc Gen ) who said max is 1 1/2 % . His reasoning was that when the FED started raising rates the last occasion the market slumped when the rate was near 3 % and the FED had to backdown, but then the debt was half or so of what it is now . Market cannot afford higher rates at the current level of debt . Yes , there is trouble when an irresistible force meets an immovable object . Something has to give . The problem is the ” domino effect” and contagion from, housing to finance to currency to commodities . I think the FED + CB’s are going to loose control . What is your take and also others who have knowledge about these issues ?
P.S ; We are already at 1.1% so not a lot of room to maneuver .
Hole in Head,
The Federal Reserve won’t lose control of inflation while inflation is confined to assets and the stock market. Note the weighting of the Nasdaq is with the top 5 companies.
The U.S. authorities are desperate to keep a lid on the price of gold and oil. The Fed has a two percent inflation target. If they allowed the price of oil to rise they would get all the inflation they can handle. Another inflation trigger is bitcoin. The LMBA, BIS and the Fed and their cohorts at the Commodity Exchange (Comex) are bidding up the price of Bitcoin in an effort to dissuade investors away from buying gold and leaving the Comex short of deliverable gold. If Bitcoin holders were to sell en masse the sums involved would lead to inflation in everyday commodities.
Hume , the FED has stopped targeting the 2% inflation . Powell said they will now target ” average inflation ” which implies they are ready to accept higher short term inflation with the hope that they can control the medium and long term so that ” average inflation ” is to their liking . Unfortunately ,past history and experience has been to the contrary . When inflation control is lost then it is lost and the only solution is what Volcker did which under present levels of debt is impossible . Further as you have pointed out bitcoin is a new phenomenon which did not exist earlier . Last I read there is $1 trillion of bitcoin in circulation . I don’t know the mechanism but it if on a click of a button it could be converted from ” virtual ” to ” real” as you have indicated and used to buy gold or oil or any other commodity then things will really go to the moon .
Hole in Head,
Chesapeake Energy just came out of bankruptcy. Occidental will soon file for bankruptcy. Which bank or financial institution will loan these companies money to continue drilling for oil at current prices? The U.S. needs the barrels of shale oil these companies produce but doesn’t want high oil prices to facilitate those ends. What are the chances these companies will issue corporate bonds and the Federal Reserve come in and buy up them as a mean for them to continue operations?
Hume , a difficult question to answer . The FED will not buy these directly but can instruct other banks or financial institutions to buy or may be create a SPV which is an off balance sheet item to buy the bonds . As we have previously discussed the FED is now stuck between a rock and a hard place , any action it takes is going to have negative repercussions . The issue now should be how deep will the damage done to the financial structure by it’s actions . It is cornered , they know it . The problem is now the world knows it . Jawboning is not going to work anymore , it is past expiry date . For the moment we just have to wait till the transition takes place .
Hume ,some history on interest rates .
“Yield curve control was used by the Fed in mid-1942 to reduce the borrowing costs of the US government during the war. The Fed set the short-term yields at 0.375%, the 10-year yield at 2.0%, and the long-bond yield at 2.5%. It explicitly communicated these yields, and communicated that it would buy whatever it took to maintain those yields, and that’s how it went. By 1947, inflation was 18%, and the Fed gradually undid yield curve control.”
https://www.spglobal.com/platts/en/market-insights/latest-news/oil/012021-feature-saudi-aramco-faces-tough-2021-as-rivals-race-for-oil-capacity
Further work programs on fields such as Khursaniyah, and legacy assets like Khurais and Abqaiq that need workovers and rehabilitation, are being delayed, the source said, whereas at Aramco’s low-cost giant fields such as Ghawar — the world’s largest — production is increasing.
“…There isn’t a place in Ghawar that doesn’t have a drill, it is very dense. They’re beating the hell out of it.”
Pollux
When Saudi Aramco went public, this statement was in their IPO.
“The Company believes that the Ghawar field is the largest oil field in the world in terms of conventional proved reserves, totalling 58.32 billion barrels of oil equivalent as at 31 December 2018G for the Concession term, including 48.25 billion barrels of liquids reserves. The Kingdom’s original reserves of the Ghawar field increased from 19.0 billion barrels of crude oil in 1951G, when production began at the field, to 127.7 billion barrels of
crude oil in 2018G. The Ghawar field has accounted for more than half of the total cumulative crude oil production in the Kingdom but still maintained MSC of 3.800 million barrels of crude oil per day as at 31 December 2018G.”
Around 2005, speculation was that Ghawar was producing somewhere between 5 Mb/d and 5.5 Mb/d. To get to 3.8 Mb/d by 2018, implies a roughly 2% annual decline rate. This turns out to be consistent with what some SA spokesperson said around 2005. Something along the lines of “The natural decline rate of Ghawar was 8% per annum but continuous drilling reduced that to 2%.”
Dennis , demand is coming back ???
The BOE’s new bank stress tests consider “entrenched societal change on Covid-19”, including a 37% GDP contraction 2020-22, no flights or tourism, more global protectionism, working from home for years, no eating out, and weak commercial and residential property sectors: ROAR!
The Netherlands considers instituting the first curfew since WW2 and halting all flights from the UK, South Africa and South America from tomorrow: ROAR!
Germany will be locked down until 14 February: ROAR!
France is closing all cafes and restaurants until April 6: SACRE BLUE-OAR!
” Houston , we have a problem “
Hole in head,
You assume the future will be like the present (or perhaps worse). Generally throughout history this has not been the case. No doubt many thought that was the case in 1935, by 1945 things were different. I expect 2021 may be as bad for World GDP (annual averages) as 2020, we will have to wait and see. By 2023 World real GDP (at market exchange rates in constant US$) is very likely to be higher than 2019, my expectation is there is a 4 in 5 chance this will be a correct estimate.
Obviously nobody knows future real GDP.
Dennis , I am not saying anything . It is what the Bank Of England is saying . The rest info is only to update readers on what is happening in Europe in reference to lockdowns which effect the economy directly .
WTI has changed from Contango to Backwardation this morning. In other words, the front month contract, March, has a higher price than future months. In essence this means that, Refiners/Buyers are saying we want the oil today, not a few months from now. It also says to the drillers, drill now and sell your oil since you will get less in the future. It is an incentive to drill now.
While demand is down, it seems to imply that demand will be going up in the near term.
Ovi,
“In essence this means that, Refiners/Buyers are saying we want the oil today, not a few months from now. It also says to the drillers, drill now and sell your oil since you will get less in the future. It is an incentive to drill now”
https://www.energyintel.com/pages/eig_article.aspx?DocId=1080952
The breakeven prices for the supermajors. With and without the cuts in capex. Even those turning a profit at current prices with their capex intact have done so at the expense of suspending the dividend on their shares and cutting their workforce. There’s no incentive to drill at present and I suspect DUC and other stranded assets to be brought online before costly oil exploration is thought about.
Hume
Let me clarify. The message is “Drill and deliver now for those of you who can make a profit with WTI at $50/b because you will get less for delivery a few months from now.”
Rig numbers have been going up since late October when oil touched a low of $36/b. This indicates that some drillers either were expecting higher prices in the near term or could make a decent profit with WTI around $45. Texas added four oil rigs in the week of January 22.
SLaGeo and George Kaplan:
Any comments on what happens in GOM if permitting and leasing stops permanently? Right now just a 60 day moratorium.
Likewise, anyone here that can comment of what that does to shale? Most say they have 3-4 year inventory of permits. I didn’t realize you could hold a Federal permit that long before drilling.
Shallow,
A 60 day moratorium on leasing in the GOM probably means the postponement of the March lease sale. Not a big deal, in my opinion, as long as it’s only postponed. If it is cancelled, that’s a slightly bigger deal,, but I believe there still would be a sale later in the year – probably in November-2021. The bigger deal is if offshore lease sales are cancelled altogether. Now even that is not that bad because industry has a pretty healthy inventory of undrilled prospects from previous lease sales, and of course they still have all their producing assets, etc.
Now a drilling moratorium is much more serious. 60 days,, not so much. It’s unfortunate for operators with rig contracts and all that, but it’s really just a big inconvenience. Industry survived the drilling moratorium after Macondo, and that was a year, I believe. A permanent moratorium is a much. much bigger deal and would signal the winding down of activity in the GOM – no exploration wells so no new discoveries, no appraisal wells, no development wells,, All industry would be able to do is produce to depletion their online assets,, until the next administration comes along the changes everything!
The drilling moratorium after Macondo was for 6 months, not a year. Even after the moratorium it took a few months for permits to be granted because industry had to prove they could contain an oil spill. At least 2 offshore oil field containment companies were established to meet this need : the Helix Well Containment Group (HWCG), and the Marine Well Containment Company (MWCC).
I don’t think the current 60 day affects drilling. Just permitting and leasing? I’ll read up a little more.
Edit: S & P Platts seems to have the best article on this. I’m not good at providing links. Maybe someone could help?
https://www.spglobal.com/platts/en/market-insights/latest-news/oil/012121-us-puts-new-oil-and-gas-leases-permits-on-federal-lands-on-hold-for-60-days?ite=155993&ito=1450&itq=4a065681-aebb-45cf-ae5f-b2e24bcabcb0&itx%5bidio%5d=2133084875
Greenbub and Shallow : Thanks for clarifying, and for the link. I guess I’m a little unclear then as to what a permit ban is if it isn’t a ban on the granting of drilling permits.
As I read through the link more carefully, they seem to be using the words “lease” and “permit” to mean the same thing.
Hah,, came across an AP article on the same topic, and they interpret the permit portion of the ban to mean a ban on drilling permits, with an exception that senior officials may grant certain drilling permits.
https://apnews.com/article/joe-biden-billings-a3a37acf2fce55449b704b01badc1f67
SouthLaGeo,
I have a subtly different interpretation of the AP article, they say new drilling permits will not be issued for 60 days, existing drilling permits can still be acted on. They also suggest many drilling permits were issued prior to Jan 20 so that most companies have a large stockpile of permits to drill new wells. This action was anticipated so companies had time to act in advance. Essentially the action is symbolic, it will affect drilling of new wells for the next 60 days very little (probably not at all).
As to what happens next, it seems this could be used as a negotiating tool for a carbon tax or cap and trade type legislative deal. We will have to see what course forward the moderates in the Senate come up with. It would be nice to see the centrists step up and take the lead.
We need regulations. We need the regulations to make sense. We need the regulations to be enforceable. We need enough staff to enforce the regulations.
I hope it is understood how many people must be hired and trained to strictly and fairly regulate over one million oil and gas wells spread across the United States (including Alaska) plus GOM, CA, etc.
It is taking the DOE staff about 3 years to study methane emissions from wells and facilities. The interim report studied 223 wells. The final report will have studied less than 1000 wells. So, there will need to be a major effort made to do regulation of methane properly, as there is presently nothing in place to regulate this.
Big concern is always that most of the regulatory burden is put on the operators, the good operators self regulate, the good operator data is filed away and never reviewed due to lack of manpower at the regulatory agency, the bad operators do nothing and less than 5% face any consequences.
We file many reports annually already. Many involve injection and disposal of produced salt water. There have been times where we were asked not to file annual reports that are required, because the agency didn’t have the manpower to even properly file the reports. We filed them anyway, as the regulations were not amended. We didn’t think some manager could just unilaterally verbally amend the regulations. Of course they cannot.
I suspect this is common in all areas of regulation. I have a friend who is a CPA. He does hundreds of income tax returns a year. He says hasn’t had a client audited in over 10 years.
Better make sure you can enforce the law before you make it a law.
SS you remarked “We need regulations. We need the regulations to make sense. ” . Absolutely correct . The basic rule is ” Laws must not only be legal but also legitimate ” — Venice Commission of the EU .
Shallow sand,
Many laws are enforced randomly, speeding tickets are an obvious example.
Ours is not a perfect world. Some people do the right thing, some get away with whatever they can, most are somewhere between these poles. That’s just the way it is, some things will never change…
A new thread for Non-OPEC Production has been posted.
http://peakoilbarrel.com/non-opec-september-oil-production-flat/
A new thread for Non-Petroleum comments has been posted.
http://peakoilbarrel.com/open-thread-non-petroleum-january-22-2020/