The JODI Oil World Database came out a few days ago. The data is through December 2015. The JODI C+C production numbers differs somewhat from the EIA numbers. The JODI OPEC numbers are crude. Also there are a few very small producers that do not report to JODI so their numbers will be slightly less than the EIA. But otherwise they are pretty accurate.
Also, JODI, for some reason, does not count all of Canada’s oil sands production. So for Canada I use Canada’s National Energy Board numbers instead.
The JODI C+C numbers, for Non-OPEC, will average about 2.4 million barrels per day less than the EIA. This is largely due to some countries not reporting to JODI. But these countries only have small changes in their overall production so would have little effect on any of my charts or calculations.
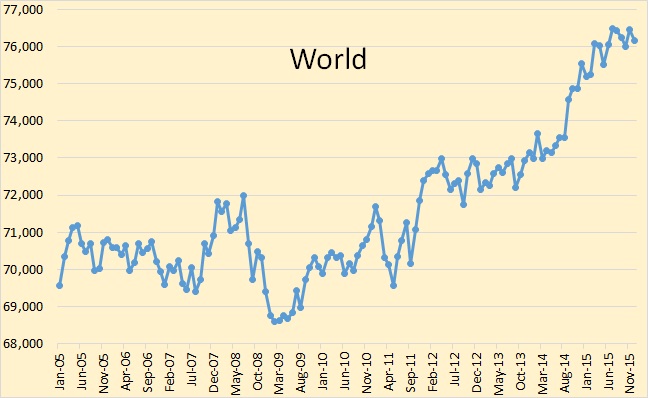
According to JODI, world crude oil production peaked, so far, in July and has declined by 339,000 barrels per day.
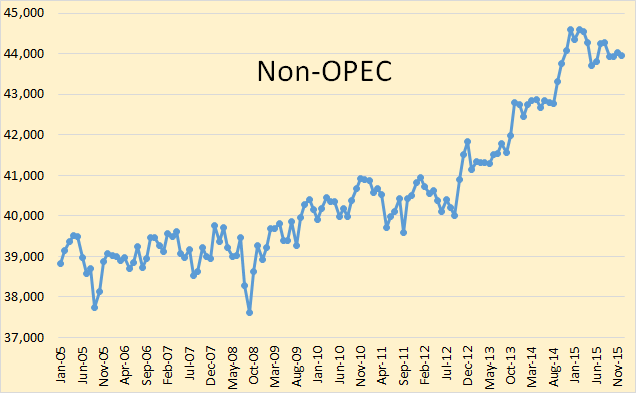
The recent price collapse has had a greater effect on Non-OPEC production than OPEC production. Non-OPEC production peaked, so far, in December 2014 and in December 2015 stood at 650,000 bpd below that peak.
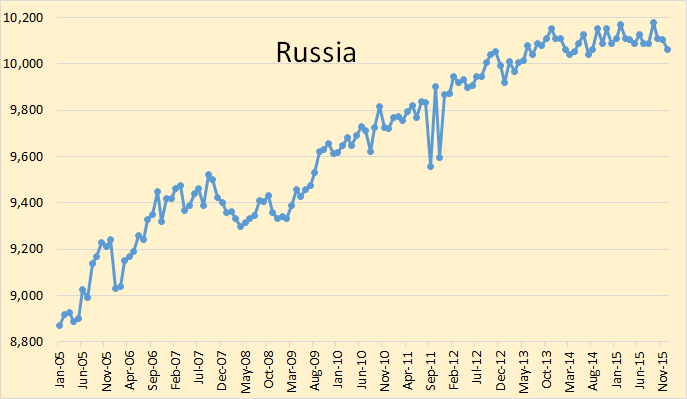
No discussion of Non-OPEC production would be complete without Russia, Non-OPEC’s largest producer. I would never claim, just by looking at the chart, that Russia is peaking, or has peaked. But there have been reports coming out of Russia for over two years now that Russia is peaking. Some of those reports like this one Global and Russian Energy Outlook to 2040 have been reported on this blog. I think the charts lend strong credence to those reports.
Note: Russian data, prior to 2012, is from the EIA. Beginning January 2012, JODI changed its Russian reporting methods but did not change its historical data, showing a huge decline in production beginning in 2012. So for more accurate historical data prior to 2012, EIA data is used.
But, by far the largest gains in Non-OPEC production has come from the USA and Canada.
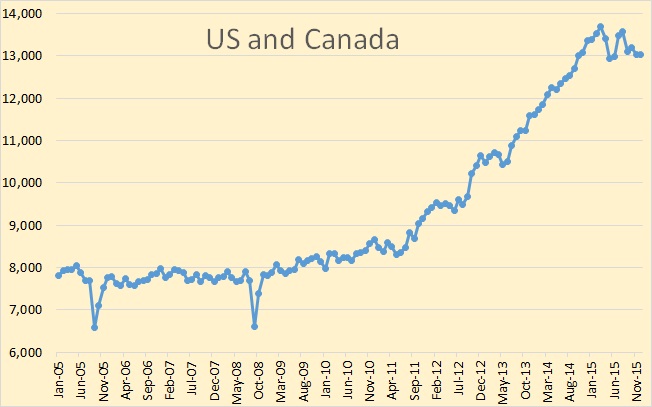
Notice how close a chart of US and Canadian production resembles a chart of Non-OPEC production itself. In fact….
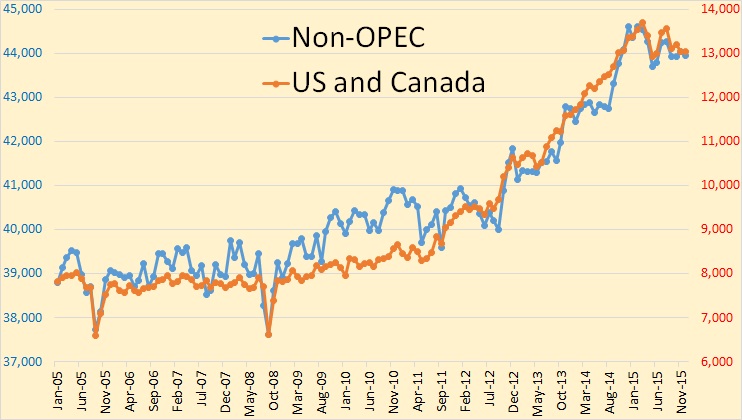
I think this chart is amazing. Non-OPEC, left axis and US + Canada, right axis. There is 31,000,000 bpd difference in the scale but the difference in the scale lines for both axis is exactly the same, 1,000,000 bpd per line. From January 2005 until December 2015, all Non-OPEC was up 5,144,000 barrels per day. During that same period US + Canada was up 5,222,000 bpd, meaning during that 11 year period, Non-OPEC less US and Canada, actually declined 78,000 bpd.
That number, -78,000 bpd, is even more remarkable due to the fact that this includes Russia, who’s production during those 11 years was up 1,192,000 barrels per day.
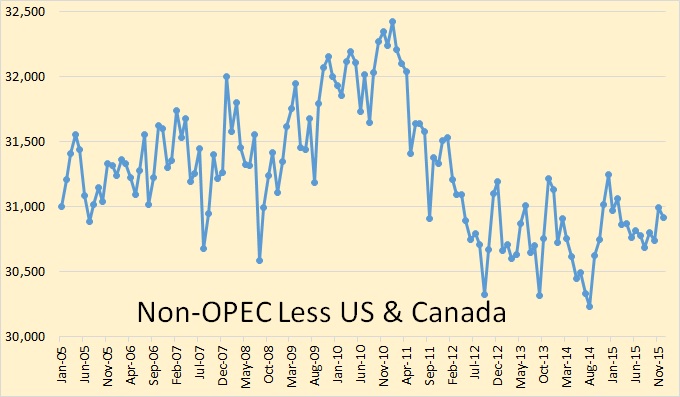
Here is a chart of Non-OPEC less US and Canada. Notice that the first point on the chart, January 2005, sits right on the 31,000,000 bpd line and ends up, on December 2015, at just below that point.
Non-OPEC less US and Canada peaked in January 2011 and in December 2015 had declined almost exactly 1.5 million barrels per day from that point.
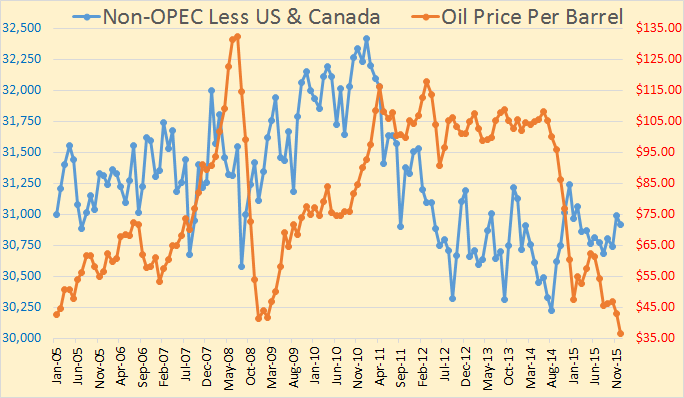
Non-OPEC production did not drop because of the price, it dropped despite the fact that world oil prices averaged $105 per barrel for most of that period. That is not to say that the price of oil played no part in production levels during that time. They almost certainly did. It is likely that production would have fallen much further had not oil prices been so high.
There is no question that Non-OPEC, less US and Canada, peaked in January 2011. Rising prices brought with it rising production. Production, during that six year period from January 2005 to January 2011 rose just under 1.5 million barrels per day among Non-OPEC nations less US and Canada. And just where did that increase come from?
The two charts below show production change. Countries with little or no change are not shown.
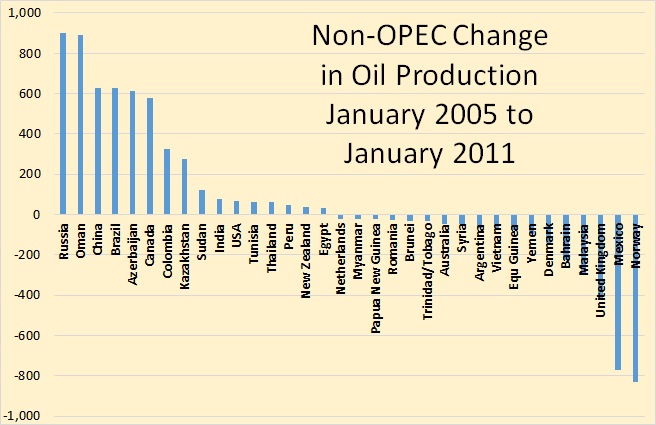
During that six year period Non-OPEC production increase came primarily from Russia, Oman, China, Brazil, Azerbaijan and Canada. USA was just one of the also rans during this period. The big declines in Non-OPEC production, during this period, came primarily from the North Sea and Mexico.
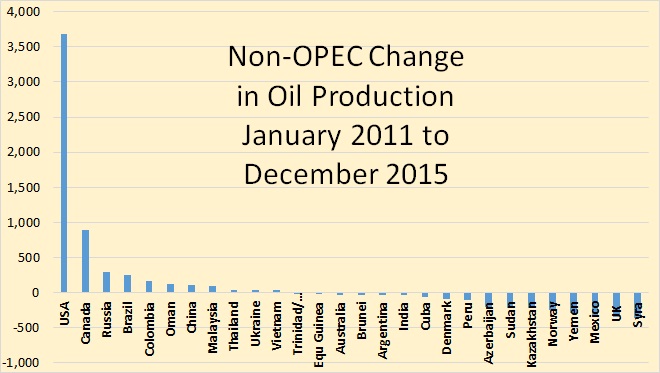
The above chart shows what happened to Non-OPEC production during the longest period of very high oil prices in history.
This chart shows the change from the peak in January 2011 to December 2015 of Non-OPEC countries less USA and Canada. Notice the minor roles Russia, Brazil, Colombia, Oman and China played in the last five years. Their increase in production is outweighed by those on the declining side of production.
$105 oil was not able to sustain their growth but it was, very likely, able to slow the decline of some of those nations.
Conclusion
Non-OPEC oil production, less US and Canada, will continue to decline. That decline will now be accelerated due to cancelled projects brought on by very low oil prices. The oil production from US and Canada will also now begin to decline. The decline from Canada will be slight, if any, but there will definitely be much slower growth in Canadian oil production. The decline US crude oil production will be significant.
The decline in total Non-OPEC crude plus condensate production, that begun in mid 2015, will continue at a slightly accelerated pace. Prices, high enough to make a significant difference, will not likely return until at least mid 2017. Then, beginning in 2018, growth in US production will likely return but at a much slower rate than in previous years.
OPEC is a different story. Iran will, very likely, increase production by about 600,000 barrels per day over the next 12 to 18 months. Iraq may increase production slightly but not nearly as much as Iran. And any increase in Iraqi production will be erratic. And Iraq still has a strong potential for political disruption. The rest of OPEC will show a decline in crude oil production. And any total increase in OPEC production will not be nearly enough to offset the decline in Non-OPEC production.
2015 will be the year world production of crude oil peaked. The return of higher oil prices, whether later this year or further in the future, will not bring production back to the 2015 level.
396 responses to “Oil Price And Its Effect On Production”
Thanks for the post, Ron.
Below is an article from Bloomberg:
Biggest Wave Yet of U.S. Oil Defaults Looms as Bust Intensifies
http://www.bloomberg.com/news/articles/2016-02-25/biggest-wave-yet-of-u-s-oil-defaults-looms-as-bust-intensifies
• SandRidge, Energy XXI missed interest payments due Feb. 16
• Face $7.6 billion default if interest isn’t paid by mid-March
In less than a month, the U.S. oil bust could claim two of its biggest victims yet.
Energy XXI Ltd. and SandRidge Energy Inc., oil and gas drillers with a combined $7.6 billion of debt, didn’t pay interest on their bonds last week. They have until the middle of next month to either pay the interest, work out a deal with their creditors or face a default that could tip them into bankruptcy.
If the two companies fail in March, it would be the biggest cluster of oil and gas defaults in a month since energy prices plunged in early 2015.
“We’re just beginning to see how bad 2016 is going to be,” said Becky Roof, managing director for turnaround and restructuring with consulting firm AlixPartners.
The U.S. shale boom was fueled by junk debt. Companies spent more on drilling than they earned selling oil and gas, plugging the difference with other peoples’ money. Drillers piled up a staggering $237 billion of borrowings at the end of September, according to data compiled on the 61 companies in the Bloomberg Intelligence index of North American independent oil and gas producers. Oil prices have now fallen more than 70 percent from a 2014 peak, and banks and bondholders are fighting for scraps. U.S. high yield energy debt lost 24 percent last year, the biggest fall since 2008, according to Bank of America Merrill Lynch U.S. High Yield Indexes.
Both Energy XXI and SandRidge could still reach an agreement with creditors that will give them time to turn their businesses around. SandRidge said last week that it missed a $21.7 million interest payment. The company owes $4.2 billion, including a fully-drawn $500 million credit line. Energy XXI, which owes $3.4 billion, said in a filing last week that it missed an $8.8 million interest payment.
David Kimmel, a spokesman for SandRidge, said it has the money to make interest payments due in February, March and April. He wouldn’t comment on SandRidge’s options if it doesn’t make the interest payments by the end of the grace period.
The companies’ failing to pay interest on their bonds may be a way to help motivate creditors to renegotiate debt, said Jason Wangler, an energy analyst with Wunderlich Securities in Houston.
“It’s a negotiating tool,” Wangler said. “They say, ’I’m not going to pay you. Now what are you going to do?’”
Energy XXI owes $150 million to banks including Royal Bank of Scotland Group Plc, UBS Group AG and BNP Paribas SA, among others. SandRidge has fully drawn its credit line with banks including Barclays Plc, Royal Bank of Canada and Morgan Stanley, according to data compiled by Bloomberg.
SandRidge is likely to file for bankruptcy, analysts at junk bond research firm KDP Investment Advisors Inc. wrote in a report last week. S&P wrote in a separate report that Energy XXI is probably going to file. Since the start of 2015, 48 North American oil and gas producers have gone bankrupt with a total of $17.3 billion in debt, according to law firm Haynes and Boone. The largest was Samson Resources Corp., which entered Chapter 11 in September owing more than $4 billion.
Others are probably coming. The number of U.S. companies that have the highest risk of defaulting on their debt is nearing a peak not seen since the height of the financial crisis, according to a report by Moody’s Investors Service earlier this month. The oil and gas sector took up the biggest share, accounting for 28 percent, or 74 borrowers.
Most of the shale industry’s debt is in the form of bonds, according to data compiled for the Bloomberg Intelligence index. Of those $197 billion of securities, $101 billion is junk-rated.
Bond investors aren’t likely to recover much money from oil and gas companies that default. Standard & Poor’s estimates, for example, that Energy XXI’s and SandRidge’s unsecured noteholders will receive, at most, 10 cents on the dollar.
Banks are setting aside more money to cover potential losses on souring energy loans. S&P estimates that credit lines to these companies could be cut by 30 percent by April, when banks conduct one of their twice-yearly evaluations of their loans.
“We are at the very beginning of the next wave of energy defaults,” said Paul Halpern, chief investment officer at Versa Capital Management, which manages about $1.5 billion of distressed debt.
Also from Bloomberg:
Oil Slump May Hit U.S. Investment Banks’ Capital Market Revenue
http://www.bloomberg.com/news/articles/2016-02-25/oil-slump-may-hit-u-s-investment-banks-capital-market-revenue
Revenue generated by U.S. investment banks through their capital markets businesses may “suffer” if oil and commodity prices stay low and the global economy slows further, Moody’s Investors Service has warned.
While direct energy loan exposures for the largest U.S. banks look “manageable relative to earnings” and most of their exposures are to investment-grade borrowers, additional loss provisions will be necessary in some cases should oil remain subdued for an extended period, the credit assessor said in a report dated Feb. 24. Moody’s also warned that “lower-for-longer” oil prices presented a rising threat for lenders around the world.
JPMorgan Chase & Co. said this week its reserves for impaired energy loans would increase by about $500 million in the first quarter and it would have to add an additional $1.5 billion to the set-aside if oil prices held at $25 a barrel for about 18 months. Wells Fargo & Co., the world’s largest bank by market value, said Wednesday in a filing soured energy loans climbed 49 percent in the last three months of 2015, while higher oil-and-gas provisions at Royal Bank of Canada crimped quarterly earnings.
“Oil price volatility has contributed to increased market volatility, which could help boost trading activity and returns,” Moody’s said. “However, current weak sentiment in global equity and credit markets could work in the opposite direction, reducing trading volumes and banks’ related revenues.”
For U.S. global investment banks such as Bank of America Corp., Citigroup Inc. and JPMorgan Chase, funded exposures to the oil and gas industry range from 1.5 percent to 5 percent and average 2.3 percent of total loans, according to Moody’s. The ratings company also underscored risks for banks in energy-exporting regions from the Middle East and Russia to Africa and Latin America.
“Banks’ direct and indirect exposures to the drop in oil prices pose the potential for deterioration in asset quality, particularly in net oil-exporting countries,” Moody’s said. “While direct exposures appear broadly manageable from both a solvency and earnings perspective, low oil prices could still test the credit profiles of banks across our global rated portfolio.”
Another article from Bloomberg:
Goldman Sachs Says 40% of Its Oil, Gas Lending to Junk Firms
http://www.bloomberg.com/news/articles/2016-02-22/goldman-sachs-says-40-of-lending-to-oil-and-gas-firms-is-junk
Goldman Sachs Group Inc. said about 40 percent of its oil and gas loans and lending commitments are to junk-rated firms.
The figure, which counts both loans made and future promises to lend, accounted for $4.2 billion of a total $10.6 billion as of the end of December, the New York-based bank said Monday in its annual regulatory filing. Goldman Sachs has $1.5 billion in loans to energy companies rated below investment grade and $2.7 billion in unfunded commitments.
The total exposure jumps $1.9 billion counting derivatives and other receivables, which were “primarily” to investment-grade firms, Goldman Sachs said. The bank’s market exposure to oil and gas firms was negative $677 million compared with $805 million a year earlier.
Goldman Sachs’s total is less than of its biggest competitors. Citigroup Inc.’s funded and unfunded commitments amounted to $58 billion, analysts at Susquehanna Financial Group LLP wrote in a note last week. Most of Wells Fargo & Co.’s $17 billion in outstanding energy loans is for companies that aren’t investment grade, Chief Financial Officer John Shrewsberry said last month.
Those bonds must be cumulative mustn’t they – i.e. rolled over each year. Otherwise that is about $1.3 trillion total. At (say) 5,000,000 bpd for 7 years at as high as $100 per barrel the companies would only be getting $1.25 trillion total. Or am I missing something.
Yes, I also think this is cumulative. Total amount of junk oil & gas bonds seems to be around $260 bn
Even so at current prices that is probably over 70% of all the money those companies are going to be able to take in from oil production.
I’m going to predict a lot of bankruptcies in late 2017 as oil prices start to rise because the lender’s will suddenly see a lot more money in taking over the resource base than by keeping the bond’s rolling over.
George,
The total debt due over the next year is not cumulative, but the above numbers come due each year. The cumulative debt stands at around 1.2 trillion. See:
http://www.wallstreetdaily.com/2015/06/13/u-s-shale-producers-debt/
In this article it states:
….Credit analysts at UBS say there are $1.2 trillion outstanding in loans to the U.S. oil industry! A third of this debt is owed by exploration and production companies. And UBS predicts the default rate on these loans could end up being in the low-teens…..
The oil industry also includes pipelines and infrastructure, refineries ……
In the above diagram it is also clearly stated:
The amount of bonds US energy companies below investment grade need to pay back each year….
So, it is clear that the total amount of debt maturing over the next 7 years stands at 1.2 trillion.
“Credit analysts at UBS say there are $1.2 trillion outstanding in loans to the U.S. oil industry! A third of this debt is owed by exploration and production companies”
I think $1.2 trillion is total debt owed by the US oil and gas industry, not just loans.
1/3 of $1.2 trillion = $400 billion owed by the E&P companies.
This includes bonds and bank loans.
Bonds include junk bonds and investment grade bonds.
So $260 billion in junk bonds is the right number.
Besides, I have seen in various sources a similar number
Heinrich – I think I agree with Alex. The caption is wrong in the “per year” bit, but correct in “below investment grade” – that is junk, which is not the total debt to the oil industry by a long way (let’s hope).
If I were a betting man I would bet with Ron on 2015 being the year of peak crude.
But gas production seems likely to increase for some time yet.
Does anybody have a good estimate of the percentage of all gas produced which is produced from oil wells?
Declining production of oil from legacy oil fields is going to drag down gas production to some extent.
AKA as Peak Crude + Condensate (C+C).
As I have noted about a zillion times, when we ask for the price of oil, we get the price of actual crude oil, most frequently WTI or Brent with average API Gravities in the high 30’s (and the maximum API Gravity for WTI crude is 42 API Gravity), but when we ask for the volume of oil, we get some combination of actual crude oil + partial substitutes–condensate, natural gas liquids (NGL) and biofuels. And of course, condensate and NGL are byproducts of natural gas production.
Mr. Brown – Do you understand how this works specifically in Iran (e.g. ratio of crude to condensate in their production and exports)? I think their biggest ‘oil’ field is actually South Pars condensate, and they were looking for western investment to complete the development of this – not for new crude oil fields. I think a lot of their cars run on LPG as they have so much light liquids available. They use all the gas they produce, so the condensate and NGLs are in some respects zero cost for export, if they have excess.
I’m afraid I’m not anywhere close to being an expert on Iranian consumption and production, but according to Iranian sources I believe that they claimed that the bulk of their floating offshore storage was condensate and fuel oil, not crude oil.
I’m concerned bout all this Carnage of The Big Easy. Oil Rush like a Gold Rush ?? Significant amounts of North American mind-boggling current flowrates are from concentrated Sweetspots “nuggets”. As these pockets of Shallow/Easy/Lower cost resource tap out , Sections of North American HC production landscape may be like well well .. Oil City, Pa. HISTORY BABY.
Yes, OFM, I also shared Ron’s opinion by late 2014 that 2015 was going to be the year of Peak Oil.
But this is now a fact. Summer of 2015 (July for C+C, August for all liquids) is a peak oil for everybody for as long as production doesn’t start increasing again. Since nobody is predicting an increase in production for 2016, the most fundamental issue in the oil world right now is how fast is production going to fall and for how long.
My level of knowledge in the oil world is too low, but from what I have seen in this blog we might be seeing a loss of 1 to 1.5 mbpd in 2016, depending on how much Iran is able to increase production.
On the other hand people usually talk about a level of annual depletion of around 6%. That’s about 4.5 mbpd for the entire world, so if only half of the world depletes at those rates we are talking upwards of a fall of 2 mbpd.
I guess then between 1 and 2 mbpd defines the possible loss of oil production in 2016. Is this a reasonable estimate?
Hi Javier,
At one point that seemed reasonable to me.
What I was missing was the various projects that are coming online over the next few years, these are large projects that have recently started production and are in the process of ramping up or projects that have been sanctioned by major IOCs or NOCs and will start producing in 2016 or 2017. This has been repeatedly pointed out to me by AlexS and it has now started to sink in. So from now until late 2017 the declines will be offset to some degree by these new projects that have not been deferred.
My guess is that decline in 2016 will be 500 kb/d and this will moderate as the oil market begins to balance in 2017 and oil prices start to rise. The various projects that have been cancelled will start to affect output in 2018, whether prices rise enough (to $80/b) by then so that LTO investment restarts to keep supply up remains to be seen, but if the supply shortfall causes a rapid drop in oil in storage we will quickly see oil prices rise to $100/b and LTO will ramp up output and the long term projects will be sanctioned (those that were earlier deferred) and that output will hit 2 or 3 years later (2020 to 2021). After that it is hard to see what happens, it will depend on oil prices and consumer demand for oil, both of which are hard to predict 5 years in the future.
Dennis, you talk about:
“the various projects that are coming online over the next few years, these are large projects that have recently started production and are in the process of ramping up or projects that have been sanctioned by major IOCs or NOCs and will start producing in 2016 or 2017.”
Hasn’t this always been the case? The new decline should be on top of the new exploits as these are built into the increasing rate of production for the last decades, that without new exploits being brought on line every year would have not taken place.
I do not think that the existence of new developments should affect the rate of decline (only the lack of new developments). We have seen 0.6 mbpd lost since last summer and the situation is getting worse, not better. I find it hard to believe that we are going to lose less than 1 mbpd in 2016, although obviously I could be wrong on this.
If “we” is global C+C+NGLs production, you are certainly wrong.
I think that even non-OPEC production will drop by slightly less than 1 mb/d. And OPEC will increase thanks to Iran.
I was thinking C+C, but yes, I might be wrong. I will be watching first quarter production data, although it is possible that the decline is front loaded with the gains coming later in the year.
Thanks for your opinion.
Hi Javier,
To take account of seasonal changes I think it best to look at centered 12 month averages to see the true trend.
Chart below shows EIA World C+C monthly data and centered 12 month average. I am not too concerned with month to month fluctuations. The chart shows the start of a plateau.
Dennis, your chart ends halfway through 2015. We are two months into 2016. Have you any idea what has happened to production since mid 2015? Hint: It is not a plateau.
Hi Ron,
Monthly data goes to Oct 2015, the centered 12 month average (the center of the most recent 12 months) is May 2015, where the blue line ends.
The 12 month average of World C+C is on a plateau, based on EIA data.
Dennis,
Averages are always behind changes. A 12 month average is 6 months behind the data (10 months behind present).
To say that an average is plateauing with only 5 points for 2015 all of which are higher than the previous means you are not using the average data for that conclusion. You are projecting your preconceptions.
You can only see a decline on monthly data. A plateau on quarterly data. And growth on yearly data or 12 month average.
Any other conclusion is not based on data.
The best way to see what is happening on real time is year on year rate of change.
Hi Javier,
You are correct. It does look like the growth in output has slowed for 12 month data and may be the start of a plateau. The monthly decline may just be noise. YOY monthly data is also noisy, yes trend changes cannot be determined in real time IMO. Monthly data fluctuates a lot so basing predictions on the last 3 or 6 months of data will lead to many false predictions.
“But gas production seems likely to increase for some time yet. ”
Yes, it does. I’ve been trying to predict the natgas market for a while with no luck. It’s quite… complicated. The coal and oil markets are much, much simpler and as a result much easier to predict.
I’d love to see a solid natgas model. There are three main uses for natgas: industrial feedstock, electrical generation, and residential heating & cooking, plus a transportation niche.
— For industrial feedstock natgas competes with petroleum and biological feedstocks
— For elecrtrical generation natgas competes with coal and renewables
— For residential natgas competes with electricity
— For transportation natgas competes with petroleum and electricity
There are four main classes of sources: side effects of oil wells, independent “normal” gas wells, shale and other tight gas, and biogas.
— The side effect of oil wells — wells where the main profit comes from oil, or condensates, or other liquids, and the gas is a “bonus” — has always been the main source, and the cheapest.
— Independent “normal” gas wells such as the North Sea wells exist on their own with the main profit coming from the sale of gas
— Tight gas (without oil) has never been profitable, and requires very high gas prices to be truly profitable, but was produced in large quantities anyway as part of land-flipping scams by the fracking companies.
— Biogas is always converted to power for some reason (avoiding purification I suppose) and doesn’t affect the other markets.
Anyway, that is four potential sources of demand-side moves and four potential sources of supply-side moves. I’ve been unable to figure out the result of them all interacting; it’s hard to figure out which effects dominate.
If Oil prices remain low 2015 will be the peak.
I doubt oil prices will remain low after 2018.
When the oil price rises we will return to 2015 output levels or higher by 2022 to 2025.
Final peak between 2020 and 2030.
”When the oil price rises we will return to 2015 output levels or higher by 2022 to 2025.”
What oil price will that require?
”Final peak between 2020 and 2030.”
And where are the discoveries that will allow for that?
I think this is just Dennis’s gut feeling. 😉
Hi Ron,
No it is based on my estimate of available resources using Hubbert linearization for World C+C less extra heavy and the mean estimate by the USGS and then adding 600 Gb from Canadian and Venezuelan Oil sands (modelled separately because these resources are developed more slowly). The demand model is based on about 2%/year real GDP growth for the World and a correlation of oil demand with real GDP from 1997 to 2014. The supply model which will satisfy that demand (taking account of inventory drawdown) is shown in the model below.
Models work better on simulated worlds.
I can’t help but notice that your predicted annual decline rate for 2015-2018 is the lowest on record.
Hi Javier,
No, look at the chart, the decline has been negative (an increase) over many periods in the past (all the spaces where I don’t show the negative data from 1970 to 2014.)
Look at 2009 to 2015, that is real data not a model, what are you talking about? The annual decline rate is this year’s output divided by last year’s output minus one (then presented as a percentage). It is different from the average decline rate of an individual well.
Dennis,
I am talking about the annual decline rate (red dots) between 2016 and 2019 showing a peak that is lower than any previous peak of decline rate (red dots) shown in your graph.
I interpret that as you thinking that the decline rate for 2016-2019 being lower than those at 1975, 1980-83, 1999, 2001 and 2009. That looks not very credible.
I think that the decline rate for 2016-19 could be as big or bigger than that at 1980-83. Your model is a very best scenario with almost no decline in production.
Hi Javier,
The temporary ups and downs are difficult to predict, the very big declines were due to the Arab oil embargo in 1974 and the Iran/Iraq War and Iranian revolution from 1979 to 1984.
Perhaps you can predict such events in advance?
The future scenario can be thought of as a trendline, there will be events that will cause output to bump above and below this trendline.
The chart below shows the annual decline rate of the 3 year centered average which smooths out some of the noise. A sharp temporary decline could occur from a major war in the Middle East (between Sunni and Shia nations perhaps), but I cannot predict if or when such an event might occur. Tell me when it will happen and I can model it. 🙂
Well, Dennis,
I can predict that the decline rate between 2016-2018 is going to be bigger than any previous decline since 1985. The reason is clear, the situation of the producers is a lot worse than anytime since the big glut of the early 80’s. Much worse than at any economical crisis of 1985-2015 that affected production through reduced consumption.
Therefore I can predict that your model does not predict what is going to happen.
Hi Javier,
As I said, events such as the GFC(2009), US Iraq war(2001-2002), the Asian financial crisis in 1999, or the S+L crisis in the US in 1985 are difficult to predict in advance. Those are the instances where the decline was temporarily (one year in almost every case) higher than my scenario for 2016 to 2018. In fact it would be very easy to adjust the model so there was a one year decline that was a little higher, see chart below.
Note that the last big oil glut was in 1998 to 1999 when the real price of oil dropped to $17.65/b for the year in 1998. I will let Shallow sand comment as to whether that was worse than the recent price down turn, probably yes because prices started at $30/b in that case.
I am less confident than you about my ability to foresee the future, time wil tell us how clairvoyant you are.
The decline in 2016 is in the middle of the level of the 6 previous small decline episodes from 1983 to 2015.
I don’t claim to be able to precisely know what output will be in the future, I expect the decline in 2016 to be relatively minor.
Hi Javier,
Below is a model that has extraction rates decrease in a similar proportion t0 1979 to 1983 and then level off for a time and then increase as they did from 1984 to 2015. Note that the only plausible scenario for that big a decline is a major war between Shia and Sunni nations in the middle east.
I don’t think that is very likely, your view may differ. The global financial crisis resulted in a very minor change in output in comparison.
Not just discovery shortages, but the oil industry will have a severally compromised development capacity. It could barely overcome decline rates for conventional oil over the past 10 years, the LTO got developed at a loss, and about 30 to 40% of the industry is currently being laid off or shut down. There is no way it will be able to ramp up to about 150% of the capacity it had say in 2013 to overcome accelerating decline rates and add production on what will be ever more complex new fields (i.e. small,heavy, deep water etc.)
George,
Not just discovery shortages, but the oil industry will have a severally compromised development capacity. It could barely overcome decline rates for conventional oil over the past 10 years
And please note the growing share of condensate in the total volume of produced C+C. That’s only around 88% of energy of traditional oil. Volume based accounting just masks the deteriorating quality of production.
The last card that can be played is probably Arctic oil. Everything else is already on the table.
As Art Berman aptly said “Shale is not a revolution, it’s a retirement party”.
http://www.energypost.eu/interview-arthur-berman-shale-revolution-retirement-party/
So it was mainly about “free money” and the government (and EIA) dubious role of a cheerleader, which created incentives for the companies to drill at a loss while racking up debt, enriching the management and E&P subcontractors. All of which is depressingly similar to the subprime boom. In both cases the expectations were that the price will rise indefinitely. And the role of the financial industry is identical, but on somewhat smaller scale.
Also it looks like mankind is now close or past “peak energy” which is a larger problem then “peak oil”. I wonder what is the current EROEI of shale oil at wellhead. Some sources claim that “The EROEI for tar-sands oil is ~5. The EROEI for shale oil is ~3.” http://www.roperld.com/science/minerals/EROEIFossilFuels.htm
If so that’s explain the current level of debt of shale companies.
In any case, the US shale revolution more and more looks like the “The Last Hurrah.”
The Arctic is 15 years away at least from any real oil production. What’s been found so far is mostly gas/condensate. To be develop each area needs a giant anchor field – none of which has so far been found. The most likely geology for oil is under the permanent thick ice north of Greenland and nobody really knows if its there. The continual squeezing and release of the rock from ice ages might have fractured everything beyond what is normally seen.
I dont know much about Greenland geólogy, but I have studied rocks which underwent periodic ice loading, they don’t fracture, the rock simply loses porosity a bit. My teacher in this area was Dr Maurice Dussault, check with him if you ever have questions about this subject.
Should have said faulted. Too much thinking about shale oil.
I think the roperld site means “oil from kerogen containing rock commonly called `oil shale’” when they say “shale oil”,
not “light tight oil from a shale-ish source rock”.
Kerogen shale must be cooked into oil, so I can believe the EROEI of about 3 or so.
LTO (light tight oil) would seem to be better than that, no cooking needed (only fracking and pumping).
https://www.eia.gov/dnav/pet/pet_cons_821dsta_dcu_nus_a.htm
gives annual distillate fuel oil by end use through 2014.
62 billion gallons in 2014 total, 2.1 billion “oil company”.
Though one wonders how much “on-highway” is used for drilling, etc.
https://www.eia.gov/dnav/pet/pet_cons_821dsta_dcu_SND_a.htm
gives data just for North Dakota.
2009 total 422 million gals, 2014 1.11 billion gals
2009 oil company 24 million gals, 2014 337 million gals – big jump
2009 on-highway 195 million gals, 2014 418 million gals
2009 off-highway 29 million gals, 2014 54 million gals
2009 railroad 15 million gals, 2014 73 million gals.
So for 2014, 300 + 200 + 20 + 60 = 580 million I assume went to LTO drilling/pad prep/pipeline construction/hauling.
In round numbers, say a million bpd of LTO (ignoring conventional in ND) x 365 days/year x 42 gals/barrel is 15.3 billion gallons of LTO, divided by 580 million is EROEI of (very roughly) 26.
Refining, use of natural gas in GOSP (gas/oil separation plants), pipeline stations, etc. etc. not included, so maybe the real EROEI is mid-to-high teens or very low 20’s.
Way better than 3, but hardly comforting.
An Art Berman video on shale plays is at:
http://www.artberman.com/art-berman-shale-plays-have-years-not-decades-of-reserves-february-23-2015/
He also has the PDF of the slides at:
http://www.artberman.com/wp-content/uploads/HGS-NA-Presentation-23-Feb-2015.pdf
Well worth the view/read, as is the rest of the stuff on his site.
Hi Rune,
Most of the oil will come from resources already discovered as higher prices move probable and possible reserves to the proved category and as contingent resources move into the reserves category.
An oil price (all prices in 2015$) of $100/b in 2018 increasing to $125/b by 2024 should be enough to get oil supply higher.
Dennis,
This shows GoM fields bought on line last year:
https://www.eia.gov/todayinenergy/detail.cfm?id=25012
All but one discovered 2009 to 2013. Then check what other discoveries have been made since 2010 that might be waiting in the wings. The only places there are significant known discoveries waiting to go are Canada and, who knows, Venezuela. Tar sands are very long term projects and would need two years stable high prices before being considered and quite likely some guarantees about new pipelines. The expensive offshore oil that might suddenly be profitable as prices rise will mostly be in small pockets, and therefore of limited impact.
Hi George,
My model assumes very little discovery, there is a lot of oil that has been discovered but not developed, high oil prices will lead to development.
I agree not a lot more oil will be discovered, perhaps 200 Gb after 2010 (Jean Laherrere’s estimate). There will be reserve growth (or an increase in the estimates of proved plus probable reserves) over time.
In the US from 1980 to 2005 reserve growth was about 63% of 1980 2P reserves, based on EIA data and assuming probable reserves are about 70% of proven reserves ( an estimate based on UK North sea data ).
Dennis – Reserve growth has happened mostly on large conventional fields. There aren’t any more of these. It also happens mostly in the early years after discovery. You can’t apply the same growth expectations to any new field. A lot of deep water finds haven’t lived up to expectations. Growth also mostly happens because of drilling in the area around the earlier discovery (e.g. in neighbouring fault blocks or possible traps in similar geology) – i.e. it doesn’t look much different to wildcat exploration. It doesn’t just happen that a any producing field suddenly makes more oil than was originally expected.
Hi George,
The US lower 48 onshore was pretty mature in 1980, there are plenty of places around the World at the same level of maturity today as the US was in 1980, there will be reserve growth in these areas. Russia and the Middle East and perhaps China will see some reserve growth. Do you expect there will be no reserve growth? That seems unrealistic in my opinion.
There will be reserve growth, but not as much as on old, large reservoirs and at greater risk and cost. Imagine you had a 1 billion reservoir on shore, you think there is probable oil around it. You understand the geology quite well. Drilling around a bit and you get another 200 million and it takes a few more wells to tie back to your production system. Now you have a new deep water reservoir. There is only 300 million barrels. There might be another 50 around it or under it. But drilling wells costs 20 times as much as onshore, the risk of not finding anything is triple, to develop the field will cost a few more wells (all 20 times as expensive as on shore) plus a new subsea template, risers and umbilical; and the final reward is only a quarter. Do you go ahead and look, and if not now how high does the price have to be before you do and how certain do you have to be that the price will stay high. And suppose it’s not 50 in one place but two 25s – not far short of twice the cost to find and develop – what then.
Hi George,
I am not proposing that reserve growth will be as big as in the US. Consider the following scenario, there were about 850 Gb of 2P reserves at the end of 2010 in the world based on the work of Jean Laherrere. He also estimates there will be about 250 Gb of discoveries added in the future. At the end of 2010 there were about 1100 Gb of C+C less extra heavy oil produced. Let’s assume for the World reserves also grow by 63%,but it takes 90 years for reserves to grow this much (rather than 25 years as was the case for the US). That would be about 535 Gb of reserve growth and total URR would be 2700 Gb, we would need to assume 70% reserve growth over 100 years (to 2110) to get the medium URR I use of 2800 Gb if we assume only 250 Gb of discoveries after 2010.
Note that the 2800 Gb estimate is the average of a Hubbert Linearization (2500 Gb) and the USGS estimate of 3100 Gb.
Dennis maybe I´m nitpicking, but higher prices will not move probable and possible reserves to proven reserves. They only represent uncertainties in the geology. Contingent resources can be moved to reserves though.
Also the amount of oil discovered has decreased this decade even with record high oil price as you know. Low oil price will make it worse for the years to come. As it takes about 10 years for discoveries to come into production the worst problems will not be seen until next decade. Most of the so-called reserve growth comes during the first years of an oil fields life. So if discoveries drop, then reserve growth should drop soon thereafter too. Regarding enhanced oil recovery. As usual they of course take the low hanging fruits first. So it will be more costly and difficult as time goes. The next decade will be very difficult as I see it.
Hi FreddyW,
Maybe I have it wrong, my impression was that as fields get developed and more is known about the field that reserves that were probable or possible get moved to the proven category over time. The higher porices tend to speed up the amount of drilling and the knowledge gained from this drilling would also be greater and tend to speed the process of reserves moving to the proven category.
I have seen that companies sometimes talk about possible reserves being moved to proven plus probable. But it really makes no sence if you read the definition. It may look like it is whats happening as the reserves increase and the span decrease as you know more and more about the field. So they are probably just simplifying it. The opposite can also happen. The reserves shrink as you learn more about the field. But I don´t think anyone talk about proven reserves being moved to probable and possible.
the estimate of proven reserves also depends on the price of oil
Yes but possible reserves will not move to 2p reserves because of the price.
Hi Freddy W,
The reserves are classified and over time the statistical evaluation changes as more knowledge is gained.
Lets say 100 Gb were discovered and the initial estimate was 40 Gb was proved, 30 Gb probable, and 30 Gb possible.
Ten years after production starts maybe 50 Gb has been produced and the improved knowledge gained leads to
30 Gb of proved, 20 Gb of probable and 20 Gb of possible reserves. So the initial 2P reserves (70 Gb) has grown to 100 Gb (50 Gb produced plus 50 Gb 2P reserves).
It is true that reserves sometimes are less than the initial 2P estimate, but at least for the US from 1980 to 2005 (chosen so LTO is not included) 1980 2P reserves grew by 63% in that 25 year period. So the overall average is growth.
So you are right the reserves are not “moved”, but estimates change over time as knowledge is gained.
In your example it´s not 100 Gb that was discovered. It was 70 Gb with a 80% certainty that it´s within +- 30 Gb. Later when 2P has been increased it´s not because the possible has moved to probable. It´s because the old assessment is obsolete and there is a new better one. If you think that all possible reserves eventually will turn into 2p reserves, then you are way too optimistic.
I should also add that 2P reserves are actually allways too low and that is one reason there is reserve growth. There is 50% chance it´s higher and 50% chance it´s lower. But the probablity curve has a long tail. So if it turns out to be higher then there is a possibility it can be much higher. To get a correct value you should calculate the average for the curve instead,
US has probably the highest reserve growth in the world. So you should really not use that as a model for how the world will behave.
HI FreddyW,
I assume the World will have much lower reserve growth than the US.
HL gives a 2500 Gb estimate, those estimates tend to be low USGS estimates 3100 Gb WHICH I believe too high. I take the average., 2800 Gb for C+C-XH.
I agree the discovery estimate should be 70 Gb in my example and agree the estimate changes that’s the reserve growth.
If one estimates 2P reserves as roughly 1.7 times proved and consider growth of 2P reserves the US is probably similar to the rest of the World.
I only have data for US.
”Most of the oil will come from resources already discovered as higher prices move probable and possible reserves to the proved category and as contingent resources move into the reserves category.”
WHERE are these discoveries (resources)? [Split/grouped on type of oil, regions, basins, size or other].
To allow for transparency and third party verification these reserves should be listed by sizes, region/country/basin.
Will the financial and physical (development) capacities be there to allow for the growth assumed in your scenario?
”An oil price (all prices in 2015$) of $100/b in 2018 increasing to $125/b by 2024 should be enough to get oil supply higher.”
The above is an assumption.
Hi Rune,
Have you ever seen a scenario of the future that did not involve assumptions?
The following type analysis from Wood MacKenzie is the basis for my assumption that there are projects and potential projects which can keep oil output increasing until 2020. I do not have access to enough data to provide specific projects, my guess is that Wood MacKenzie and Rystad Energy.
Rystad has a cost curve at link below:
http://www.rystadenergy.com/AboutUs/NewsCenter/PressReleases/global-liquids-supply-cost-curve
Based on that Curve $120/b should get us about 1200 Gb and $120/b should be enough to do it. This is consistent with a URR of at least 2500 Gb, my scenario is about 2200 Gb through 2050. Wood Mac scenario below.
Have you ever seen a scenario of the future that did not involve assumptions?
Of course not. But assumptions can be realistic, or in some cases totally unrealistic. I think your assumptions are unrealistic, though not totally unrealistic. That is in the neighborhood of the 5% probability range.
I would give it a probability way below 1%.
It takes some time to explain the rationale for this, but key words are total global debt levels, strength of the oilco’s balance sheets, consumers affordability (as their access to/ability to take on more debt diminishes), the US dollar appreciation to name a few.
Hi Rune,
Interesting. Why is debt such a problem? There have been some who have argued that the very low interest rates in major economies are a market signal that more should be borrowed rather than less.
Oil company balance sheets will improve with higher oil prices.
US dollar appreciation makes US exports less competitive and will stimulate demand for US imports, improving the economies of nations that produce the exports to the US because they will be producing more goods both exported and due to fewer imports from the US. The US dollar appreciation mostly hurts US manufacturers. The US economy is doing relatively well compared to many other OECD nations so I don’t see the problem.
On consumer affordability, inflation is very low, interest rates are very low, oil prices are very low. Do you think affording oil is more of a problem now than in July 2014?
In any case a more pessimistic scenario is below, but many will still find it much too optimistic.
Has the interest rate in recent years been set by the market?
If interest rates now went up several would face bankruptcy and have their debt carrying capacities impaired.
”US dollar appreciation makes US exports less competitive and will stimulate demand for US imports, improving the economies of nations that produce the exports to the US because they will be producing more goods both exported and due to fewer imports from the US. The US dollar appreciation mostly hurts US manufacturers. The US economy is doing relatively well compared to many other OECD nations so I don’t see the problem.”
In short, what you are saying is that eroding the industrial base of the US is a good thing…for US.
”Oil company balance sheets will improve with higher oil prices.”
Oil price is one variable. The other one is reserves. Several years with low oil price while producing will lower the reserves of the companies.
”On consumer affordability, inflation is very low, interest rates are very low, oil prices are very low. Do you think affording oil is more of a problem now than in July 2014?”
You should post that question to someone who lost their job in the oil fields and now (if lucky) has to do with a lower paid job.
Your scenarios are of little value.
Hi Rune,
Why would interest rates rise?
Yes reduced reserves are a problem, as far as I understand this is nothing new, depletion has been a constant problem for the oil industry as has volatile oil prices.
I believe that most oil companies would prefer higher oil prices (and higher reserves).
Higher oil prices will certainly improve the situation for many oil companies and will also help the laid off workers in the industry get their jobs back.
And no I did not say the eroding industrial base in the US is a good thing. Please don’t put words in my mouth.
Market exchange rates influence international trade, so a stronger dollar helps other nations, pretty basic stuff.
And yes the central bank controls one interest rate, all other rates are determined by supply and demand for credit and are market based in advanced economies.
”Market exchange rates influence international trade, so a stronger dollar helps other nations, pretty basic stuff.”
Which erodes the US industrial base.
”And yes the central bank controls one interest rate, all other rates are determined by supply and demand for credit and are market based in advanced economies.”
Are you saying that the feds funds rate [or other central banks similar rate] does not influence the interest rates in the market?
No I am saying it does not determine them. Are the interest rate spreads always the same?
Hi Dennis & George & Rune & Ron
Please forgive me if I oversimplify and hark back and take much too long. I’m remembering back to TOD discussions of Hubbert’s linearization and the relationship between oil stocks and rates of extraction. The HL (which WHT used to describe as merely a heuristic) did define a rate in terms of a stock (having inferred an imagined total stock).
It had already been shown that US oil industry could not invest enough in US domestic extraction to keep up with the US rate of demand, even though there was a lot of conventional oil demonstrably still in the ground in the USA. Thus the US necessarily imported oil from other investment in world oil reservoirs. But, it seemed possible, circa 2007, given the relationship that had governed the rise and fall of US domestic oil production and given a notional world stock (reasonably quantified) of the same type of conventional oil reservoirs as the original US oil production, one could guesstimate the rate at which world industry might recover oil out of the ground over any particular coming decade. Which exercise assumed, (1) there was a growing use for the magic stuff, and (2) the oil industry was profitable along the lines of the known US model.
Given that perhaps only half the world stock of recoverable oil round about 2007 (guesstimate) was assumed to be still in the ground it could be argued back then on TOD that the rate of world extraction could not be expected to increase much further, if at all. If we assumed both a global economy similar to the US economy back in Hubbert’s day, and that we could rely on his heuristic for determining a relationship between ‘stock’ and ‘rate’, then the world already had reached ‘Peak Oil’. Some others argued on the basis of other guesstimates, but similar arguments, that the world could expect for another decade or so to increase the rate of extraction, but would soon enough approach PO. Indeed by 2007 it seemed there remained not too many places where profitable investment could lift the overall rate of world oil extraction above its already high maximum rate.
The same arguments continue for conventional oil to this day a decade later. Rune Likvern in comments has pointed out, if I have understood correctly, that only an examination ‘place-by-place’ can determine the relationship between investment in extraction (which determines the rate) and the existing ‘stock in-place’ (including notional estimates of ‘new stock’) if we are to have the information needed to estimate a future ‘rate’ of extraction . Hubbert’s linearization USA-style it seems cannot be simply applied to the future rate of extraction of world stocks. Where will the investment be made? There are still some profitable looking places, but not too many.
I think I am aware that a distinction needs to be made between ‘conventional’ and ‘unconventional’ oil, and attention needs to be given to the different types of oil. Refining, mixing and fungibility tend to disguise the likely very different relationships between ‘stocks’ and ‘rate’ for the different sources of different oil types. I would make a plea in particular for a distinction between LTO (which will perhaps remain a US phenomenon and only marginal to world oil production) and conventional oil. An oil reservoir is different from an oil source rock. The latter resembles more perhaps a stock of coal in vast beds that can be mined by increasing the forces (investment) needed to strip off the top burden and collect the stuff over a vast area, which does not seem sufficiently like assumptions about Hubbert’s oil.
I am still wondering – and I still hang around here – about the ratios that govern the Red Queen.
best
Phil
Dennis thanks.
Yes, all scenarios are based upon assumptions, but some assumptions are more probable than others.
WTI and 2016YTD is around $31/b.
So what should make it move to a sustained $100/b in 2 years while the market have been struggling with and likely for some time to come will continue to struggle with a supply overhang?
And how would the economies react to such a shock?
The Wood MacKenzie chart includes NGLs, while your scenario appears to cover C + C.
Further, Wood MacKenzie (in their chart) makes several important reservations.
It is not about the stock, it is about the flow.
Hi Rune,
I agree it is the flow that matters. Note that NGLs in my scenarios are about 350 Gb total (when the scenario is extended to 2300). I included NGL in my output totals to 2050. The output in the scenario is less than demand and oil in storage is reduced so that by 2018 oil prices start to rise. The World economy did just fine overall (World real GDP) from 2011 to July 2014 and the increased oil prices will help oil exporting nations like Norway, Russia, Canada, and OPEC. The price level I suggested keeps total oil spending at less than 2011 levels (4.5% of World GDP) and may be needed to keep flow rates high enough.
Also note that the World extraction rates(% of producing reserves for C+C less extra heavy producing reserves) might not be able to reach 12%, the US level is about 14% and I estimate the current World extraction rate at 8.4% (it was about 7.4% in 2005) and the model has this rate increase to 10.4% in 2025 in order to try to match demand. This may be unrealistic, the model is intended to be optimistic and is easily modified. A more conservative scenario below where extraction rates are somewhat lower.
Hi Rune,
The chart below attempt to explain the oil price rise.
I show supply and demand for the “optimistic” scenario.
The Storage level is shown on the right axis in Gb and it is relative to the “normal” 5 year average storage level. I have assumed in 2013 the storage level was normal and set that to zero. In 2018 the storage level starts to decrease and oil prices gradually rise reaching $75/b that year. By 2019 it is apparent that storage is dropping fast and supply is not keeping up with demand and oil prices rise to $100/b, by 2020 storage levels have dropped to normal levels but supply is still not keeping up with demand and prices rise to $125/b. After that the model is not realistic because storage runs out (not really possible) so either supply rises or demand falls (probably both) above and below the levels in the model. It may be that prices spike to $150/b which might reduce demand and increase supply, but I expect supply cannot rise above this scenario so it will mostly be reduced demand and maybe slower GDP or a lot of substitution for liquid fuel (better energy efficiency, more use of public transport, rural to urban migration, etc).
Total C+C+NGL output is about 2200 Gb from 1870 to 2050 with about 200 Gb from NGL and 2000 Gb from C+C. Biofuels are also included in the scenario below with the assumption that biofuels output remains at 2014 levels (using BP data) until 2025.
Forgot chart sorry.
Note that the green line is storage level from normal level (5 year average) in Gb and is read on the right axis.
”The World economy did just fine overall (World real GDP) from 2011 to July 2014 and….
That is a statement that is not backed by anything up to say why it was so.
According to BIS data the 4 big economies (EU, USA, China and Japan) which has about two thirds of the world GDP increased their total public and private debt with more than $16 Trillion from Q1 2011 to Q2 2014 while their total growth in GDP for the same period was about $4.6 Trillion [all figures are market value, $].
This is akin to saying the households did really good for some years because they each year borrowed 200% more than their annual income.
To keep pounding a message about oil spending as a portion of GDP [to derive some price the economies can sustain] is at best meaningless if not the effects of growth in debt is considered.
What is the definition of this extraction rate?
So far I have seen only one way to build a model that with some confidence may project future production and that is by splitting the world into regions/countries/basins with their respective oil reserves and looking at how R/P (Reserves over Production), discoveries [with due consideration to the distribution of their sizes and location {synergies, time critical discoveries, market access}].
The above method will also help identify what regions/countries/basins are in terminal decline and identify the realism in growth from those that may have the potential for future growth.
Then do a second loop involving amongst others the health of the companies’ balance sheets.
Lumping it all together and trying to apply some parameters to fit some supply profile are very likely not going to produce a realistic scenario/outlook.
As prices rise, demand will decline. Rinse and repeat. This time (as in now and the near future) the consumers will have almost exhausted their abilities to take on more debt to pay for higher priced oil.
NGLs both have lower volumetric energy content than crude oil and are not as useful as crude oil.
So why include NGLs, as the most important and valuable one is crude oil?
Substitution away from liquid fuel takes time and requires huge investments. Is there anywhere in the world where this is happening in a meaningful scale?
And how should these investments realistically be financed?
The scenarios you present Dennis all says there is ten years or more before this happens.
What if it turns out your scenarios are wrong? [I hold the probability for that to be higher than 99%.]
Hi Rune,
If we look at the entire World then for every borrower their is a creditor, so all assets and liabilities balance on a World basis as long as we don’t do any extra terrestrial borrowing 🙂
When governments can borrow at near zero interest rates, they should borrow and invest in public infrastructure. This tends to reduce unemployment rates.
Of course my scenarios could be wrong, most scenarios of the future are. I agree that there is likely to be a 100% chance that my scenarios could be wrong. As it is highly unlikely, in fact virtually certain that anyone could precisely forecast the future.
I use C+C+NGL because that is the data I have from the IEA and BP for consumption estimates.
I agree NGL is less useful, but I adjust for the lower energy content by using metric tonnes and then convert to barrels of oil equivalent using 7.3 barrels per metric tonne.
If one is going to look at supply and demand, most demand data I have seen lumps C+C+NGL togethefr
Is borrowing a neutral process?
”Of course my scenarios could be wrong, most scenarios of the future are.”
There is a difference between a realistic scenario and something that is way off.
”As it is highly unlikely, in fact virtually certain that anyone could precisely forecast the future.”
It is about being realistic and what is probable.
And what is the conversion you apply going from metric tons of [NGL] to barrels of oil equivalent?
Dough Leighton’so niece suggested that NGL would be similar to crude in energy content on a mass basis. Sour when using BP data I use 7.3 be perfect tonne.
In my model for supply I find NGL using a natural gas shock model and multiply by 0.7 to convert b of NGL to boe.
Ok, How many barrels NGL are there in one metric tonne?
7.3
Liquid Fuel Measurements and Conversions
Refined petroleum products
1 metric ton motor gasoline = 8.53 barrels
1 metric ton LP-gas (liquefied petroleum gas) (propane) = 11.6 barrels
1 metric ton natural gas = 10 barrels
1 metric ton NGL (natural gas liquids) = 10.4 barrels
HI Ron,
Correct I forgot to divide by 0.7.
I use 7.3/0.7= 10.4 b/tonne for NGL.
Forecasters like Wood-Mac can do zeroth hold, first order linear growth or exponential growth. They don’t do second order changes and definitely not tipping points. Having used some like them (not WM) the important thing is you can go to your boss and with open arms and say “we’ve used the best we could, unfortunately they were wrong”. There is a book called Supeforecasters out – I haven’t read it but seen some reviews. The best forecasters are not too invested in the result of the forecast, have a wide field of vision, and are prepared to admit and learn from their mistakes. The expensive consultants don’t tick those boxes. Can you imagine WM going to one of their major customers and saying “You’re toast in a few years, tough shit, suck it up. That will be $350 per hour thanks very much. Oh and by the way we’re toast as well maybe a bit earlier, but hoh hum, so be it.”
From reading the world around me I believe we are headed for non linear developments.
Some forecasts are in my opinion very simplistic and lacks important feedback loops.
I agree – 90 to 99% of the time just extending the trend works out fine. But it is the other times that really determine what the future looks like.
“Can you imagine WM going to one of their major customers and saying “You’re toast in a few years, tough shit, suck it up. That will be $350 per hour thanks very much. Oh and by the way we’re toast as well maybe a bit earlier, but hoh hum, so be it.””
Ha ha! I know someone who does consulting in another area who is well known for giving brutally honest advice like that — “Your program is doomed and a waste of money. Here’s precisely why. Shut it down now and use the money for something else.”
His reports get thrown in a drawer and ignored. He still gets paid so no skin of his back.
Hi Rune,
The global Cost curve from the Rystad link below, it includes C+C+NGL.
http://www.rystadenergy.com/AboutUs/NewsCenter/PressReleases/global-liquids-supply-cost-curve
Looks like the cost of the marginal barrel is roughly $95/b so if the reserves are developed quickly enough prices might remain about $100/b, I expect by 2018 it will be clear that storage is falling and output is falling short of demand so prices will rise quickly to $75/b and then more slowly to $125/b as it becomes clear by 2020 that the pace of reserve development is too slow. After 2020 we might see an oil price spike and a slowdown in global growth and oil demand, hard to know how it will play out, maybe another GFC as it becomes clear the peak is either behind us(2015) or will soon be upon us (2021-2025).
Just a short reply for now (likely more to follow which takes it a step further).
Most projections appear by default to assume that the consumers (in the future) will afford the costlier oil. I am not convinced that this will be the case and there are now some developments in US consumption that supports this view.
Remember the US dollar has appreciated significantly versus most currencies offsetting some of the decline in the oil price for consumers outside US.
High oil prices usually mean a weaker dollar, so the current dollar appreciation will reverse if oil prices rise again to $80-100 levels or above
Hi AlexS,
Can you remind me of your expectation for when that might occur ($90/b oil price for Brent in 2015$), are you thinking 2018 or do you believe it will be later like 2020 or beyond?
Dennis,
certainly not in 2016-17, unlikely in 2018.
Possible by 2020
Hi Rune,
There are some places such as China where the currency is pegged to the dollar, so a pretty major economy will not be affected by the dollar appreciation. For other nations the exchange rate favors their economy as there will tend to be more exports to the US and fewer US imports.
The oil price may not be as low as in the US, but unless the dollar has appreciated by 300% against your currency, oil will still be cheaper than in July 2014.
In the future there will be substitution away from oil as people buy more efficient cars and drive less as oil prices increase, some of the reduced vehicle miles travelled in the US is due to an aging population which tends to drive less. In addition more teleconferencing and younger people being less enthusiastic about the automobile may also be an important dynamic.
It seems this would be somewhat of a peak demand argument. That is a possibility, but I see that happening around 2030 as oil prices rise, to think that it will happen sooner seems too optimistic (even to me.)
In OECD nations in general oil consumption has been growing more slowly than in the past, my guess is that increased demand from developing nations will more than make up for this slower demand growth in the OECD.
And how much longer will the Yuan remain pegged to the US dollar?
”In the future there will be substitution away from oil..”
And what will substitute for oil? (Less driving using gas/diesel is not substitution.)
”It seems this would be somewhat of a peak demand argument. That is a possibility, but I see that happening around 2030 as oil prices rise, to think that it will happen sooner seems too optimistic (even to me.)”
I think me and several others would like to see documentation on how that is probable.
”In OECD nations in general oil consumption has been growing more slowly than in the past, my guess is that increased demand from developing nations will more than make up for this slower demand growth in the OECD.”
Key phrase here is: my guess.
Back it up with some documentation that supports it, then there will be less guessing.
Electricity will substitute for oil for electric trains and light rail, EVs, and plug in hybrids. As oil prices rise and the price of batteries falls demand for oil will be reduced.
OK. I’m going to do a major analysis here. Feel free to promote it to a guest post, Dennis — I see that you also believe demand destruction will happen. I attempted to quantify how it will happen based on the upcoming price signals.
I don’t know how accurate this site is:
http://gascalc.appspot.com/
But I’ve been trying to work out the relationship between the oil price and the gas price.
Here’s the thing. In a few years (2018) battery-electric cars will have comparable purchase costs to gasoline cars with similar size and features in the $35K+ price bracket, which is about half of all new cars sold in the US. (This is from promises made by GM and Tesla; BYD is matching this for China.) Electric cars are simply nicer to drive, so if all else is equal, they will be preferred. Their efficiency is well known, about .333 kwh/mile or better.
So I’ve been trying to figure out under what circumstances gasoline cars would still be cheaper to operate. This depends on the price of electricity, but we can assume that that will be 14 cents/kwh or less since that’s the solar LCOE in cloudy areas — more typical electricity price would be 11 cents/kwh, with 6 cents/kwh at the low end. This gives a range of operations costs for the electric car of 4.6 cents/mile (high end) down to 2.4 cents/mile (low end).
The difference of course depends more on the fuel efficiency of the gasoline cars. If I assume 30 mpg (which is optimistic for higher-end all-gas cars), I can calculate possible “break even gas prices” — prices where if gas is cheaper than that, a gas car is cheaper to operate than an electric car — from 72 cents/gallon to $1.38/gallon. If I assume 55 mpg (which requires a hybrid), I get a range from $1.32/gallon to $2.53/gallon.
Now, that website I found for guessing the relationship between oil prices and gasoline prices? It tells me that at $40/bbl, we should have gas prices around $1.31/gallon. At $77/bbl we should have gas prices around $2.53/gallon. (To get to 77 cents/gallon, we’d need $23/bbl oil.) Gas taxes should make the “breakeven” oil price a bit lower than these numbers, actually.
With the upfront purchase price equalized, gasoline cars become completely uncompetitive at these oil prices. As of 2018, the upfront purchase price will be equalized for the top half of the car market in the US (probably similar in Europe). So somewhere between $40/bbl and $77/bbl (or somewhat lower, considering gas taxes), *half of the automobile gasoline market starts to disappear*. That’s a lot of demand destruction.
I’m betting on the demand destruction being closer to $40/bbl. This is because hybrid cars require all the tech of battery-electric cars *plus* all the gasoline-engine tech; they’re more expensive to maintain and more expensive to manufacture, all else equal, so I think they’ll be less popular. Furthermore, once you are manufacturing a hybrid, there’s no reason not to add a plug to it; if it runs on wall electricity most of the time and gasoline occasionally (as most Volt drivers are documented to do) that still causes massive demand destruction for oil.
Any field with an $80 production cost is doomed. Any field with a production cost over $40 is very risky economically, and is basically a bet against electric cars.
When I compare that to your graph, Dennis, I see that Onshore Middle East is the only category which can be profitably added to production (with the exception of a few of the very cheapest of the other fields). All the others — if they’re added to production, they simply set fire to stockholder money and add to oil company losses.
Oil prices *may* temporarily spike above the “demand destruction limit” due to production capacity constraints on the manufacturing volume for electric cars — but this won’t last long, as the electric car manufactures will be practically coining money by expanding, so they’ll do so ASAP.
Even if it takes longer for electric cars to reach purchase price parity with gas cars in the low-end market, the destruction of *half* the gasoline demand will bring the price right down. 63% of oil is used in transportation, and of that 80% is used in road transportation, so about half of oil is used in road vehicles. Destroying half of gasoline demand is equivalent to destroying 1/4 of total oil demand.
When you look at *this* picture — where the onshore middle east is the LAST set of fields which can be profitably produced — you see a hard limit of less than 800 billion bbl. I am quite sure that this is, in fact, the hard limit. Due to the destruction of 1/4 of global oil demand within the next few years (probably in the early 2020s), we will actually recover even less than that.
Disclaimer: This is not investment advice; I am not your investment advisor.
–Nathanael N.
There’s the issue of rate as well. Getting rate up in the extra heavy áreas requires years. And Venezuela is a basket case. The situation has just worsened day by day. This week bakeries cut back on the bread they make, and there seems to be no way out, the communists simply insist on destroying everything. It’s going to be like Cambodia under pol pot if this keeps going. I never thought it could get this bad.
Those of you who speak Spanish can watch the drama day by day on “La Patilla Video” YouTube. Or read “Caracas Chronicles” in English. The English media simply fails to report the horror of what’s going on.
Hi Fernando,
Yes I am aware that flow rate is important so I model extra heavy oil separately. The model for extra heavy (XH) oil is pretty conservative, through 2040 we could get this done with Canadian oil sands alone based on CAPP forecasts, after that we might need some Orinoco Belt oil, hopefully the political situation in Venezuela will be resolved by then.
Also note that the Rystad cost curve does not include much “extra heavy” oil (which I believe is Orinoco belt oil), only about 10 Gb and “oil sands” (which I believe is Canadian) is only about 50 Gb on the cost curve. It also looks like they over estimate the North American Shale recoverable resource by a factor of at least 2.
At an oil price of $100/barrel in 2018, everyone stops using oil. The alternatives are well-developed now. $100/barrel == $4/gallon gasoline, at which point the electric cars which will be availalbe in 2018 are significantly cheaper. So if the price goes that high? Demand collapses, and supply collapses along with it.
When the oil price rises we will return to 2015 output levels or higher by 2022 to 2025.
I would love to see your rational for this. Who will return to 2015 output levels or higher? Obviously not everyone because so many nations have already peaked and are in decline. So for production to return to 2015 levels, and higher since you are not predicting peak oil until a decade or so from now, who will increase their production to well above 2015 levels? We know this will have to happen, for your scenario to be correct, because post peak nations will continue to decline regardless of price.
So who will it be Dennis? Where will all this new production come from?
Hi Ron,
Canada, US, Russia, Iran, Iraq, and Saudi Arabia. A number of projects that have already started to be developed or that have recently started production and are ramping up will reduce the overall decline from 2016 to 2018, by 2019 the current project deferrals will lead to a short oil supply and oil prices will rise, this will lead to a restart (probably beginning in 2018) in oil investment with new projects beginning to hit in 2020 and a gradual ramp up in output from there.
So an increase in price will increase demand? How do you figure?
Hi Jef,
The increase in price will affect demand very little based on the 1997 to 2014 data, demand depends mostly on real GDP not oil price.
The increased price will increase the oil supply needed to match oil demand.
But there are secular reasons to expect a drop in oil demand in the near future, *particularly* at high prices. Alternatives are now more attractive when oil prices get high (electric cars are just plain better than gasoline cars, for example). Government efficiency and anti-pollution laws will encourage lower usage as well.
I have to say, Dennis, that I believe this to be very unlikely. Quality of oil yet to be produced is falling – LTO in the States, sour, heavy crude from Saudia Arabia, oil sands in Canada and Venezuela. It will take great future political stability in the face of what presently most people would describe as a crisis in several of the major producing nations to compensate for, say, 10mm bbl/d fall in the next ten years. Iran, Iraq and Russia are unlikely candidates, imo, to step up to the plate.
Hi Jonathan,
Possibly you will be correct, so far Iraq, Russia, and Saudi Arabia have provided a lot of the increase in output.
I doubt we will see much decline in Russian output, I expect a plateau at minimum. Perhaps Iraq will not be able to increase output further, but they have been increasing output in a very unstable situation so far which may or may not continue, the potential is there. Iran can increase output with some investment, the country is stable relative to Iraq.
I expect demand to overtake supply in the next few years, oil prices will increase and supply may be more resilient than many expect.
The more realistic scenario would be a plateau in output, but very high prices would be needed to keep demand for oil in check and I expect C+C supply will increase to at least 82 Mb/d in response to high oil prices. Not sure where you get the 10 MMb/d decline, if average well decline rates for all producing wells was 6% and output is 80 MMb/d that would be a 5 MMb/d decline in a year. Clearly we have been able to match that plus another 2 MMb/d in 2015, for a total of 7 MMb/d of new oil output added (2 MMb/d net increase).
I expect output will fall somewhat in 2016, by about 600 kb/d, prices will gradually increase and output will level off for a few years and then increase as oil prices rise to $100/b or more. the reserves are there, the high oil prices will lead to their development.
Hi Jonathan,
I misread, you said 10 MMb/d in 10 years, and that is very conservative if you are talking about legacy decline. If you mean that actual future output will fall by 1 MMb each year for 10 years, I doubt that will happen because demand will drive oil prices higher and the decline in 2016 will level off as investment restarts due to higher oil prices.
I would note that private companies like Wood Mac and Rystad put their reputations on the line when they produce these charts, I am convinced that they give their best guess estimates. They may be wrong, but they have access to much more data than I have and are experts in the field.
AlexS seems very sharp to me and I believe he thinks my scenarios are too conservative, Fernando has suggested my guess for URR seems in the ballpark (for C+C minus extra heavy oil), though I believe he would suggest that 600 Gb from Canadian oil sands and the Orinoco belt combined is too optimistic (his guess might be 300 to 400 Gb.)
Dennis,
I think you have got some valid points here. Iraq and US have increased their production a lot the last years and it continued some time after the oil prices went down. Why should the production increase stop after the markets have reached balance (supply = demand)? In the beginning of this period of market balance and increasing oil prices (assumption) many oil companies will still struggle with a high debt, but they will also benefit from low(er) production costs, cheap engineers, crew, rigs/equipment etc and might thus get a large profit until the production costs get higher. In this initial period of demand higher than supply and supposedly higher oil prices, it might even be possible to get bank loans for field developments.
Hi Tom,
Thanks I agree with most of what you said, but for smaller oil companies the banks might be a little gun shy for a few years, they may need bonds for financing or it may be the companies with deep pockets survive.
Hi Ron,
Let us consider non-OPEC minus US, Canada, and Russia using C+C data from the EIA and using 12 month centered averages of monthly output so the trend in output is clearer. I find about a 211 kb/year decline in this group from the beginning of 2006 (12 month centered average) to the end of 2014 (also 12 month centered average). This is roughly a 1% decline rate over those 9 years. I believe there is a 30 month lag between big price movements (2008-9) and changes in the rate of decline so we may see sharper decline around the end of 2016 and that will continue until 2020, when the price increase I anticipate in 2018 will stem the decline by the end of 2020 (or at least reduce its rate). Chart below, these countries produce about 29% of World C+C.
Ron,
There is another factor for next three years of so: cheap financing of oil projects is by-and-large gone. No more shale drilling with negative cash flow. No more Arctic exploration drilling. Severe cuts in Canadian oil sands projects. Etc.
You now need to prove the viability of the project at much lower prices to get money. Even first several billion of losses of US banks that are coming in 2016 will make them even less inclined to inject money into anything that can move in the oil field. They have a very short memory but for the next three years the effect will probably last.
Also people now understand that markets driven by HFT are crazy and the price can have no connection to fundamentals for along, long time.
A lot of people in oil producing countries (including the USA) now want oil traders to be dead (as in famous Shakespeare “The first thing we do, let’s kill all the lawyers” — Henry VI ).
And some moves will be taken. Tobin tax might be introduced.
All those talks about “oil glut” are just propaganda. It served as a trigger (probably in the form of “Great condensate Con”) but after that the spiral became self sustaining like a snow avalanche and in no way dependent on the level of production. Saudis helped to speed this process up and drive it lower but the trigger moment was probably enough. And this avalanche will bury a lot of people and companies in 2016. The current estimate is something like 74.
So recovery of oil price now will have completely different effect then before: it probably will increase not decrease the number of bankruptcies — as taking ownership is a way to recoup investments in a rising price environment but it will not significantly change risk aversion (let’s say for approximately three years). People still remember how fast it dropped.
Mutual funds and pension funds now feel the pain too and they are actually the real whales of financial markets. Some heads will roll this year and that will change sentiment too.
All this will suppress risk taking for the next several years. “Remember $28 bbl oil” can probably now be tattooed on a proper part of many executives bodies :-).
So depletion will continue unabated for at least the next three years. After that even high oil prices will not be able to re-create the previous peak of production because you will have much worse starting position — more depleted fields. Timing is everything in this business.
So IMHO you are right and Dennis is wrong.
Likbez, I think your remarks should be directed at Dennis, not me. I agree with you completely. Dennis does not. But thanks for the post. It is a very in depth analysis of the situation we face today, a situation that very few people realize exist.
Good for very large compañies which don’t require project financing, or can use very low amounts. But those companies use $80 per barrel base case.
Hi Fernando,
So do you think 2015 will be the final peak for World C+C output?
I think you have said in the past that a lot of oil can be produced at $125/b, am I remembering correctly?
Would you say it is safe to assume oil prices won’t remain below $80/b forever?
Hi likbez,
There are a lot of projects that will come online over the next few years that will keep decline lower than you believe. When the bankruptcies in the LTO plays occur, oil companies with deep pockets will swoop in and buy up assets on the cheap, no borrowing will be needed, in the case of majors they can borrow at the prime rate or float AAA bonds if they don’t have the cash reserves.
I have two scenarios a plateau scenario and a more optimistic scenario where supply tries to match demand (where I have assumed a conservative World growth rate of real GDP of 2.1% per year from 2015 to 2025). Lower scenario below.
Hi Likbez,
You said:
So depletion will continue unabated for at least the next three years. After that even high oil prices will not be able to re-create the previous peak of production because you will have much worse starting position — more depleted fields. Timing is everything in this business.
The starting position will be worse, but not much worse, I also do not think there will be no new investment for 3 years, probably a year, maybe two at most. Below I show a chart of my estimate of producing reserves for World C+C less extra heavy oil, in 2010 they were at about 350 Gb, in 2015 they fall to about 334 Gb and in my “optimistic model” (86 Mb/d peak) they fall to 309 Gb in 2020.
So things are worse because in 2015 we would need an 8.4% extraction rate, but the lower producing reserves in 2020 would require a 9.1% extraction rate in order to match 2015 output, so we would need the extraction rate to be about 8% higher(9.1/8.4 minus 1) in 2020 to match 2015 output.
That seems a little worse, but not much worse.
But why do you think the investment will go into *oil*?
It’s obvious where the next big round of investment money is going: solar panels, wind turbines, electric cars. They’re all getting cheaper so fast that they’re going to put a cap on the price of oil. More immediately, investors will see the handwriting on the wall and will be gunshy about investing large amounts of money in a dying industry.
See above: I finally sat down and calculated the *oil price* at which electric cars displace huge amounts of oil usage. Different scenarios range from $24/bbl to $77/bbl, but $40/bbl seems most likely to me.
If an oil company is using $80/bbl for their internal estimates when planning new exploration, they’re burning stockholder money — they haven’t figured demand destruction into account. Demand destruction at prices above the “demand destruction oil price” is going to be a *minimum* of 1/4 of global oil usage, which should force the price down.
DC Wrote:
“When the oil price rises we will return to 2015 output levels or higher by 2022 to 2025.”
When Bubbles pop it almost always takes a full generation for investors to get interested again. It takes a new generation of suckers to buy into the next bubble. 2015-2014 was the peak in energy investment (adjusting for inflation of course).
We very well will see Oil prices much higher in the future, but its not liking to influence CapEx as it did over the past decade. Most investors now see investing in energy too risky. We are likely to see some another round of banking trouble. Even if banks have limited exposure to Oil&Gas debt, they still likely loaned out money to workers that bought homes, or business that started in the Boom towns. This is like the Gold rush of the 19th century that lead to ghost towns. Banks will be holding on to retail and homes in oil boom towns that they won’t be able to sell at virtually any price.
I think the biggest losers in the Shale boondoggle is going to be pension funds, that were desperate for yield after they got clobbered in the 2008 housing bubble and the extreme low interest rates of the Bernanke years. They piled into energy hoping to make up for decades of losses. Now they will need to go ultra-conservate as boomers are now retiring and withdrawing thier pensions.
http://www.zerohedge.com/news/2016-02-18/i-guess-its-food-stamps-400000-americans-jeopardy-giant-pension-fund-plans-50-benefi
[US Auto workers, FedEx/UPS, Teacher Unions, Trucking Unions, State and City workers across the country are facing severe pension cuts soon]
We are already now on a permanent decline trajectory, really it was the US drilling that permitted global oil production to rise. Now we are 7 years further down the depletion road, and no mitigation plans in place. At some point in-fill drilling at the super-giants is going to come to end, and Oil majors will no longer be able to maintain output. Once these large fields rollover, no amount of drilling is going to prevent a global decline. I am sure that at or before 2020 arrives the majority of the super-giants be rolling over into significant declines.
We are now in a permanent economic decline. The world economy had been propped up by developing nation borrowing (ie Brazil, China, India) and now they reached Peak Debt. Trying to add more debt, is just pushing on strings and lead to greater deflation & economic contraction. There is no more Chinas, Brazils, or Indias to kick off more infrastructure spending. The West is rapidly sinking as it can no longer stimulate economic growth and can no longer export goods and services to the BRICs.
At best the Worlds Central banks may turn to global scale QE, but that won’t fix the the mounting problems. Eventually we all become Venezuelans & Greeks.
Very well said, tech Guy. Very depressing assesment.
I harbor similar sensibilities about the global outlook, but then again I tend to just look at things that way.
However, there is another way of looking at things. For example, to many Indians the world has never looked brighter. For many, they are just now starting to achieve what we might consider middle class. The number of people who can afford to purchase a gallon of gasoline each week has mushroomed over the past 20 years.
Here is an interesting graphic illustrating that trend from Reuters (2012)-
http://www.reuters.com/middle-class-infographic
Hickory Wrote:
“For example, to many Indians the world has never looked brighter. For many, they are just now starting to achieve what we might consider middle class.”
Unfortunately I don’t think is sustainable. I think there is a lot of debt that is going to burn them. Same store in Brazil and China too. All of them have seen some increased living standards. but is it sustainable? no.
They are not going to like their increased living standards taken from them during the same lifetime that saw the increase. Brazil should be the poster child for this situation as the fall in its industrial production since the price crisis is nothing short of horrific.
We should expect civil unrest met with military repression during the upcoming 2016 Rio Olympics.
Graph of Brazil industrial production from Dr. Ed’s blog
Hi Techguy,
There have been bubbles in the past in the oil industry, but with the exception of 1979 to 1983 (not a bubble, but a War) the declines have been relatively short with sometimes a plateau of a few years. I believe we will see a plateau for 5 years or so and then C+C output will rise by 1 to 6 Mb/d with a peak between 2020 and 2030 (2024-2026 is my best guess). How much output rises will depend on oil prices and how consumers react to the increase in prices. Higher oil prices will result in higher supply, but those high prices may also destroy some demand.
Time always answers these questions, but if 2015 is the peak, we will not see significant decline (more than 2 Mb/d) before 2030 unless there is a shock (financial crisis or major war between Saudi Arabia and Iran and/or Iraq). I cannot predict future shocks, but if someone wants to go out on a limb and predict one, it can be modelled.
Well I agree with Ron over Dennis in this case, for the additional reason that the global economy is at the beginning of a secular transition to the power grid and away from the oil well. I know this ongoing process is outside of almost everyone here’s view, you are almost all oil guys and simply seem unable to imagine any other future between the either/or of more oil or total collapse.
This is not credible, but I am not interested in arguing about that any longer here, it’s already observable, I come here for Ron’s excellent data on oil supply (the post above is a fantastic and very clear example of his talents in this specific field). But I do wish to say that softening in demand will reinforce the likely 2015 peak. It is unlikely that there will be a return to investment in extremely expensive mega projects even with a price rebound as I believe demand weakness will keep that price in check.
We will get a structural volatility in price at least for the rest of this decade, then both Carbon taxes/trading, and real movement to high mileage vehicle/EVs as the supply chain starts to deliver post 2020 will kill high price/high cost oil production.
That hungry capital will be in attracted to electricity supply/grid/storage and transportation 2020+. Dennis’ future will never arrive. In my view. This is the oil retirement party, and some have already got the hangover.
This is a multi decade process that will be much clearer in years to come, but moments like Shell pulling out of the Arctic and the current/coming Shale bust are all small steps along the way on the supply side. In the same way the observable beginnings of the massive renewable build out are demand wise. As are continual steps in storage, grid sophistication (eg Germany),and EV range and supply.
As you were.
HI Patrick
A plateau is a possibility the 86 Mb/d peak is an optimistic scenario with lower probability, I would say chances are 60% we will reach a new peak but it may only be 1 or 2 Mb/d above 2015.
I hope you are right but think you are more optimistic than me.
I really don’t think it’s optimism; it’s just observation.
What is really interesting is that we all assumed, everyone; me, you, Ron, everyone, that the peak would surely arrive with record high prices. But of course the peak is the moment with the highest supply ever, and must also, by definition, be the beginning of the end of demand. I know that doesn’t compute for so many of the die-hard 20thC oil-as-master-resource guys. But everything is temporary, even the primacy of the dense black stuff.
The signs of the beginning of the end are there if you look. This recent price drop has not, at all, led to the huge uptake it should have if oil was so vital to the global economy as the oldtimers maintain.
The global economy should be so stimulated by this newly available cheap energy resource, but it isn’t. The global economy, not just the OECD, but the emerging economies too, have met $30 oil with a big shrug; why else are we in over-supply? There are few buyers of the marginal barrel at almost any price! This is extraordinary if you think about it.
Surely it means that we are in market saturation? And oil is in fact in a constantly declining share of global primary energy. In fact it is low price that shows that oil is over, or more precisely is on the way to being a niche energy source. Damned useful, and still there, but not as central as we are so used to.
I really don’t think that sustained higher price will arrive to boost production to higher levels, perhaps ever. Price will rise, then hit a ceiling, then bounce off the floor only to test a weak demand ceiling again. I think a long plateau of hard graft for the industry is ahead.
Imagine that; a world where ME princes are no longer like lottery winners? Change is the only constant; and this is a change I think we can already see the beginnings of. Strange as it may seem to those inside the oil world, and inside the US in particular.
“This recent price drop has not, at all, led to the huge uptake it should have if oil was so vital to the global economy as the oldtimers maintain”
Isn’t this more of a reflection of the strength of the global economy as a whole? I think many countries are actually going backwards in term of real income when increased debt in is taken into account.
Closer to home, just look at government and private debt in NZ and then factor in the increasing population. The apparent GDP ‘growth’ is illusionary. Of course you may own one of those ‘magic houses’ in the big smoke where the value ‘never decreases’. Btw, the latest Unity plan decision will be great for locking more people in to fossil fuel dependent commutes but that’s another issue. Anyway, I certainly can’t say I’ve seen many EVs in my neck of the woods, in fact I have only ever seen one 2 years ago – none since. I admire your optimism but the transition appears to still be very subtle. Look at the Island Bay development if you want to see where public opinion is at in terms of sustainable transport infrastructure.
errr…? NZ has very low public debt. The CIA puts NZ at 131st out of 176 countries at 33.5% of GDP:
https://www.cia.gov/library/publications/the-world-factbook/rankorder/2186rank.html
So much catastrophising by interested parties on this. And because the world is changing so fast many just react emotionally to any assertion that raises fear.
Yes the Wellington Bikelash, like the Auckland Unitary Plan panic, is a case in point. But frankly if there is no Bikelash then you’re not doing it right. Which is to say if the change you are proposing upsets no-one clinging to the past then you’re really not changing anything enough.
But this is how discontinuous change happens, barely visible and hotly contested at first, then to the inattentive, its suddenly everywhere. The cost curve will do that every time. The EV timeline is almost certainly longer than the evangelists claim but it will still be irresistible. As is the bike/walk/transit city re-shaping. For example:
http://www.citylab.com/commute/2016/02/central-london-rush-hour-bike-car-tfl/459774/
One view on timing:
http://www.wired.com/2016/02/electric-car-revolution-now-scheduled-2022/
The car displaced the horse and cart with extraordinary speed, which was all the more extraordinary both because early cars were terrible; uncomfortable, unreliable and expensive, and because there really was no suitable infrastructure for them. Roads followed, and incumbent users of existing streets were, quite literally, driven off them. This is the story of that American century, the last one.
You can see this revolution in photographs a few years apart in US cities from the early 1900s; earlier pics totally dominated by horses, carts, streetcars, people walking, then a couple of years later; almost nothing but cars.
In a couple of decades people will marvel that we actually lived with these violent and polluting machines so intimately; last century’s ICE exhaust pollution will be considered as bizarre as we now think of the piles of horseshoe on the streets of Paris and London in the century before.
I tells ya. States Quo bias is everywhere. You don’t see change by extrapolating from the present. By definition all that can be seen is continuity, and if that no longer makes sense [eg peak oil] then the only other option is collapse. Far too binary.
I hope you are right, I just fear the rate of change isn’t fast enough and we’ll be caught off guard while still having a significant dependency of fossil fuel based infrastructure. A lot hinges of the likely future decline rates, if the decline is slower than the demand destruction that’s fine, if it surpasses it however I think we’ll have some painful adjusting to do.
Thankfully the exponential growth of wind, solar, and electric cars is starting to reach the “significant number” stage. Which means we’re not that far from total market domination.
HI Patrick
Demand for oil continues to rise, oil prices are low because supply grew too fast relative to demand from 2013 to 2015.
As supply growth slows demand will catch up oil prices will be 80/b by 2019.
The transition you see is beginning but I don’t believe it will happen as rapidly as you foresee.
“I really don’t think that sustained higher price will arrive to boost production to higher levels, perhaps ever. Price will rise, then hit a ceiling, then bounce off the floor only to test a weak demand ceiling again. I think a long plateau of hard graft for the industry is ahead. ”
Just today I computed the ceiling where demand destruction kicks in big-time; it’s somewhere between $24/bbl and $77/bbl, but $40/bbl seems most likely. (This ceiling isn’t technically the case until 2018 when electric car production in the midrange starts going high volume, but I doubt the price will run above the ceiling before then. We might.)
Dennis has quite clearly shown the floor where all new production halts; this seems to be around $40/bbl.
When the floor crosses above the ceiling, that’s the end of the industry; it dwindles into a niche. That’s how peak anthracite happened; the price of producing anthracite rose above the cost of buying inferior grades of coal and converting them into “coke”.
“Imagine that; a world where ME princes are no longer like lottery winners? ”
The ME princes still have sub-$40 production and will be the last oil producers standing. Their market is about to shrink by a lot and their profits will be a lot lower than before, however.
Patrick R wrote:
” for the additional reason that the global economy is at the beginning of a secular transition to the power grid and away from the oil well.”
We will also be running into problems with the Grid. We’ll likely see coal plant shutdowns and increase reliance on NatGas which will cause electricity prices to soar. Since NatGas isn’t as easily transportable across oceans, its likely to become a problem within the next ten years due to the Red Queen. I also see a significant number of US nuclear plants to shutdown in the next decade as problems mount. Currently the US has one new nuclear plant under construction and one very old and unfinished reactor coming on line (refurbished and completed)
http://www.forbes.com/sites/williampentland/2015/11/10/as-energy-prices-fall-electricity-prices-rise/#431c70906a63
http://www.calmac.com/energy-storage-article-electricity-prices-are-on-the-rise-and-dont-look-to-stop-surging
http://www.pri.org/stories/2015-11-22/nuclear-reactor-closings-us-continue-roil-energy-industry
We will see the US lose production and jobs as higher electricity prices impact commercial and industrial business that rely on low cost electricity. I very much doubt there will be a switch from Oil to electricity. Electricity demand has been falling for over a decade as the economy continues to contract, this is forcing Utilities to raise prices since they still have to maintain the grid infrastructure and to meet new gov’t mandates and regulations.
If people don’t have jobs the have no need to buy an electric car to commute. Nor would they be able to afford one. People will just hang on to their existing old Oil powered vehicles, instead of replacing them. The duration for car loans is increasing every year as they are slowly becoming unaffordable for the middle class.
New-car loans keep getting longer
http://www.usatoday.com/story/money/cars/2015/06/01/new-car-loans-term-length/28303991/
Electric cars are considerable more expensive to purchase, and US consumers have all but stopped buying them.
http://www.detroitnews.com/story/business/autos/2015/07/01/hybrid-ev-sales-tumble/29565265/&rct=j&q=&esrc=s&sa=U&ved=0ahUKEwiP0qPsx5jLAhVG7B4KHa4JAiMQFggUMAA&sig2=-9KJ-8nJDgEMWqbfGXpDnw&usg=AFQjCNF70NhEgtYqZu_f7OUq5kgF2zrVkA
“Many of the dozens of new EVs that have gone on sale have been sold in very low numbers — and often only in California. Automakers have been forced to cut prices and offer heavy discounts to sell EVs, even with $7,500 federal tax credits and state incentives.”
The US consumer is tapped out. The middle class is seeing their jobs either get outsourced or replaced with automation, and are increasing forced into lower wage and part time jobs. They simple won’t have the cash flow to buy electric vehicles or invest in Solar power systems.
I live and work in one of the wealthiest counties on the East Coast. Its bad here. The most common advertisements I see are “Space available” and “home for sale”. The area I work in has mostly half empty buildings. The company I am consulting for has laid off about half of its workers (outsourcing and automation). The biggest trend is that Building owners in the area, are converting office building into residential rental properties since they can’t find tenants. Although I don’t know who they plan to rent to, since jobs are disappearing.
I suspect that California has been doing much better than the rest of the country. The Tech Boom in CA is largely as companies look to leverage technology and automation to replace workers. I suspect that the CA Tech boom will plateau soon and start decline over the next three to five years.
You need to look outside of the US to see the future on this. The US is not a leader here. It has pockets of change but also major incumbency issues, and frankly, viewed from distance, a seemingly broken political process.
Germany is a major manufacturing economy and is in the midst of a clearly highly successful transition not only from coal but also, simultaneously nuclear as well. This is extraordinarily ambitious, additionally it is neither very sunny nor well suited to wind power, but is succeeding with both.
Germany is a declining nation, its demographics are almost as bad as Japan. Its economy is dependent on selling high end products to consumers that are disappearing (aka the dying western middle Class). Germany has also started construction of new coal power plants (30 new coal plants being constructed or planned to be constructed)
Coal Returns to German Utilities Replacing Lost Nuclear
http://www.bloomberg.com/news/articles/2014-04-14/coal-rises-vampire-like-as-german-utilities-seek-survival
Germany is in big trouble as waves of uneducated and unskilled Mideast refugees (mostly radicalized male Islamists) are causing wide spread mayhem. Germany Biggest Bank (Deutsche bank) is facing extreme problems that will like cause a severe economic crisis in Germany in the next couple of years. We are already seeing the rise of extreme right wing groups in Germany over the Refugee crisis.
Germany is by no means a beacon of light and hope.
What I stated in my earlier post just about applies to all industrial nations. North America, South America, Europe, Asia, Australia, are also facing severe problems. Demographics unsustainable debt (including consumer, gov’t and business) and Tens of Trillions of unfunded liablities (Gov’t entitlements, pensions, etc).
oh well never mind actual facts; the end of everything is nigh…. have a nice life.
Spot the outlining dinosaur economies…..
And they’re slaying the other monster in the room, in the only way possible; real continual change. And change means the old ways have to go, transition does not involve preserving current jobs in the oil industry, it requires replacing them with new ones in the new economy:
Rig count just off Germany’s coast still going up; wind turbines that is:
with chart this time:
Patrick R and Tech Guy- thanks for the back and forth on this. I think you guys are hitting on two sides of this issue with excellent points. Sure there is a marvelous world in the future within in the grasp of humanity, but will it be affordable and widely dispersed?
Personally I think we’re far into the massive overshoot territory, and at best we are in for a very bumpy plateau , prior to decline. In this scenario, it ain’t pretty for even places like Germany or California (where I live in a favorable semi-rural area with quite a few teslas on the road).
Germany is getting older, and is surrounded by countries in big debt that are placing their hopes on Germany for financial underpinning. When China goes through its big devaluation over the next year or so, Germany’s exports will be less competitive and it will see some resultant economic decline, all the while it is trying to prop up a declining customer base (Europe). They are also going to have to learn to orient towards mecca five times a day as the demographics of the Europe begin to shift under the wave of migration that is just starting.
I make no claim that nirvana is around the corner, and nor is that the test [why these ridiculous double standards?] but rather that change is happening, in fact is inevitable, but how well and in what direction depends on human actions. It is potentially a revolution, but also an ordinary one, these happen regularly through history. Our moment is not unique in essence even though it is in terms of threat to human survival.
The intellectually weak assumption that there only exists a binary choice between the status quo and doom limits these options. We can only build what we imagine, and it is clear that there are examples all over the world that can aid this process.
And process is the key; the Germans are on a generational journey, as the charts above show, towards both less FF use and no nuclear, the ambition of this is extraordinary, but they are already reaping the benefits, renewables pay dividends. Wind farms are like oil rigs with very very low opex costs, they pay out while you sleep. And through the transformation of their industrial economy.
And yes demographics, economics, and energy are all interrelated, but the immigration issues are not really relevant to the Energiewende.
Patrick is correct. Period. It’s very hard to call the exact timing on the decarbonization of the world economy, but it’s happening, and it’s happening fast enough for banks and investors to be very, very wary of financing new oil exploration (which has been entirely loss-making for several years). So, oil demand flat-to-declining over the longer run, keeps prices from going above a particular level, keeps investment in new supply from happening.
(It’s happening too late to avoid climate catastrophe, but that’s another matter. The survivors of the floods and famines are gonna be using solar power, wind power, and batteries.)
Also noted a zillion times, the price (in real terms) cannot go up in 2017 or any other year because the bid does not exist on the street. The (marginal) customer is broke, he cannot borrow, he will be less likely to borrow tomorrow than today and even if he does it won’t be enough and won’t be long enough.
In nominal terms: if the customer price of oil increases so will the driller’s costs by the same proportion. This is because the driller uses the same dollar as the customer.
Right now marginal credit flows to tycoons is stranding the fuel customer — not necessarily an American, more likely Japanese, Greek, Syrian, Russian, Turk, etc. He cannot afford any but the lowest price. Stranding the customer strands the driller and his lender.
Once the lenders start going under there will be even less credit and lower prices.
I’m not with you on this Steve.
The price of oil could easily double in real terms without putting a dent in the global demand for oil.
At least that’s how I see it.
People will give up other expenditures rather than cut their energy use, up to much higher price in energy.
That’s clearly not happening. The price tells you all you need to know.
Enough folks are cutting their energy use … rather, energy use is being cut for them. The instrument of reduction is ‘broke’. The Number One product of our economy today is poverty. As a small handful of tycoons become richer the rest are stripped. As the drillers suck credit, the customers are deprived of it. As more desperate remedies are attempted — bailouts, government guaranteed loans, tax write offs, subsidies — even more credit flows from customers to the drillers. The higher the price, the more the drillers and their lenders are stranded because their customers cannot borrow enough to retire the drillers’ loans.
If a person is broke it does not matter what he is willing to ‘give up’. Broke means you give up everything except food and other bare necessities. You don’t buy anything.
Fuel is international business. The marginal (non)customer can be an American … more likely he is Japanese. When he doesn’t buy => price declines. More Japanese monetary easing => less funds available for Japanese customer => less likelihood he will buy.
When that marginal buyer exits the market = the bid crashes.
If refiners and specs bid prices higher in futures’ and spot market the result is refiners with products they cannot sell.
More credit to drillers = more marginal output which adds to ‘glut’. Yes, marginal economics affects drillers as well as customers.
Bottom line is, 100 years of extraction and the world has lost half its purchasing power … which is always equivalent to what is being purchased. No resources = no purchasing power at that point ‘money’ becomes irrelevant.
Steve: “The price tells you all you need to know.”
I think price of oil in 2015 only tell us that significant NA production is unprofitable bellow $50. I am not sure that tell us anything about the bid from the street yet. It tells me that if the price stays below $50 for longer than if NA wants to make up the difference between current consumption and domestic oil production it has to exchange the difference with something tangible in return. At that point we could see no bid from the street if there is nothing to offer.
Hickory,
I am with you on that. I think up to $5 per gallon gasoline consumer behavior will not change much. The EU already experimented with those prices of gasoline. The USA have prices over $4 for several months.
5$ gasoline? In the EU we had 8-9$ gasoline 3 years ago, we have a lot of taxes on it.
We are now down to 4-5$ gasoline, and people begin buying SUVs…
Hikory wrote:
“People will give up other expenditures rather than cut their energy use, up to much higher price in energy.”
Cutting expenditures elsewhere caused a decline in demand for good & services. If people are consuming less, then companies produce less and layoff workers. Thus leading to declines in even energy consumption.
The primary reason for lower energy prices is a global economic decline. Not only did the price of energy fall, so did most commodities. If the price drop of oil was from increased supply and not an economic decline, than prices for other commodities would not have collapsed.
Hickory wrote:
“The price of oil could easily double in real terms without putting a dent in the global demand for oil.”
Its unlikely that consumers and business will drive energy prices back up. We’ve reached peak debt globally. The only way prices are going to back up above $100 is either lots of Central bank money printing that causes inflation, or a war that impacts global production. Either way it wont help. That said I would surprise me that he end up with both (Money printing and War).
Hi Steve from Virginia,
The bid is low because there is too much supply chasing too little demand, a simple matter of oversupply. When supply decreases and as demand increases (due to real GDP growth of roughly 2%/year) the market will balance and once excess oil in storage decreases (over 2017 and maybe in to 2018) then oil prices will increase. There was enough demand for 75.5 Mb/d from 2011 to July 2014 at oil prices over $100/b, supply just grew faster than demand which led to a price crash. Consumers needed 78 Mb/d, but 80 Mb/d were produced ergo low oil prices.
Dennis,
Oversupply on the micro front is always relative, that is, relative to declining consumption there is a ‘glut’ (even though world output has been more or less flat since 2005).
On the macro front, there is an absolute under-supply and has been since 2000. Fuel is being ‘rationed’ by access to (or denial of) credit. The outcome of credit rationing is lower prices … which makes sense as incrementally higher prices would always tend to bring more fuel to markets … as seen from 2000 to 2014.
A common assumption is non-fuel economic sectors will operate in the background as per usual regardless of changes of input prices. This assumption is incorrect: price is a function of available credit which in turn offers funding feedback from customers to drillers. What does this mean? Drillers must borrow and spend, the customers borrow in turn to buy drillers’ products. The customers’ funds are needed to retire (and service) the drillers’ loans. Right now the customers cannot borrow: they are jobless, under-salaried, buried under house-college-car-medical loans/austerity or are wage slaves in EU, Latin America or Asia. Their countries have been destroyed by wars and their consumption has been lost. QE has shifted trillion$ in credit away from customers toward banks (and drillers) The customers’ cumulative failure feeds back to drillers who are running out of funds. Contrary to assumption, macro changes affect all the sectors not just fuel extraction.
With all sectors coming up short the ability to consume is constrained, against this background even a reduction in extractive output appears as a glut … but it is a relative glut.
Watch and see what happens next. Fuel supply will flag — as it must due to less funding for reserve replacement — prices will remain low or decline further. If NIRP becomes effective policy or there is more QE the oil price will crash.
Another way to look @ fuel prices: a large percentage of a fuel unit price (barrel, gallon, liter, btu) is credit, the same way a percentage of a house price is what can be borrowed against it. Strip away the credit cost of the house is shelter value and cost of materials (less credit). Strip away the credit cost of fuel and what remains is the actual return on the USE of the fuel. Less credit = price declines: for fuel it is to the amount that can be paid for by actual remunerative use: (some) transit/delivery, agriculture/emergency (fire trucks, etc.).
Most fuel is wasted simply for entertainment, about 5% of fuel use offers an actual return. Consequently, the non-credit price is likely to be very low. @ $5/barrel there is no fuel industry of the kind we have today … and very little fuel.
HI Steve from va
Consumption of oil at the world level has been increasing not declining. Pretty much a linear correlation between real GDP and oil consumption from 1997 and 2014.
There is that little bugaboo for Iran’s oil production increase coming of . . . who is going to buy it? To put in storage and pay the inventory costs of it being in storage.
And since it’s being bought . . . to be put in storage . . . this is demand. And if the storage is non 100% recoverable (like the US SPR, which winds up in rock pores all of which does not then come back out) hell, it’s also consumption as well as demand.
And since it’s being bought . . . for any reason . . . in the world of supply and demand disciples, why didn’t this drive the price up?
Hi Watcher,
Buying something doesn’t drive the price up. To find buyers the seller drops the price and the excess supply is the reason we see prices drop.
I know you think you could raise your price in this situation. In the real World id everyone has the oil they need at $30/b and I enter the market trying to sell my oil, I don’t find many buyers at $35/b, I might find some buyers if I sell my oil for $29/b though.
http://in.reuters.com/article/oil-demand-kemp-idINL8N1644QU
Nice piece of the puzzle Amat. Distillates is the glut.
SO diesel demand has been tanking but gas remains strong. The economy is tanking but people are still driving around in circles.
Amatoori,
Very good !
Some (albeit vague) support for a growing day-by-day “glut deniers” movement 🙂 . The newer part of the the argument revolves on fixed ratio of gasoline to distillate in refining process. Which supposedly caused a growth of distillate inventories due to weather induced low demand :
Amatoori,
It always surprises me, that when people talk about the year on year drop in diesel consumption, nobody mentions the fact of 1000 less drilling rig working, plus the lower demand from less fraccing, the transport of train loads of sand per well, etc.
I would have thought, the EROI boys would be all over it. As I feel this is where the theory of EROI being very low for unconventional oil and gas, actually starts to show up in day to day numbers.
Hi Toolpush,
It always surprises me, that when people talk about the year on year drop in diesel consumption, nobody mentions the fact of 1000 less drilling rig working, plus the lower demand from less fraccing, the transport of train loads of sand per well, etc.
You made a very good point ! Thank you.
As EROEI boys are lazy bunch let me fill in. Let’s assuming EROEI 10 for shale oil (which might be charitable; some sources claim 3-5)
https://en.wikipedia.org/wiki/Oil_shale_economics#Energy_usage
So we need 4.2 gallon per bbl.
The EIA estimates in the Annual Energy Outlook 2015, that about 4.2 million barrels per day of crude oil were produced directly from tight oil resources in the United States in 2014.
So we are talking about 0.4 Mb/day of diesel consumption. Which is respectable 10% out of 4 Mb/d of the total US distillates consumption. So 2% drop (which amount to 20% drop of diesel consumption in oil patch) might be fully attributable to the lower activity of shale patch.
In other words you are right !
Again, you’re using “shale oil” and confused as to whether it means “kerogen containing shale cooked into oil” like the wiki article is discussing (and which has no commercial production in the US),
or “light tight oil from shale-ish source rock” that is the 4.2 million bpd in 2014 production number.
see my comment up thread on EROEI of North Dakota LTO:
http://peakoilbarrel.com/oil-price-and-its-effect-on-production/#comment-561317
unfortunately the “adjusted sales of distillate fuel oil by end use” at the EIA only goes to 2014, and their proposed next release date is Nov. 2016.
Toolpush,
There is also less coal being shipped by rail. I don’t think Buffet’s BNSF investment was as wise as some think it is.
Oh, coal is dying really really fast. As is shale oil. BNSF does have a pretty strong intermodal market though, which is still growing.
It’s interesting that Saudi Arabia pulled the price out from under the competition, at great cost to themselves also, right when global crude plus condensate was peaking.
I think it’s likely that a lot of infill drilling that has taken place will result in a steeper decline curve.
Buckle your chinstrap. It’s going to get interesting!
It would be interesting if that’s what happened. Why didn’t shale shut down? Or US conventional? Why wasn’t it the US that caused a price fall? Or anyone?
It was Saudi Arabia who refused to play swing producer and cut production to shore up oil prices. Saudi Arabia has happily played swing producer for decades and at the moment the world hits peak oil they decide they don’t want to anymore. It’s fairly easy to see and I find it interesting. Are your three questions rhetorical or do you feel the answers are relevant to the topic I proposed in my first post? I suggest the answer to all is “insufficient evidence to draw a firm conclusion”. Perhaps you could enlighten us and answer your own questions. You know, tell us what you think is the case. Share your observations. What’s your position? I often find your comments rather vague and nebulous; like you’re trying to be cryptic. It’d be more interesting to know what you’re thinking if you expressed it more clearly and not in the form of questions that could have various answers.
I second the motion.
Jimmy,
It was Saudi Arabia who refused to play swing producer and cut production to shore up oil prices.
This is a weak argument that was already refuted several times here and elsewhere. They abandoned their role of swing producer almost 20 years ago so this is not a news. See http://www.gasandoil.com/news/middle_east/be109e33fc686ff50a788a752312a532
First of all additional export capabilities of Saudis are limited (for a long time) and they no longer can play this part of the role of swing producers — “flooding the market” part of its role, although they can still play (but do not want to) the part of role where you stabilize the price by cutting the supply.
Saudis did increase their export in 2015 in comparison with 2014, but in 2014 they experienced a drop in comparison with 2013. So all in all they are more or less flat. See for example http://www.softpanorama.net/Skeptics/Financial_skeptic/energy.shtml
“although they can still play (but do not want to) the part of role where you stabilize the price by cutting the supply.”
By Jove, I think he’s got it!
Is there some document that KSA signed agreeing to be something called a swing producer?
If you want less oil flowing, then cut oil flow.
Why should they refuse to fill orders? They have said repeatedly over the last 18 months that they won’t allow someone else to take their marketshare. Obviously to keep their customers they have to supply them.
I’m pretty sure you and I are having two completely different conversations. Or perhaps we’re not. Either way I have no frickin clue what you’re trying to get at and what it has to do with any comments that I’ve made. From what I can tell KSA was for a longtime a swing producer. I don’t know if they signed a piece of paper affirming this but it seems pretty obvious.
On a total petroleum liquids basis, Saudi net export numbers are higher, but the trend is the same. Based on EIA + BP data (BP consumption data for 2014), Saudi net exports fell from 9.5 million bpd in 2005 to 8.4 million bpd in 2014, and I estimate that Saudi net exports were around 8.7 million bpd in 2015. The bottom line is that it appears that Saudi net exports have been below the 2005 rate for 10 straight years.
However, the Saudis did cut production and net exports from 2008 to 2009, as oil prices fell.
But a key difference between 2007 to 2009 versus 2013 to 2015, is that global total liquids consumption fell by about 2 million bpd from 2007 to 2009, whereas it rose by about 3 million bpd from 2013 to 2015.
Jimmy said:
“It was Saudi Arabia who refused to play swing producer and cut production to shore up oil prices. ”
likbez said:
“This is a weak argument that was already refuted several times here and elsewhere. They abandoned their role of swing producer almost 20 years ago ”
Saudi Arabia acted as a swing producer during the previous oil price down-cycle in 2008-09. They cut production by about 1.5 mb/d from the peak in August 2008 to February 2009. Along with minor cuts by other OPEC countries, that contributed to the recovery in oil prices.
By contrast, OPEC’s refusal to cut production at November 2014 meeting and increased oil production by Saudi Arabia and Iraq in 2015 contributed to the decline in oil prices
Saudi Arabia oil production vs. Brent oil price in 2014-2016
Saudi Arabia’s combined exports of crude oil and refined products was constantly increasing over the past several years (except 2014). Annual-average exports in 2015 was more than 0.5 mb/d higher than in 2014
Saudi Arabia’s exports of crude oil and refined products (mb/d)
source: JODI
AlexS,
Would part of the reason for the increase in Saudi exports of refined products as well as crude be the various refinery JVs Saudi Aramco has been involved in? One or two have been coming on line each of the last few years, if memory serves.
Synapsid,
Yes, they have significantly increased refining capacity.
As Saudi Arabia is also importing oil products, it makes sense to look at its net exports.
The country’s annual average net exports increased by 0.48 mb/d in 2015 and almost reached the peak level of 2005.
Declines in net exports in 2002 and 2008-10 were due to output cuts during the past two oil price down-cycles.
In general, the chart below doesn’t show a sustained downward trend in Saudi Arabia’s net exports.
Saudi Arabia’s net crude oil and refined product exports (mb/d)
an error in monthly data for August 2014.
The chart below is corrected:
So far as I am concerned, I do not KNOW if the end users of oil are so broke they cannot afford more expensive oil. Incomes might go up, and even if they don’t, other folks have pointed out that consumers can cut out buying other stuff, in order to buy oil.
The question is whether the producing end of the industry will continue to supply oil at low prices. Right now, from what I gather reading this forum, somewhere around seventy to ninety percent of all the oil produced right now is being produced on a positive cash flow basis. The producers may be losing their shirts, but they are still bringing in a little cash above and beyond day to day operating costs. So being in a desperate bind for that cash, most of them will continue producing. A few with deeper pockets may shut in some production, waiting for higher prices.
Now let us say that consumption falls by five percent next year, with depletion wiping out that same five percent of current production. If enough producers are cash flow positive, oil will keep on coming to market, at whatever the price is.(Probably, barring cartel type actions, or political troubles keeping oil off the market .)
But damned few if any producers are going to produce, especially for export, if they are CASH flow negative.
As each marginal barrel goes negative on the cash, regardless of the price, we can expect that barrel to be shut in, barring a price war, or economic warfare. It is possible that Saudi Arabia or Russia might either one get to be desperate enough in terms of national interests, as opposed to economic interests, to use cheap oil as a military option. Some say the Saudis have been doing that already for the past year.
Bottom line, I just can’t see much if any negative cash flow oil coming to market.
My opinion is that production will decline faster than consumption, after a while, unless the economy REALLY goes to hell.
And the less oil we use, the more VALUABLE every drop becomes. Let’s not forget that a big truck like my C60 Chevy will haul apples to market burning twenty dollar diesel a hell of a lot cheaper than horses and mules. Twenty dollar diesel is DIRT CHEAP, compared to a mule., when I get ready to plow and cultivate.
So long as industrial civilization survives, oil will sell for more, on average, than it costs to produce it.
Maybe half of all the oil we use is used frivolously.The other half, we MUST have, for the foreseeable future, and we will pay ANY price for it, up to virgin daughters, and good looking ones at that. With dowries to boot.
The price WILL go up, once depletion puts enough production into the cash flow negative category. No if’s ands or buts.
Now I don’t know when production will fall off enough due to lack of upstream spending, or how long the producers can keep on bringing oil to market at thirty bucks. But it won’t be forever.
What a small truck the C60 is!
Around here the farmers haul their apples in hatchbacks. I would expect them to switch to electric cars as they become cheaper to buy than gas cars (~2022), since they’re already cheaper to operate at any gas price above $2.00.
Yair . . . .
Just a comment from our personal situation . . . and many Australians are in the same position.
We are retired on a low fixed income, live on a rural block seven kilometres from a village and eighty kilometres to nearest major centre with medical facilities and decent shopping.
We run two vehicles, a 2.3 litre short wheelbase petrol SUV and a three litre diesel ute. I also have a sixty five hp tractor, a ZRT mower and the usual chainsaws whipper snippers and so on.
Our fuel use remains constant (within reason) regardless of cost. I filled the ute the other day for under a dollar a litre . . . had it been two dollars fifty or three dollars I would have done the same . . . even if fuel dropped to ten cents a litre I sure as hell am not going to drive or mow any more than I do.
I believe for us, five dollars a litre will be the straw that breaks the camels back
Cheers.
Well, well, well.
A man whose fuel use is largely not price sensitive.
Or maybe a society of the same, since trucks have to deliver the same calories to shelves regardless of price. People have a food consumption necessity. If it costs too much, subsidize it. Cost is measured in printed pieces of paper. No reason they can’t be redefined.
Jeez Scrub, you just described our situation to a tee, up the other way (Vancouver Island). Our fuel today was reg. $.95 cdn per litre. For us we would go to $5.00/litre as well before it hurt too bad, but there will be lots of ride sharing to town along the price rise.
Our run to town (small city 40,000) is 75 km. I just finished redoing my 30 year old Toyota PU. Gone is the box and replaced with a very nice flat deck I built with a headache rack for carrying long stuff. And…I just got off the phone with a bodyshop who will replace front fenders and chase away the rust, including a top knotch new paint job for $1200 cash. For under $2,000 cdn I have a totally refurbished economical work truck and I plan to shoot for 40 years !!! (It’s an ’86). To replace it new would be over $40,000, and even a good used one fetches $20,000. Peak Oil to me means rebuilding and fixing instead of buying in to buying another or buying more.
Yair. . .
Gotcha Paulo. My last ute was a Toyota Hilux with the 2Y(?) engine and I never had a spark plug out in twenty three years! We were in the fortunate poition of being able to purchase new vehicles to see us out but I agree with your sentiments entirely. If fuel goes to five dollars a litre I believe other costs would force us out apart from the price of fuel per se. For some reason the site won’t allow me to break this post up into paragraphs and I apologise for the block of solid text. Cheers.
Here in the USA, if gasoline went up half way towards $5/l ($20/gal) I believe people would be clamoring for coal fired power plants to charge their electric vehicles.
Hi Hickory,
Only if they want expensive electricity as Wind power is cheaper in many places.
Of course wind where it is windy, and solar where I live.
But for large swaths of the USA coal would be by far the cheapest.
Whatever the source, it would be cheaper miles than $10-20/gallon gas.
Hi Hickory,
Probably not the case if all external costs of coal power ae considered. A widely dispersed set of wind power sires tied together by the grid would be far cheaper than coal.
New-build coal plants are more expensive than new-build solar *everywhere* and more expensive than new-build wind *everywhere*. Already.
Solar has no deployment limits, so that does it for daytime supply. For additional nighttime electricity when wind is fully built out and hydro is fully tapped, the short-term source of electricity will be natural gas turbines. I’m not sure what happens after the natgas price goes up — landfull gas is a likely possibility, actually.
Old coal plants are another matter economically, but they’re uneconomical unless they’re near a coal mine (transportation costs are huge) and most are being shut down for mercury pollution violations anyway. A few will probably hang around longer than they should.
Paulo,
There’s no salt on the roads you drive? : )
If the price drops to zero, production will be zero. 😉
Iran will sell 600,000 barrels of oil they hadn’t sold before. 18,000,000 dollars in their pockets they didn’t have, every day. In a year, Iran will have an additional $6,570,000,000 to save or spend. Like winning the lotto, only better. In another year, it’ll be another 6 or 7 billion dollars. After five years, Iran will be able to buy 8 or 9 nuclear reactors from China. Five years later, Iran will be able to buy something else. Maybe Bakken oil wells for a song and a dance. For 10 billion dollars, they could maybe pick up 2000 wells. Whiting will have some for sale at fire sale prices. Iran could buy all of the plugged and abandoned wells Whiting has in the Bakken.
Some thoughts on the last thread.
Texas preliminary July 2015 crude oil production averaged 2,456,481 barrels daily, compared to the 2,244,291 barrels daily average of July 2014.
Texas production in July 2015 came from 176,180 oil wells and 96,098 gas wells.
http://www.rrc.state.tx.us/all-news/092515a/
2,456,281/176,180=13.94 barrels per day in July of 2015 average.
Going to take a big drop in wells to collapse oil production in Texas. There is strength in numbers. The plateau will last a while if there are that many wells doing one simple thing, pumping oil at only 14 barrels per well. If 10,000 wells are abandoned, it would drop production by 140,000 bpd. Still would be 2.3 million bpd production. Costs of operation would decrease, a price increase would develop.
http://www.rrc.state.tx.us/oil-gas/research-and-statistics/production-data/texas-monthly-oil-gas-production/
The increase in production has increased 2.5 times in the last 7 years.
It would take a drop in production of about a 60 percent to drop to 2009 levels.
Texas really doesn’t have much to worry about.
260,000 wells to abandon in the next decades by companies who are mostly bankrupt, this does not look good
Peabody Energy about to go bankrupt?
http://www.truth-out.org/news/item/34981-peabody-energy-the-fall-of-the-world-s-biggest-public-coal-company
Ron – On your Non-OPEC Production Change charts, where are Angola and Nigeria?
Angola and Nigeria are OPEC members
They are not there at all because Angola and Nigeria are both OPEC countries. But since January 2011 Angola is up about 100,000 bpd and Nigeria is down 400,000 bpd.
Sometimes I even amaze myself how clueless I am.
clueless,
Welcome to the club.
” Texas really doesn’t have much to worry about.”
3X Price increase and then a 4X Collapse in a single decade 🙁
Who you going to call? Next wave – Houston 2016-02-25
“The world’s second-largest oilfield services provider said last month it cut nearly 4,000 jobs in the final three months of 2015. With the latest layoffs, the company will have let go of nearly 29,000 workers, or more than a quarter of its headcount since staffing reached its peak in late 2014.”
http://www.worldoil.com/news/2016/2/25/halliburton-cuts-another-5-000-jobs-to-cope-with-downturn
BTW – Who is the Largest P&A Firm? Bet they will require Cash up Front.
Posted on Energy & Capital
China is Doomed
China’s Crisis is Here
By Christian DeHaemer | Thursday, February 25, 2016
China is doomed. Its economy will fail, and the political leadership will be cast asunder in a leaderless revolution that could result in the deaths of millions of people.
Just last night, on the eve of hosting the world’s leading central bankers, the Shenzhen Composite Index fell 7.34%. This drop took back most of its 10% dead-cat bounce over the last month.
China faces a cyclone of headwinds both in the short term and in the long.
This week, almost 1 trillion yuan in repurchase agreements are coming due. At the same time, the People’s Bank of China pulled 455.5 billion yuan of short-term loans out of the market last week.
These movements have stoked fears of a liquidity crisis and pushed short-term rates higher.
There are mounting risks for Chinese banks and insurance companies. You might remember these themes from the Lehman Brothers and AIG crisis in 2008.
Short-term rates go up, LIBOR prices jump. Firms don’t trust each other and stop lending. Loans don’t get rolled over. The wrong Jenga piece is pulled, and then the whole kit and caboodle comes clattering down.
Currency Pegs and Revolution
The thing is, China isn’t as lucky as the U.S. It doesn’t have a floating currency; it has what is called a currency peg. This means it is linked to the dollar at 6.5 yuan to the greenback.
The problem is that the dollar has appreciated 35% over the past two years. It is a great time to buy Spanish vacation houses if you are American. But it is bad if you rely on export growth as a social contract.
To cover the strong dollar, China needs to drop its currency to around 8.5 to the dollar. This will also make it easier to cover the large internal debts in the country. In 2014, China had an official total debt-to-GDP of 282%.
That’s the highest of any advanced country and is severely undervalued due to the country’s large shadow banking industry.
The problem is that China imports a lot of food and its economy is the slowest it has been in 25 years. In 2005, the country imported $10 billion worth of food. In 2014, it was $482 billion. All the while, the amount of arable land per population has dropped to 20 acres per 100 people.
Food Riots
According to Geoffrey Crothall of the Hong Kong-based group China Labour Bulletin, there is a bull market in labor protests.
Its data shows that in December and January, there were 774 labor strikes across China, up from 529 in the previous two months. Most of them were because workers didn’t get paid — sometimes for a year.
Strikes doubled in 2015 from 2014 and are still growing.
Information is hard to come by, but we know that factories are closing. Real estate builders aren’t paying workers.
There are massive layoffs in the coal mines — 100,000 workers at Longmay Group have been fired.
According to Business Insider, last year, the Middle Kingdom spent $125 billion on riot gear. Its first response to unrest has been a show of force.
We know — and believe me, the Chinese leadership knows — that the one thing that leads to revolution is the lack of food.
When folks say our economies are OK; or we can all spend a little more on fuel I ask myself how our economy could could grow? Today we supposedly have a good low unemployment rate; but we are rapidly changing jobs in factories for jobs at McDonald’s and Walmart. Worse, in other parts of the world (Greece, Italy, Portugal, Venezuela, China, etc) young folks are walking back to the country side after finding no jobs in the city. I don’t believe the world economy will grow much more, and this will be the first sign of peak energy if we see it.
In my own life I don’t expect anyone to see peak oil. What I expect instead is a declining standard of living. I work as a Firefighter for a small City. Small enough and shrinking for the last fifty years; that I project no more paid FF’s with in 10 years. Fortunately I am old enough to have left by then. I am also a small farmer. For my friends that are also small farmers I expect our rich markets to shrink, but if we are smart we can still continue to provide food that local folks might need. Changing economies. The price of oil can stay low in these circumstances as supply dwindles along with everything else.
Donn Wrote:
“In my own life I don’t expect anyone to see peak oil. What I expect instead is a declining standard of living”
Peak Oil and economics are tied at the hip. If living standards decline then the demand for oil will also decline. Thus less investment in Oil/Gas Production causing a peak.
If some how Consumers and Business could afford much higher oil prices > $120/bbl than I think Peak production could be deferred perhaps as much as another decade. However that seems impossible in a debt laden economy when consumers need 10 year car loans.
It seems to me that since the 2008-2009 crisis the world managed to hang on with a massive borrowing bing in the BRICs (mostly China, Brazil and India). The BRIC have now reached peak debt and and they can no longer sustain growth. Now that consumers and business can no longer use debt to fund growth, its going to start declining.
At the best (perhaps worse) I think China could defer a severe economic crisis by switching from industrial keynesianism to Miltary keynesianism. This would likely start a global arms race again and probably defer a crisis for a few more years. but like the early 20th century it will end with another global war. Soon or later some one will use their miltary investment to occupy foriegn lands in order to obtain the resources need to sustain their population (hint: China)
If China falls, the rest of the world will take another breath of fresh air, thinking growth will go on forever.
A classic line from old movies set in the south comes to mind, when mention is made of twenty acres of arable land per one hundred people.
As the fat old sheriff used to say to the young guys he arrested , ” You in a heap o trouble boy. ”
One of these days, maybe this year, maybe five years from now, or fifteen, but not forever, we are going to have a really bad year, in terms of harvests, world wide, and the shit is going to hit the fan fast and furious.
The carry over of grain from one year to the next that plagued farmers for most of my working life no longer exists.
Whether the USA will be willing to make the sacrifices necessary to prevent wide scale famine is an open question, and whether we would even be ABLE to cover critical shortages of staples is questionable, depending on the scale of the shortfall.
No other country has enough spare farming capacity to help much in the short term.Canadian farmers for instance are as good as any, but there just aren’t that many of them, and they would need a year or two to get a lot more land into cultivation. Ditto the Russians, they just don’t have the machinery and man power in place to expand production rapidly on short notice.
We yankees could conceivably slaughter half of our cattle, hogs and chickens, and thus free up a humongous amount of grain for export. Whether we would ever actually do so is highly questionable in my opinion.
Personally I doubt that big a sacrifice would fly politically.
Mac,
Canada already exports a great deal of grain. Not much land is fallow.
http://cafta.org/pages/agri-food-exports/wheat/
“In 2014, Canada produced more than 29 million tonnes of wheat, almost 5 million of which was durum.
Total wheat exports in 2014 were 24 million tonnes of valued at $7.9 billion. Canada exported 5.7 million tonnes of durum valued at almost $2.1 million.
Durum exports are highly concentrated with over 70% of all exports destined to the top 5 markets including Italy (25%), Algeria (14%), Morocco (13%), the U.S. (13%), and Venezuela (6%). In 2014 Canada exported almost 18.3 million tonnes of non-durum wheat varieties valued at $5.7 billion to over 60 countries. The top export markets were the U.S. (14%), Japan (8%), Indonesia (7%), and Peru (6%).
Yeah, the amount of land that is fallow in relation to the amount under cultivation is small, and the farmers still farming are generally busy as hell, because the only way you can survive is to stay busy, and be as big as you can be.
Thirty million tons is a lot, until you start thinking about people by the hundreds of millions and the billions.Then it looks pretty small, on a per person per day basis, planet wide,around a hundred pounds per capita if I can still do back of the envelope arithmetic in my head.
We yankees are just more numerous, pure and simple, and so we could expand production more. But the only way we could hope to offset a really bad crop failure, a catastrophic failure, in Asia, on short notice, would be to slaughter our most of our livestock, which would free up most of our grain production for human consumption.
Mix in forty percent wheat flour, the way my Momma always made corn bread, and the nutritional profile of corn bread is much improved. Ya can live on it and potatoes and some milk and greens, lots of people have and still do.
Here is the easiest GOOD corn bread ever made. One cup self rising white cornmeal, two thirds cup self rising flour, stir well, add milk sufficient to make a batter that will pour, barely, pour in well seasoned hot ten inch well buttered or greased ( bacon fat second choice, corn or canola oil ok third choice ) ten inch skillet, bake in 425 over for twenty five to thirty minutes until browned. Crunchy and buttery on the outside, just chewy enough in the middle. Best hot.
DO NOT mistake corn meal mix for corn meal.
Will we ever stop using fossil fuels?
Christopher Knittel
Not without a carbon tax, suggests a study by an MIT economist.
Peter Dizikes | MIT News Office
February 24, 2016
In recent years, proponents of clean energy have taken heart in the falling prices of solar and wind power, hoping they will drive an energy revolution. But a new study co-authored by an MIT professor suggests otherwise: Technology-driven cost reductions in fossil fuels will lead us to continue using all the oil, gas, and coal we can, unless governments pass new taxes on carbon emissions.
“If we don’t adopt new policies, we’re not going to be leaving fossil fuels in the ground,” says Christopher Knittel, an energy economist at the MIT Sloan School of Management. “We need both a policy like a carbon tax and to put more R&D money into renewables.”
While renewable energy has made promising gains in just the last few years — the cost of solar dropped by about two-thirds from 2009 to 2014 — new drilling and extraction techniques have made fossil fuels cheaper and markedly increased the amount of oil and gas we can tap into. In the U.S. alone, oil reserves have expanded 59 percent between 2000 and 2014, and natural gas reserves have expanded 94 percent in the same time.
“You often hear, when fossil fuel prices are going up, that if we just leave the market alone we’ll wean ourselves off fossil fuels,” adds Knittel. “But the message from the data is clear: That’s not going to happen any time soon.”
http://news.mit.edu/2016/carbon-tax-stop-using-fossil-fuels-0224
FF’s cheaper! Only if you don’t count the cost. The cost is quite possibly the biosphere.
ANYTHING is cheap if you don’t count the cost.
If homo sapiens is too stupid to see that, then it deserves what it is hell-bent toward getting.
As for all those other nice critters, well, better luck next time, which might be never.
I have long thought that the explanation for Fermi’s paradox is real simple. Fossil fuels kills ’em when they find it. They never get off their planet. They get clever way before they get wise.
Sigh. Why don’t people just listen to me? They would be SO better off.
I hear ya loud and clear Wimbi,
Hi Wimbi,
I know YOU know, but most engineers DON’T, apparently.
Engineers design things, and they include the necessary safe guards and backup systems they think will be needed to make those things work in a satisfactory fashion.
We are machines designed by the INSANE or INDIFFERENT engineer we refer to as evolution. Evolution doesn’t give a flying you know what about long term consequences of faulty designs. Evolution is INCAPABLE of giving a hoot about ANYTHING.
Evolution does not provide brakes, unless brakes have been PROVEN ADVANTAGEOUS in the continuous lab exercise we call survival of the fittest.
Boats don’t have brakes because they stop very quickly by themselves once you shut off the engine, so engineers don’t put brakes on boats. Evolution has not put any brakes on our drive to consume because none have ever been needed until NOW.
Evolution doesn’t give a flying xxxx about environmental destruction. Evolution destroys what it creates with utter indifference. Evolution created or invented photosynthesis, and consequently destroyed most of the biosphere.
If we wipe ourselves and most of the biosphere out, evolution still won’t give a shit. The mad, blind, indifferent engineer will replace every thing lost with something new.
We don’t have brakes that allow us to control our desire to consume because such brakes have never been necessary or advantageous in the past.
“Boats don’t have brakes because they stop very quickly by themselves once you shut off the engine, so engineers don’t put brakes on boats.”
OFM – you know tractors, but your lack of boating experience may be showing. A boat does require brakes. Boats have significant mass and maintain considerable momentum. Their hulls are designed to slip through the water with minimal friction. That means they can end up coasting a long, long, way before they naturally stop. In many WWII naval battle movies, you’ll hear the captain or 1st mate in the bridge order “all engines reverse”. That means PUT ON THE BRAKES. Reversing the propellers creates reverse thrust and brakes the boat. “Reverse” is used way more for braking than for actually backing up the boat.
Sailboats also use “reverse” braking procedures. It’s called “backwinding” the sails. They move the sails so that they capture the wind from the front, which creates reverse thrust and brings them to a stop.
I suppose I should have said SMALL boats. I have owned four , and ridden in a couple dozen more. None of them had a brake pedal. LOL.
Unless the wind is blowing, or a current is moving a boat, it stops pretty damned quick when you shut off the engine or quit paddling.
Really big boats, meaning ships, do need brakes of course. I have read that a large fast ship will “coast” for as much as a couple of miles if the engines fail.
Hey! The insane one is the MANAGER, not us simple engineers who just do what we are told because we can do it and it’s fun, until, one day, we wake up to the insane fact of the manager, and then, if we are good little engineers, we go off and start doing something sane all on our own.
Then we discover, surprise, surprise, that sane stuff is even easier and even more fun.
On boat brakes, I’m sure you know that little ships tried to follow the splash, so the big bad guy would make his aim correction wrongly every time, and the little destroyer could keep up his heroic smoke screen until the big one got smart.
Then, BLAM, and so much for that little bastard.
Meanwhile, took a hell of a lot of braking.
My father was managing offloading on Leyte when the big bad guys showed up on the horizon.
Thrilling!
Wimbi a voice of reason. Maybe not in the US but the rest of the world is clearly moving towards costing those externalities of fossil fuels more internally.
Small shifts in price signals will lead, over time, to big changes in demand. The US,while very important, is not in control of the demand picture anymore.
As for all those other nice critters, well, better luck next time, which might be never.
Nice tune for Y’all! ‘Cambrian Explosion’
https://goo.gl/QVIN0e
BTW, question for our resident climate change denialists, do you have a plausible explanation for the reduction in pH of the oceans? Don’t bother answering, that was just a rhetorical question.
With Halcon and EOG releasing 2016 guidance, estimate the following companies:
QEP, SM Energy, Enerplus, Continental, Marathon, Oasis, Hess, WPX, Whiting, Newfield, HRC Operating (Halcon) and EOG…
will complete in between 200-250 Middle Bakken and/or Three Forks wells in 2016. This is just an ESTIMATE, as the companies report this guidance in many different formats, and in gross and/or net wells.
The remaining companies with rigs running are XTO, Burlington, Statoil, Liberty and PetroHunt. I cannot find Bakken specific 2016 guidance for XTO (ExxonMobil) Burlington(COP) and Statoil. If anyone finds this, please post it.
PetroHunt and Liberty Resources, I believe, are private companies. They each have just one rig running.
The above companies, I believe, are the only ones running rigs in the Williston Basin at present. Clearly, there are other companies that have, and that could have DUCS to complete in 2016. Anyone with any information on those, please post.
FYI, it appears the bulk of the completions will occur in Q1.
Shallow,
With those sort or numbers, we will nearly be able to count the number of rigs drilling in the Bakken, on our fingers and toes! And if XTO cut their 5 rigs to similar to their competitors, we will!
Toolpush. Went over those numbers with Rune, he came up with a little higher number than me, so I will revise that to 250-325. Still a very low number for the large number of companies involved.
If these numbers hold, looking at as low a 900K bopd this summer from ND.
Shallow,
With companies like Whiting putting all their completions on hold, and I assume re-completions are included with that, it should be a great opportunity to see the real decline rate of these wells, without the interference of fluffy new IP rates getting in the way.
Of course they can still play with chokes, and vary the pump rate on their ESPs/pump Jacks, but that will be a short lived process, bringing tears in the end.
Just check out Enno’s site each time he updates it. For companies that already pretty much shut down completions in 2015, it is very telling.
More layoffs at Halliburton.
http://in.reuters.com/article/halliburton-redundancies-idINL3N1645ZO
a piece on demand. The author apparently does not read this blog. Too bad.
“The idea of peak oil supply — the notion that our reach (demand) for oil would exceed our grasp (global supply) — is dead. It appears instead that homo sapiens might just be wise enough not to over-reach, that we may voluntarily let go of oil (and coal) before they destroy a livable climate for the next 50 generations. Let’s hope so.”
http://thinkprogress.org/climate/2016/02/22/3720343/peak-oil-demand/
some more info on the Porter Ranch gas leak in LA.
The gas leak that forced the evacuation of 1,800 homes in the mountains above Los Angeles late last year was the largest methane leak in U.S. history and shows the climate risks of aging natural gas infrastructure, according to a study published Thursday in the journal Science.
http://www.climatecentral.org/news/california-methane-leak-largest-us-history-20077
The referenced study from Science
http://science.sciencemag.org/content/early/2016/02/25/science.aaf2348.full
If the petroleum industry can’t keep stored methane from massively leaking, is there really any credibility in arguing that Carbon Capture and Storage is a viable solution?
Brad Wall and the elusive goal of carbon capture and storage
Technology doesn’t eliminate greenhouse gases, but buries them deep underground
By Kyle Bakx, CBC News Posted: Dec 03, 2015 3:00 AM MT Last Updated: Dec 03, 2015 3:48 AM MT
It’s very hard for me to even imagine that CCS can ever be a better deal than putting an equal amount of manpower and physical resources into efficiency and conservation.
It’s true that coal is cheap right now, but it still costs quite a bit to transport it to market, so that the DELIVERED cost can be five or more times the mine gate cost, even here in the USA where we already have an extensive rail system to deliver it.
Good data is hard to come by, and may not even exist, but I have read in various places that it takes a full third of the electrical output of a coal plant to operate a CCS system for that plant alone. Nobody who seems to know anything about the topic disputes that figure, to the best of my knowledge.
If this is an accurate estimate, then CCS will drive up the price of retail electricity substantially, meaning the day that wind and solar power are truly cost competitive in most places will arrive that much sooner.
It’s possible coal plants might be built near the coal mines, and HVDC long distance transmission lines built to carry the juice to far away cities, but with lots of long distance HVDC transmission lines, we could use wind and solar farms to produce half or more of our electricity needs, maybe even three quarters or more, if the cost of storage comes down.
I wouldn’t be surprised if ten years from now it is possible to build wind and solar farms about as economically, all money costs considered, as it would be to implement ccs. Let’s not forget that the coal plant with ccs will require a steady stream, trainload after train load, of DELIVERED coal for the life of the plant, forty years or more.
A few really big wind and solar farms, once built, will require only a trivial amount of oil or other fuel to operate the necessary maintenance vehicles.
The arguments about wind and solar taking up too much land are pretty much pure bullshit. The land used for a wind farm can still be used for farming and forestry ninety percent as efficiently as comparable nearby land.
We can easily spare a few hundred acres here and there for solar farms, considering how much they contribute to preserving the environmental integrity of the other 99.99 percent of the land area of the world which will never be covered with solar panels under any circumstances.
I don’t have comparison figures but my guess is that an acre of solar panels in a good location will provide substantially more electricity, on a net energy basis, on average annually, than even the most efficient biofuel burnt as generator fuel.
The impressive figures tossed around about the amount of switch grass than can be harvested year after year, without applying lots of fertilizer, lime , pesticides, etc, on so called marginal land are total bullshit. Beyond that, drought and fire will take a toll some years.
There ain’t no free lunch on a farm. If land is highly productive, it’s NOT marginal, and could be used efficiently for crops, pasture, or forestry.
Operating the farm machinery needed to grow a biofuel crop, harvest it, dry it, and transport it to a power plant will take a big toll out of the net energy generation. Other than fixing broken stuff, a solar farm will just sit there, producing a copious harvest of electricity for decades, before the panels eventually degrade to the point that replacement is the best option.
Biofuels on the grand scale are a broad smooth highway to ecological hell.
BTW sportsfans, for all y’all we hate KSA types for not reducing their own revenue so someone else can get more . . . we got lotsa agricultural precedent you could lobby for.
Ya, why not pay them not to produce? You supply and demand disciples think that will get the price up and do harm to your citizenry . . . hell, the ECB is right now in the process of printing up a trillion QE Euros by September. What’s another few hundred billion? Just convince them Total and BP and Statoil need KSA to get some freshly printed Euros so they’ll save their oil for their grandchildren and cost citizens more for gasoline.
The US oils could write some checks, too, but in keeping with the overall attitude situation, they’d like someone else to take the hit.
This would be cool.
If anyone understands what Watcher is trying to say, please let the rest of us know.
Watcher, if you say things in a more straight forward manner, then people might catch your drift. Otherwise its just garbage under the bridge.
I understood him.
The US for years has paid farmers not to produce given crops.
Pay KSA not to pump oil.
Why use 20 words when a 100 will do.
Because that didn’t explain who would pay.
You still haven’t stated who you think it is that will pay, or explained why. I feel that perhaps you’re the only one who has any clue what it is that you’re trying to say. An echo chamber of one.
See, was that so hard?
Below chart shows the correlation between oil price and US FED production index.
On the left lower corner the US production index stood at around 85 in 1997. It took over a decade, unyil the production index finally started to respond to a higher price level in 2010. In 2015 the price fall did at least stop new production growth.
Should prices stay below 40 USD per barrel for a longer period it is very likely that the production index will fall steeply towards its initial level of 85. This is the level US production can sustain at the current price level. Time will tell.
Did you use an etch-a-sketch to make that graph?
Jef,
The data are the official data from the FED and I made the graph with Linux based Libre Office which is similar to Microsoft Office.
It looks like a hand made graph, yet is created on exact data with a PC.
I just posted a new update on shale oil production in the Niobrara in Colorado here .
Next week I’ll have a post on the Eagle Ford in Texas.
Enno. Thanks for the update. It appears that EIA has CO peaking in August, but you show Weld Co peaking before that.
Are there other significant Niobrara counties?
Shallow,
Not in Colorado. There are a few in Wyoming, but the total is less than in Weld county.
The wsj had a nice article on Tunisia and the causes of a steady export of extremist young men into isis
No mention of Mr. Browns’s net oil exports.
Jeffrey, was that formulation or idea your own or is their an earlier source? I had not read it before you, and it seems to me to be one of the most important ideas in the world
Also totally ignored by politicians and media
http://www.wsj.com/articles/how-tunisia-became-a-top-source-of-isis-recruits-1456396203?mod=WSJ_article_EditorsPicks_2#livefyre-comment
It’s just some pretty basic math.
Circa late 2005, I started wondering what happens to net exports in an net oil exporting country, given an ongoing production decline and stable to increasing domestic consumption.
So, I just constructed a simple model, and I was literally stunned at what the model showed. Following is a link to the model (ELM), the Six County Case History and the outlook for Global Net Exports:
http://peakoilbarrel.com/opec-except-iran-has-peaked/#comment-556985
Hi Jeffrey,
I’m trying to digest the very important take home message from the ELM.
Do you have a chart or data showing global CNE (cummulative net export)?
Did it peak in 2005?
Thanks
If you click on the above link, there are three relevant sequential charts.
The ELM and the Six County Case History show that as the ECI Ratio (ratio of production to consumption) declined, the rate of depletion in post-export peak CNE (Cumulative Net Exports) exceeded the rate of decline in the ECI Ratio.
Regarding Global Net Exports (GNE), i.e., what I define as the combined net exports from the (2005) Top 33 net exporters, by definition the remaining post-2005 volume of Global CNE (Cumulative Net Exports) has declined, the question is, by what percentage?
Excerpt from the third (GNE) comment:
When we get the 2015 data (and it would be nice to have the 2014 EIA data*), I suspect that an extrapolation of the 2005 to 2015 rate of decline in the Top 33 ECI Ratio will suggest that we have already burned through about one-third of post-2005 Global CNE.
*If the EIA does not release complete consumption data by this summer, BP will have released consumption data for 2015, and the EIA will be a full two years behind BP. The problem is that BP does not have consumption data for the Top 33 net exporters, but I may have to shift to tracking the top exporters that BP has consumption data for
I continue be stunned thinking about it all the time
The total of 950,000 oil wells worldwide, daily production of crude and condensate is 95,000,000 barrels per day, the per well average is 100 barrels per day.
176,180 of them are in Texas, 18 percent of the world’s total in Texas alone and 3 percent of the daily production, can’t shut down 176,180 oil wells because they are all stripper wells. Three percent of the daily production is a significant amount from one place.
Develop a drilling program worldwide, drill 10,000 more boreholes, you’ll have more oil.
The wind and sun are great sources to produce usable energy, but oil trumps by way of the simple fact of oil being able to be usable energy at the flip of a switch. Without it, everything you know will be wrong.
Some information on the Arctic:
http://www.arctic.noaa.gov/gallery_np_seasons.html
Winter
The darkest time of year at the North Pole is the Winter Solstice, approximately December 21. There has been no sunlight or even twilight since early October. The darkness lasts until the beginning of dawn in early March.
Spring
The sun rises at the North Pole on the Spring Equinox, approximately March 21, and the sun rises higher in the sky with each advancing day, reaching a maximum height at the Summer Solstice, approximately June 21.
Summer
In summertime, the sun is always above the horizon at the North Pole, circling the Pole once every day. It is highest in the sky at the Summer Solstice, after which it moves closer to the horizon, until it sinks below the horizon, at the Fall Equinox.
The North Pole stays in full sunlight all day long throughout the entire summer (unless there are clouds), and this is the reason that the Arctic is called the land of the “Midnight Sun”. After the Summer Solstice, the sun starts to sink towards the horizon.
Autumn
At the Autumn Equinox, approximately September 21, the sun sinks below the horizon, and the North Pole is in twilight until early October, after which it is in full darkness for the Winter.
http://www.arctic.noaa.gov/gallery_np_seasons.html
Have to learn something from that info.
The total of 950,000 oil wells worldwide, daily production of crude and condensate is 95,000,000 barrels per day, the per well average is 100 barrels per day.
According to the EIA, crude plus condensate, in October, stood at just a tad above 80,000,000 barrels per day. If your figure of 950,000 wells is correct then that puts the per well average at about 84 barrels per day.
The 950,000 is from here:
http://www.answers.com/Q/How_many_oil_wells_in_the_world
“There are about 950000 oil wells in the entire world. Of those, 530000 are located in the US!”
A rather dubious source, I know. It was for the purpose to find out approximately how many, just to know.
From the Wilderness Society:
“More oil and gas drilling occurs in America every year than anywhere else in the world.
Since 1950, 2.6 million oil and natural gas wells have been drilled in the U.S.
By the end of 2009 there were a combined total of 824,847 producing oil and gas wells in the United States.
As of the first week in February 2011, there were 1,739 rotary drilling rigs operating in U.S. lands and waters, more than in any other country in the world.”
https://wilderness.org/sites/default/files/Fact%20Sheet%20Drilling%20in%20America%20February%202011_1_5.pdf
Found this during the search:
http://www.geohelp.net/world.html
c100AD – Plutarch described oil bubbling from the ground near Kirkuk in present day Iraq
OBVIOUSLY the solution to the intermittency issue with solar energy is to build a super giant floating solar farm for the North Pole, and a similar super giant solar farm near the South Pole, on the ice cap.
That oughta keep the construction union guys happy for a few decades at least. Also the people who will invent and manufacture the super conducting submersible transmission lines as well. 😉
Never been there myself, and don’t expect to go, but I hear the wind blows like hell in Antarctica, so we might as well add a few windmills down that way too. With the high wind speeds, they can be relatively small ones, and there aren’t any local people to complain about the spoiled views, or the noise , either. I am willing to bet at least one person reads only the first paragraph of this comment and takes it seriously. LOL
Actually a PV network that girdles the global equatorial region would do the trick and be a bit easier to build and service. It is always solar noon somewhere along the equator and there would be enough geographic and weather diversity to ensure that local cloud cover would not make a huge impact on net instantaneous generation.
It would be interesting to see the feasibility of a floating energy station in a sunny part of the tropics/subtropics ocean that would be combo solar, wind, and ocean thermal gradient (OTEC)-
http://energy.gov/eere/energybasics/articles/ocean-thermal-energy-conversion-basics
Watch out for typhoon zones (and narco-pirates) of course.
The title is condescending, and if 2015 is the peak it will be hard to ascribe it to the rise of EVs. Nevertheless their is significant demand destruction coming that should be factored into investment decisions.
The Peak Oil Myth and the Rise of the Electric Car
Tom Randall, Bloomberg, February 24, 2016
From yesterday’s EIA Natural Gas Weekly Update: “The five LNG export facilities currently under construction in the United States, including Sabine Pass, will have a total liquefaction capacity of 9.2 Bcf/d, which is equivalent to 13% of current domestic natural gas production. Nearly all of this capacity has been fully or partially contracted and is scheduled to be in service by 2019.”
I wonder if anyone sees a potential problem?
potential problem for who?
clueless,
Despite all the Chinese slowdown talk, China is importing commodities at a record pace (see below the chart for natgas imports, which increased by over 100% year over year).
Although 6 bcf/d (or 1 mill boe/d) of natural gas imports are much lower than the 7 mill b/d oil imports, the impressive growth rate reveals there is much room for future growth for natgas exports here.
The main question remains if the US can produce enough natgas at low costs. 9 bcf/d is nearly 15% of US production. The US is currently still a net importer of natgas.
Off topic:
http://www.sat.dundee.ac.uk/
Registration is free, easy, and you can view whole earth images from various space satellites out there in space.
You won’t regret signing up to see what you can see.
The Baker Hughes Rig Countis out.
US oil rig count down 13, Eagle Ford down 7.
Horizontal rig count down 19, vertical rig count up 8. What does this mean?
The Peak Oil Myth and the Rise of the Electric Car
http://www.bloomberg.com/news/videos/2016-02-24/the-peak-oil-myth-and-the-rise-of-the-electric-car
The Tesla Model III reveal is scheduled for the end of March. Tesla will begin taking reservations at $1k a pop the first of April.
I don’t think it is outlandish to say that this is likely the most highly anticipated car ever. It will be very interesting to see how quickly the reservations stack up.
One number I’m very interested in seeing is the rental price for a Model III once agencies start adding them to their fleets. Won’t that be an upside down world when you rent an electric car specifically for long distance travel?
I’ve no idea how long until fully automated cars are on the road, but it’s easy to imagine within a decade of today, renting a Tesla instead of paying for a hotel, and being able to make 6-8 hour hops across Europe or America while you sleep, waking up each day in a different city.
Lisbon to Trondheim to Helsinki to Moscow to Istanbul and wherever you may whim between, and all with no fuel costs.
“..but it’s easy to imagine renting a Tesla instead of paying for a hotel, and being able to make 6-8 hour hops across Europe …Lisbon to Trondheim to Helsinki to Moscow to Instanbul and wherever you may whim between, and all with no fuel costs”
Bob,
I don’t think that is the direction in Euroasia.
You can travel right now from Lisbon to Kazan and Nizhny Novgorod on high speed train while sleeping at 0.1% fraction of the cost of Tesla.
http://eng.rzd.ru/statice/public/en?STRUCTURE_ID=4342
Hi Ves,
Don’t get me wrong, I love rail travel. That is how I have always traveled when in Europe.
The unique thing that a rental Tesla would provide is access off of the well beaten, well traveled, touristy pathways.
I provided poor examples by naming major cities.
Bob,
Yes for sure rental EV could find a niche but main load is hub to hub by train.
There are still a few relevant 10K’s to be release by E & P companies for 2015.
However, thought I would share some aggregate numbers from some large US E & P’s. Keep in mind that these companies mostly have overseas operations, and I am finding that the numbers with regard to PV10 are much better for those assets than for US assets.
Anadarko, ConocoPhillips, Occidental Petroleum, EOG, Marathon Oil and Chesapeake account for over 4 million BOE.
Ending 12/31/2015, total long term debt for these companies was $70.338 billion dollars.
Ending 12/31/2015, standard measure PV10 for these companies was $67.205 billion dollars, using WTI of $50.28 and HH of $2.58.
In looking at smaller companies, I am finding that the majority have lower standard measure PV10 than long term debt, and the few that are higher are barely.
Thus, preliminarily, it appears that the present value of future cash flows for US non-integrated public oil and gas companies, discounted to 10% is less, in aggregate, than aggregate long term debt for these companies, at $50.28 WTI and $2.58 HH.
Finally, given we are significantly lower on both WTI, and HH at present, I will note a few companies have disclosed PV10 at lower price points. It appears to me that PV10 drops by about 50% at $30 WTI and $1.75 HH.
One can argue that in this low interest rate environment, PV10 is too high, we should use a lower discount rate, which would push the values higher. I can see merit in that argument. However, given the distress in the debt markets, E & P debt requires a very high premium to US Treasuries in most instances.
In any event. the idea that oil and natural gas will stay below $50 and $2.50 does not appear to be possible in my view. without one of the following:
1. Substantially increased worldwide oil production.
2. Substantially decreased worldwide oil demand.
I think Ron has shown that 1. will be very difficult, he would say impossible.
So far, since 2005, world oil demand has only fallen one time year over year. That was 2008-2009.
Oil and natural gas prices have overshot, IMO, but the market can stay irrational much longer than most can stay solvent.
Take a look at the finding and development costs for SWN from drilling. $6/MMCF. There is no drilling in the Barnett or Fayetteville. These two basins make up about 8% of US gas production.
CLR is booking PDP per drilled in 2015 at about 190K/well. That’s quite a bit different from the 900k Hammy likes talking about. The high breakevens for the Bakken are finally being exposed.
190K is EUR per new wells?
Did he really say that average EUR is 900k?
Sorry, 850K. From CLR’s Q4 press release:
“Given its plans to defer most Bakken completions in 2016, Continental expects to increase its Bakken DUC inventory to approximately 195 gross operated DUCs at year-end 2016. The year-end 2016 DUC inventory represents a high-graded inventory with an average EUR per well of approximately 850,000 Boe. At year-end 2015, the Company’s Bakken DUC inventory was approximately 135 gross operated DUCs.”
From an analyst named Frank, who posts on Yahoo. His calcs look right to me.
“Look at the 10-k reserve and production data – proved developed only of course.
In the Bakken
They added 180 net wells in 2015
They produced 38 mm BO and 47 mmcf ng or 46 mm boe
Reserves declined 15.5 mm BO and ng reserves increased by 16.2 mmcf or 2.7 boe
Therefore reserves declined by 13 mm boe
So adds from new wells was 46-13 = 33 boe from 180 wells. That is 185k boe per well. A little shy of 800k.”
”CLR is booking PDP per drilled in 2015 at about 190K/well.”
Is this CLR’s net oil (that is, adjusted for royalties and Working Interest)?
Further wells that started to produce in 2015 has at varying degree extracted some oil.
I have completely lost any faith in the JODI numbers
http://www.theoildrum.com/node/9721#comment-935962
Did you find a new religion?
Lol,I think Marmico has a crush. Staaaaaaalker!
Shallow,
Perhaps Moody’s is reading your posts carefully here at POB. Here is a link to a Bloomberg article that discusses Credit down grades for Exxon, ChevronTexaco,Marathon and ConocoPhillips.
http://www.bloomberg.com/news/articles/2016-02-25/exxon-has-aaa-rating-affirmed-by-moody-s-with-negative-outlook
John S. I think every oil producer and every gas producer in the world should be downgraded.
Imagine if Coca Cola suddenly saw the price for its products across the board fall 70+%. Or 3M. Or Honeywell.
What if Google, or Apple or Microsoft had revenue cut by 70+%?
Only the integrateds have any defense, and even they are hurting badly.
I have harped on this for a long time. Almost none of the US or Canadian companies are creditworthy at $50 WTI. Hedges are rolling off. Credit lines will be cut.
Once I think everyone has reported I am going to add up the standard measure PV10 and the long term debt for as many US companies as I can find. Won’t take long, I have a lot of it already.
Raw Energy on Seeking Alpha may beat me to it. I highly recommend his articles, for those interested.
I did a little banking business yesterday and my banker did not look very happy. I heard that a pipe business is headed for bankruptcy and that its assets are worth 20 cents on the dollar. Looks like the creditors are going to go for liquidation rather than restructuring.
I can’t see this getting any better for quite a while. But one of my very few remaining Houston contacts asked me this week if I knew of any oil properties that could be acquired. But everyone still wants to flip in 3-5 years.
Then he told me that Flipino workers are now displacing American Gulf of Mexico offshore workers. What could go wrong with that?
Did you say Macondo?
Insanity is the new normal!
Make what you will of this.
My own gut feeling is that while the warming trend may not be steady from one year to the next, or one decade to the next, it will continue to get warmer, over any period of a few years duration.
At various times, different negative feed back effects will probably change the rate of warming in ways that are not easily predicted, or understood, except in hindsight.
http://www.scientificamerican.com/article/did-global-warming-slow-down-in-the-2000s-or-not/
Olfarmermac,
The fact is that climate scientists were not able to predict a slowdown in warming rate and in fact predicted the opposite. Their models running on very high climate sensitivity did not allow for such slowdown and are running too hot.
It demonstrates that climate scientists do not understand climate very well and their predictions are not to be trusted, much the less to be used to implement global policies.
The reaction of some scientists, like Tom Karl was to tweak the temperature databases so they show more warming.
Climate activist Lewandosky published an article on a scientific journal going as far as to say “that discussing climate change using the terms “pause” or “hiatus” creates notable hazards for the scientific community.”
The practical consequences of the pause are that we might not see much warming for the next decade and half, which is what I have been saying all along. We might even see some cooling.
This greatly diminishes the dangers of global warming because if natural cooling might stop or reduce the warming, natural warming is equally likely to be contributing to the warming periods.
Climate science is far from settled.
Perhaps you should apply for a job at NASA and sort all those idiots out. Then maybe they can make some real progress.
Javier said- “Climate science is far from settled.”
I couldn’t agree with you more on that. Although I personally think we have a greater than 50% probability of global warming causing big impacts [on lowlying cities and yields of staples] during the lifetimes of those alive today. I certainly wouldn’t exclude the other possibilities- 1) no discernible trend 2) big climate gyrations 3) significant cooling
Regardless of what we guess to be the future, the big questions is what policies should adopted to address our collective best guess. My inclination would to have a carbon tax starting low, and slowly escalating. The proceeds would spent on two things. One would be helping low income peoples with transitions related to fossil downsizing. Secondly, there would be massive spending on energy efficiency, modern grid, and solar/wind buildout. And there would be no ability to siphon off the money for other uses.
My two cents.
We need to invest fossil fuel energy into renewable sources of energy. If we decarbonize our energy input we will surely fall into Tom Murphy’s energy trap.
Javier, I doubt one can run a modern industrial society on ‘renewables’; better fission reactors would kill two birds (or more) with one stone, burning the stockpiles of transuranic waste/ superfluous military plutionium that otherwise have to be somehow stored geologically, whilst creating a source of cheap dispatchable electricity. The problem is the lack of interest in fusion research following various water cooled reactor failures (three mile island, chernobyl, fukashima and way back – the SL1) that drove the price of nuclear energy beyond economic feasability.
Fast reactors as transuranic waste burners:
https://www.youtube.com/watch?v=J2SqR_Liqys
Sodium cooled, so positive void coefficient, but huge burnup – pity the integral reactor program was shelved.
A new simple molten salt based reactor:
https://www.youtube.com/watch?v=YMID8SsyMV8
the coolant apparently has a big negative void coeffient due to inelastic neutron scattering from flourine. Claims to be cheaper than coal and walk away safe. Claims to be adaptable to thermal neutron designs, and thorium breeding. Claims to use use anodic protection to enable use of standard nuclear certified stainless steels in the salt bath. Uses the big coefficient of expansion of salts to control reactivity, along with doppler broadening. 20% burnup?. Got to be worth a shot?. What else is to be done with the piles of old transuranic waste?.
IanH,
Definitively nuclear should be in our arsenal. As you say it is currently uneconomical in Western societies (see for example Hinckley C problems), but new developments could bring it into feasibility.
Javier said:
“It demonstrates that climate scientists do not understand climate very well “
Yes, the climate scientists that do not understand climate very well are people like Richard Lindzen, Murry Salby, Judith Curry, Roy Spencer and other AGW deniers.
This is my skewering of Lindzen’s “renowned” model of QBO — http://contextearth.com/2016/02/13/qbo-model-validation/ . He retired without getting it right, essentially spinning his wheels during his entire tenure of 40+ years at MIT.
You wouldn’t believe how crazy Salby is. Curry is a lightweight that barely has a grasp on physics. Spencer is a religious fundie crank.
The reason that climate science doesn’t appear settled is because these tools still yield some influence, and other scientists are too courteous to give them the boot.
I will agree with Jimmy and suggest that you follow the NASA folks and ignore the poor information you must be receiving.
Your criticism of skeptic climatologists doesn’t address the fundamental fact that climate scientists were not able to predict a slowdown in warming rate and in fact predicted the opposite, and that their models running on very high climate sensitivity did not allow for such slowdown and are running too hot.
At the very least their reason for skepticism is sound.
No, what I have is objective evidence of a well-known climate phenomena that a renowned AGW skeptic Richard Lindzen wasn’t able to figure out, even though he had been working on the scientific problem since the 1960’s.
http://imageshack.com/a/img921/2124/k0xw17.png
Like all science, one works on the fundamental problems first and then builds on that foundation.
Congrats, but younger scientists correcting mistakes in old theories is nothing new. That’s how it is supposed to work.
Nor does it change the fact that climate scientists do not understand climate well enough to make sound predictions on how much warming we are going to get in the future.
“Nor does it change the fact that climate scientists do not understand climate well enough to make sound predictions on how much warming we are going to get in the future.”
I agree! All of their predictions are way too conservative as illustrated by all the observations.
WRT the so called “slowdown in warming rate” it hasn’t happened. What has happened is that the ocean has absorbed way more heat at deeper levels than that which were being used in the standard measure of global heat. This was predicted and in the models but was not supposed to happen so soon and so strong.
This, by the way is NOT a good thing.
I suggest you google “sooner than expected” or “worse than expected” or any version of that and you will find thousands of AGW related hits.
As I am sure your masters will insist you can now rebut with your usual cherry picked talking points and misinformation. GO!
Why is it not a GOOD thing?
Since the early 60’s the 0-2000 m ocean has warmed by 0.06°C:
“Levitus et al 2012, recently, and Domingues et al (2008) and Levitus et al (2009) previously, have estimated the multi-decadal upper ocean heat content using best-known corrections to systematic errors in the fall rate of expendable bathythermographs (Wijffels et al, 2008). For the upper 700m, the increase in heat content was 24 x 1022 J (±2.S.E.) since 1955. This is consistent with the comparison by Roemmich and Gilson (2009) of Argo data with the global temperature time-series of Levitus et al (2005), finding a warming of the 0 – 2000 m ocean by 0.06°C since the (pre-XBT) early 1960’s.”
Source: Argo homepage at UCSD
Perhaps you can explain why, given the second law of thermodynamics and the low turnover rate of deep oceanic waters, should we be so worried about this tiny increase in temperature from the very cold oceans.
I understand that you don’t like my myth-busting of your beliefs, but you should not call the scientific information from official sources and published peer-reviewed scientific literature that I use and cite misinformation. It makes you look like a science denier.
No, it is that certain climate scientists, and in particular the ones that are known as AGW deniers, do not understand climate science well enough to comment as policy pundits.
This guy Richard Lindzen is a pretentious bully that has done a lot of bad for climate sciences, and I am doing my job of putting him in his place by debunking his theories.
Javier, I would do the same to you but you don’t have enough clout to do any damage.
It is not up to me to judge your merits as a climate scientist versus those of Richard Lindzen. I suppose we will have to rely on publication record.
But since you claim to understand climate science better than other climate scientists, perhaps you can offer also a better temperature projection. What is in your opinion the increase in global surface average temperature that we are going to see in the next decade and half?
The important aspect is to understand the fundamentals of the climate system. The research literature shows a relationship between QBO and ENSO, which is the mechanism behind El Nino.
http://contextearth.com/2016/02/07/common-origins-of-climate-behaviors/
So the first order of business is to get rid of dead wood such as Richard Lindzen. He is retired now, but his ideas on QBO need to be permanently debunked.
Just what I thought. Given the abysmal record of climate predictions, no predictions is the new policy. We will let the press do the scaring without any scientific basis. After all common people are so dumb as to believe what they read in the press. We have a very good example in this blog with some people bringing scary press articles that have a very tenuous scientific basis. A little bit of skepticism on anything alarmist that the press publishes is a wise attitude for anybody on anything.
As the connection between ENSO and Global Warming. Perhaps, as an expert, you can illustrate us on such connection, because IPCC doesn’t find any. After all ENSO is natural variability and IPCC is unable to predict if ENSO is going to increase or reduce with Global Warming.
Of course the prediction is solid, 3C change for a doubling of atmospheric CO2.
CSALT is the modeling approach I use to evaluate the temperature signal.
http://contextearth.com/?s=CSALT&submit=Search
Yet to work CSALT for predictions, a model for ENSO is needed.
http://contextearth.com/2016/02/07/common-origins-of-climate-behaviors/
Trying for a comprehensive analysis.
“Perhaps you can explain why… should we be so worried about this tiny increase in temperature from the very cold oceans.” ~ Javier
It is a bigger increase than you frame it for one, and for another…
“There are much fewer observations below 700m, and the ocean below 2,000m has remained largely un-monitored. However, there is evidence of warming below 700m, and even below 2,000m. Careful processing of the available deep ocean records shows that the heat content of the upper 2,000m increased by 24 x 1022J over the 1955–2010 period (Levitus, 2012), equivalent to 0.09°C warming of this layer. To put this into context, if the same energy had warmed the lower 10km of the atmosphere, it would have warmed by 36°C! While this will not happen, it does illustrate the importance of the ocean as a heat store.” ~ Met Office
WebHubTelescope,
That prediction of 3 °C/doubling has already failed to hindcast real data, so it is not solid at all.
CO2
1958: 315 ppm
2015: 401 ppm
(ln(401)-ln(315))/(ln(315×2)-ln(315)) = 0.35 doub
Temp:
HadCRUT4 Anomaly
1958: 0.046°C
2015: 0.745°C
Increase: 0.699°C
Prediction: 0.35 doub x 3 °C/dob = 1.05 °C
Observation: 0.699 °C
Observation rate: 0.699 °C / 0.35 doub = 2 °C/doubling
Observation indicates that we could go to 567 ppm and see only 1 °C warming.
e^(0.5x(ln(401×2)-ln(401)))+ln(401)) = 567
At current rate of 2.2 ppm/year that increase (166 ppm) works out at 75 years. So 1 °C by 2090. If you want to be alarmed by that, it is your choice.
Javier,
You are confusing ECS with TCR. ECS is Equilibrium Climate Sensitivity and that is 3 C for a doubling of atmospheric CO2. TCR is Transient Climate Response and that is around 2C for a doubling.
So when you take the numbers as you do you get TCR, because the ocean acts as a thermal buffer. And you apparently can’t even do that right.
However if you look at land warming alone, then it is closer to 3C.
Unfortunately, the land is wear people live.
WebHubTelescope,
I am not mistaking anything. Yo said that your prediction was 3°C per doubling. I have shown you that for the last 57 years we have not got that.
According to latest publications scientific consensus is placing ECS (not TCR) at 2°C per doubling, based on observations. The following figure shows recent scientific articles with the values proposed for both ECS and TCR. You can right click on the figure and read the papers if you are interested.
So I guess observational science agrees more with 2°C per doubling than with 3.
I have done detailed work on qualifying TCR, for example here:
http://contextearth.com/2014/01/22/projection-training-intervals-for-csalt-model/
Remember that this is an effective TCR and ECS
That stupid chart you showed only includes recent results from the denier chump Nic Lewis. He is a master at obfuscation.
It is not only Lewis.
We also have
Annan and Hargreaves 2011
Lindzen and Choi 2011
Aldrin et al., 2012
Hargreaves et al., 2012
Ring et al., 2012
Van Hateren 2012
Otto et al., 2013
Skeie et al., 2014
All with ECS values significantly lower than 3. The trend is so clear that IPCC had to reduce again the lower bound of ECS to 1.5 in AR5.
I suppose you will dismiss all those articles as product of denier climatologists.
Javier mentioned:
I already pointed out how I completely debunked Lindzen and his theory of QBO here:
http://contextearth.com/2016/02/13/qbo-model-validation/
What is important is being able to get something as fundamental as this right before moving on to an analysis that you will be embarrassed by. The Lindzen & Choi temperature paper has been completely debunked here http://www.realclimate.org/index.php/archives/2010/01/lindzen-and-choi-unraveled/ showing that Lindzen&Choi “incorrectly compute the climate sensitivity” in what amounts to a “gravely flawed” analysis.
WebHubTelescope,
I mentioned eight articles defending a low value for ECS. Even if you were able to refute one, you would still have seven to contend.
Javier,
I do all my own independent research work, yet you are not able to challenge any of it.
It’s an absurdly fallacious argument for you to throw all these second-rate studies out there and expect me to waste my time with them.
Well WebHubTelescope,
I also don’t waste my time with non peer reviewed works. You would be surprised how many absurd theories about climate abound in the internet.
I am not aware that you have published anything about climate. Are you having troubles with the peer review system? It would be a shame with all those pretentious, bad scientists, dead wood deniers getting so many papers published.
Do you think that the peer review system is unfairly biased against believers like you and in favor of deniers? Because with 97% of the scientists agreeing on AGW one would think the opposite would be more probable, and deniers would have a harder time publishing their nonsense. Perhaps is some sort of affirmative action policy so they are not too discriminated against.
In any case good luck with that.
Javier, You have lost me with your logic. Lots of room for new ideas in regards to earth sciences. And lots of ways to work out the science via social forums. The Azimuth Project forum is a good place to hang and work out ideas.
http://forum.azimuthproject.org
Ok Caelan,
What you quote is that since we have few observations we don’t really know how much warming has taken place (although definitely less than 0.1°C), but we should be scared because the oceans have 1000 times the thermal capacity of the atmosphere.
I think you are not thinking what you are quoting. The oceans’ high thermal capacity is the reason we are here in the first place. The planet will not warm much because the oceans are very very cold and will soak huge amounts of energy without warming much. The second law of thermodynamics is very clear. For heat transfer it doesn’t matter the mass or the thermal capacity, what matters is the temperature, and an ocean at 4°C only poses a risk of cooling for the planet, not of warming. Thankfully temperature is very stratified or again we wouldn’t be here, but what we are finding is that most of the warming is taking place below 700 m. So again this is great, most warming where it is most cold. It all works in our favor.
So think about it again and tell me why we should be scared because the deep ocean has warmed 0.06°C over the last 50 years.
“Wait for the global cooling to kick in” ~ Javier PhD.
For a guy who recently stated he doesn’t care about global warming you sure don’t shut up about it.
Clearly you have run out of climate arguments.
Hold on to your beliefs, they don’t need no science to be the truth. Final climate judgement is nigh.
I recently read how some scientists created a model based on the affects on the planet of the cyclical solar cycles. The interesting thing was how the model also happened to greatly reduce any discernible affects of CO2 concentration on global temperature. What’s more, the programmers were able to ‘back up” the model and observe that it exactly tracked with what has actually been seen with the earth’s temperatures over the past 18 years, when the current ‘pause’ in global temperature increase began. This is all quite inconsistent with the behavior of the older (but ‘official’) models which have mostly failed to predict actual temperatures observed since the models were created. And the scientists wonder how skeptics are made?
As for the science being ‘far from settled’ let me second that sentiment, or, no, third it I guess. With books like ‘Dark Winter’ there is a lot more information out there these days about how conditions in outer space impact global temperatures. Also real scientists will tell you that nothing in science is ever really settled. After all, even gravity is still open to additional understanding and research.
The deniers’ obfuscation is tedious.
Scientific consensus: Earth’s climate is warming
climate.nasa.gov/scientific-consensus
What is there to be denied?
Global warming is evident to anybody old enough with some interest in watching nature.
The dangers of global warming are not. They remain an imaginary subproduct of an untested hypothesis whose predictions always fail.
So far we have received clear, demonstrable benefits from global warming since the dreadful, deadly times of the Little Ice Age. Anybody that believes that pre-industrial climate was better than present climate is STUPID.
What you posted is just opinion from academies that were asked to produce it by their funding provider. The imaginary dangers are not based on scientific evidence. Scientists opinion is not the same as scientific evidence. The distinction probably gets lost on you.
https://www.ncdc.noaa.gov/cag/time-series/global/globe/land_ocean/ytd/12/1880-2016
Pause? There was a pause from the late 40’s to the late 70’s. Since then, I don’t see a pause.
The latest year (2015) shows the greatest anomaly yet. The latest month (Jan 2016) surpasses even that. We are cooking the planet, plain and simple.
But if you wait about a million years and nothing else changes except the temperature all that heat will go into the deep oceans and everything will be shangri-la for the remaining species, which may or may not include multicellular life (sarcasm off).
Scientific consensus is that there has been a reduction in rate of warming in the twenty first century.
Here you have a special issue with over 30 scientific articles just from the Nature group of journals:
Focus: Recent slowdown in global warming
But, you can deny science.
Here’s the graph:
Clifman, you do realize that NOAA only hires scientists that deny the science, don’t you? It is beyond ridiculous to argue, as Javier does, that a reduction of the speed of global warming since 1998 to the present is any indication that we therefore have nothing to worry about. What’s that 18 years?! In terms of climate that’s a blink of an eye.
This so called hiatus is indeed part of the natural fluctuations. It doesn’t change the big picture or the long term trends. Climate continues to warm and that is still a problem and it is highly likely that it could again speed up.
You can watch this discussion in this link straight from the Nature link provided by Javier.
Join us for a panel discussion on the science and communication of climate change over the past two decades
http://www.youtube.com/watch?v=iunO85OkWeA&feature=youtu.be
BTW, Javier is a spin meister extraordinaire who is only interested in promoting somebody’s agenda, he isn’t really interested in actually examining any of the science in the very papers in his own link which more often than not contradict what he says!
It does because they are unaccounted. The final trend is lower and the outlook is not so dangerous.
You don’t know what interests me and you will have a very hard time demonstrating what you say.
I have said that the reduction in warming rate during the twenty first century is real and there are a ton of articles supporting my assertion. You will be able to find articles saying the opposite, but they are few and have less support.
Whether the future holds more or less warming, nobody knows. So far the models have not been very keen on their predictions.
This is figure 1 from Fyfe et al., 2016. The article that started this thread, showing the pause, and the effect with respect to model predictions.
I have said that the reduction in warming rate during the twenty first century is real and there are a ton of articles supporting my assertion. You will be able to find articles saying the opposite, but they are few and have less support.
I’m not saying it isn’t real I’m saying the conclusions you draw from that are at odds with the conclusions the climate scientists draw from it and they in no way think it changes the big picture one bit.
To try to argue that climate change is not a danger to the biosphere is ridiculous. As for your personal interests I couldn’t care less and they have no relevance to actual science, whatever they may be.
Fred,
“I’m not saying it isn’t real I’m saying the conclusions you draw from that are at odds with the conclusions the climate scientists draw from it and they in no way think it changes the big picture one bit.”
If the slowdown is real one inescapable conclusion is that the warming rate is lower than anticipated. The longer the pause the lower the final warming rate.
“To try to argue that climate change is not a danger to the biosphere is ridiculous.”
Why is it ridiculous if after 350 years of global warming nobody has demonstrated any significant ill effect so far?
The dangers of global warming are to date hypothetical and therefore it is not ridiculous to argue about them.
Why is it ridiculous if after 350 years of global warming nobody has demonstrated any significant ill effect so far?
I’ve spent most of my adult life diving on coral reefs trust me there has been a considerable amount of ill effect in that relatively short time period I have seen it my own eyes. and coral bleaching is aggravated by high water temps.
There are plenty of studies and papers by marine biologist who disagree with you.
Fred,
How are you so sure that the problems with the corals are due to warming and not to other things? We have several lines of evidence that suggest that the main culprits are not warming:
– Ocean contamination has been rising together with global warming but for a different reason. Contamination is known to be a very big issue in many coastal marine environments. A lot of damage from that.
– Overfishing of fishes that play an important role in coral reef maintenance is also known to be a serious issue. This is altering the ecosystem very strongly, a lot more than a little warming.
– We do know that the Eemian interglacial was significantly warmer than Holocene, yet corals seemed to have absolutely no problem with that warming. Indeed we measure Eemian high sea levels on ancient coral reefs that grew during that warmer times.
– Several studies indicate that corals have different mechanisms to adapt to warming and might be more resistant to warming than previously thought.
How are you so sure that the problems with the corals are due to warming and not to other things? We have several lines of evidence that suggest that the main culprits are not warming:
Javier do you really think I don’t know that there are multiple reasons for the problems with the corals? Of course warming isn’t the only aggravating factor and even though there are some coral species that may be more resistant than others the overwhelming evidence points to severe negative impacts of warming on corals.
Bravo Fred, well said.
My advice, don’t play with tar babies, it’s a big waste of time. That is the mission of the tar baby, stick you in one place and you never make any forward progress.
Getting back to oil. The car manufacturers did not start producing economical vehicles until after we were waiting in long lines to get gas due to oil embargo and later an energy crisis.
So we can expect a surge in fuel efficient and alternative energy vehicles in a few years as oil production decreases and prices go upward. The last time this happened, an oil glut followed. I doubt if any future glut will be driven by production. It may be driven by increased efficiency of ICE vehicles and a move away from the ICE powered vehicle, if it does occur. Then again, oil gluts may be a thing of the past.
Well Fred, I guess I was a day or so early with claiming Jan ’16 as the largest yet anamoly. Feb. kicked its butt. Warming appears to be accelerating faster than Javier can deny it:
http://www.slate.com/blogs/future_tense/2016/03/01/february_2016_s_shocking_global_warming_temperature_record.html
“The Old Normal Is Gone”: February Shatters Global Temperature Records
By Eric Holthaus
Our planet’s preliminary February temperature data are in, and it’s now abundantly clear: Global warming is going into overdrive.
There are dozens of global temperature datasets, and usually I (and my climate journalist colleagues) wait until the official ones are released about the middle of the following month to announce a record-warm month at the global level. But this month’s data is so extraordinary that there’s no need to wait: February obliterated the all-time global temperature record set just last mo
Update on EV – Electro-Chem
http://seekingalpha.com/article/3936476-tesla-gigafactory-challenge
LG’s Dominance so far.
https://www.youtube.com/watch?v=Q2Lczd7MjGc
Interesting animation about the collapse in US drilling
http://www.bloomberg.com/graphics/2016-oil-rigs/
Lots of talk about economy and growth. Anyone interested would do well to read “The End of Normal” by James Galbraith. Galbraith is saying basically the same thing John Michael Greer has been saying for a long time, but as a respected main stream economist, Galbraith’s message is all the more meaningful.
http://www.amazon.com/The-End-Normal-Crisis-Future/dp/1451644922
More spin at $30 oil
I have not had time to read it all, but have fun. I am sure the comments will be worth a read.
http://oilpro.com/post/22706/shale-2016-eog-resources-making-work-30-oil?utm_source=DailyNewsletter&utm_medium=email&utm_campaign=newsletter&utm_term=2016-02-26&utm_content=Feature_1_txt
Toolpush. I read that on Oilpro. It is a head scratcher, as I thought I read Bill Thomas had earlier said they need $80 oil to have a good business. He is EOG’s CEO.
Despite all the talk of technology, etc, the real measure of any business is an accurate measure of its future cash flows, and then application of an appropriate discount rate to those future cash flows, minus the debt.
EOG, like all other oil and gas producers, is required to disclose estimates of future cash flows in their annual 10K reports. They employ an independent engineering firm for this purpose.
Here is what they disclosed effective 12/31/14
Future cash inflows:$146.950 billion.
Future production costs:$51.633 billion
Future development costs$20.495 billion
Future income taxes: $20.495 billion
Future net cash flows:$51.636 billion
Future net cash flows discounted to PV10:$27.923 billion
Here is what they disclosed effective 12/31/15
Future cash inflows:$68.720 billion
Future production costs:$32.061 billion
Future development costs:$15.786 billion
Future income taxes $4.616 billion
Future net cash flows $16.258 billion
Future net cash flows discounted to PV10: $9.621 billion
Now, here is what happens to EOG reported numbers as of 12/31/15 if we drop their cash inflows by another 1/3, which is where prices are today:
Future cash inflows:$45.814 billion
Future production costs:$32.061 billion
Future development costs:$15.786 billion
Future net cash flows:-$2.032 billion.
EOG reported long term debt of $6.654 billion. Production fell from 2014 to 2015. Go to shale profile.com and look at their Bakken and Niobrara production drops. Soon Enno will have the Eagle Ford shale up, we can look at that to.
In my opinion, EOG released this presser because at current oil and gas prices, their assets have no value, absent even more cuts to production and development costs, which to me seem improbable. Even more cuts probably don’t get them to the ability to pay back debt, especially as the above cash flow calculations DO NOT include general and administrative expenses, nor debt interest expense.
I really hope readers will take the time to read this post. EOG is about the best shale company out there IMO. Yet, their assets cannot produce future net cash flows over their expected lives, in aggregate, at current oil and gas prices, without even further cost cutting. Even another 25% of cost cuts doesn’t get them close to servicing debt.
I ask anyone to tell me what I am missing. If there are any business media out there, please look this over and then report on it. Look at other major independents such as ConocoPhillips, Anadarko, Marathon, Chesapeake, Occidental, etc. I am sure that, with the possible exception of OXY, they are worse.
Also, for the oil traders out there, knowing that EOG is likely a more effective cost producer out there than over half of worldwide production, why don’t you explain to me the current futures strip?
Also, is anyone at the EIA looking at this?
My brother worked for Bill Thomas many years ago when it was Enron Oil and Gas. He bragged to me that they were the “Walmart” of the oil business.
Bill might be able to do this. As long as he lets every other employee go and slashes G&A down to his salary.
I had a division manager who told the world that he didn’t need employees. Give him a few contract workers and the company would do better than ever. Then Bob went out on his owns of be a management consultant. Never to be heard from again except on the golf course.
Shallow,
It might well be a part of PR campaign directed at refinancing of their debt. There are couple of additional questions here:
1. What is the quality of oil EOG producing? Is this mostly light staff ? What is the percentage of condensate? Can they get WTI price for it ?
2. When will their current loans be due? How much of them are due in 2016 and 2017 ?
I do not know oil quality or gravity, I assume it varies, they are a very large company. They do disclose product mix between oil, gas and NGLs. I will look it up.
The company 10K are very easy to find. Go to company website. Click the investor tab and then the SEC filings tab. Click on 2015 10K.
Almost all companies display the future cash flow projections near the back of the 10K.
It is some work to find, but not really too much. The 10K is the real dope on each company, or is supposed to be. No shiny investor presentations.
It is interesting how much EOG cut future production costs from 2014 to 2015?
I find it interesting that I am about the only person who reads 10K’s and cares about future cash flows. It is not rocket science. I’m not that smart. I think most here could handle it.
In any event, when I get time I will toss out some more future cash flow estimates for US E & P.
Shallow, I know you have been looking at info on conventional declines as well as shale. California is the number 3 producing state. According to their weekly notice summaries, they haven;t issued a drilling permit in the last 3 weeks, and only 41 in 2016. Permits to abandon are now at 246 in 2016. Baker Hughes has them down to 6 rigs. It will be interesting to see how their production declines, although they are slow to report.
I’ll try to put a link in. ftp://ftp.consrv.ca.gov/pub/oil/weekly_summary/Latestweek.pdf
dclonghorn. I am sure CA will decline.
California Resources Corporation (the OXY spinoff) is in dire straits.
Breitburn is also in dire straits, they are a significant CA producer. They didn’t answer questions on their conference call. I really don’t blame them, what is there to say?
Agreed, they will decline. How rapidly they decline is a big question to me. My understanding is that California oil production is characterized by a large number of shallow wells producing small amounts of oil each. Also, many of these advanced fields have been under water flood or steam flood for quite a while.
If $30 oil lasts very long, I would think that the decline rate could be as high as 3 percent a month due to high shut-ins and abandonment. I think a somewhat higher price would slow the decline a lot, as you would see normal depletion but would not see wholesale abandonment.
USA and international have other similar mature fields with large numbers of wells producing small amounts of oil each. If a number of these fields start seeing a high rate of shut-in and abandonment, there will be substantial declines.
From what I’ve seen, most production projections seem to be focused on the shale and offshore declines. I think we may see a higher than expected decline in these old fields. The Bakken has become the leading indicator of shale, and California may become the best indicator of how these post mature fields respond.
If I am not mistaken, Denbury, Legacy Reserves and Breitburn all reported in conference calls they that have shut in not an insignificant amount of oil production.
We have shut in quite a bit. Some places around here are pretty bad. One little field I go by sometimes had only one well pumping out of over 20. They all were on in 2014 and prior.
All very low volume wells, but they all add up.
I did some deliveries yesterday. I’ve recently been counting producing and idle pumps. The first leg there were 16 producing and 14 idle. The second leg there were 21 producing and 41 idle. Some of the idle ones may be on timers, and I don’t have a baseline to compare. Nevertheless, it seems like a lot of idle wells. This is in Kansas, lots of low volume wells. Also, significant differentials. Prices were down to $16 but have moved back to $22-23.
Denbury press release. 2015 production, 72,861 boepd, down 2% from 2014. Q4 shut in 1,700 boepd. Forecast 2016 64-68K boepd.
Breitburn. 55.3K boepd in 2015. Guidance 46.5-54K boepd. Shut in 650 boepd Q4 2015.
Legacy Reserves. 2015 45,135 boepd. No 2016 guidance. Quote from CEO.
“The other operational point I will make surrounds work overs. We routinely repair our wells across our entire portfolio and based on today’s price environment, if a well goes down, we may leave it off a little while because spending money on repair isn’t economically justifiable. Accordingly we expect to lose some wells in 2016, predicting that number of wells is nearly impossible”
Man, this stuff isn’t good at all. I have nothing against these guys, they are in the same boat as us, just have debt because they grew a lot prior to 2015.
[…] Source link […]
Never say never. LOL
We all need a laugh.
The world is full of strange things that will put a smile on your face.
http://www.latimes.com/local/lanow/la-me-ln-unicorn-20160226-story.html
How would you like to try to explain that you have just seen a unicorn in the road to a cop who has stopped to see why YOU are stopped ? Especially if it happens to be about the time Happy Hour is over?
I saw a giant white rabbit hop across Highway 71 after happy hour in Houston back in 1977. I was driving back to Austin. My buddy took away the key.
Sometimes there are nuggets of truth contained in stories or old books or manuscripts that at first glance appear to be absurdities.
I once read an English translation of a Chinese record of an exploratory expedition that got into the American West. The original is supposedly lost,and may have been a fake , but various copies of copies certainly do exist.
Errors and omissions have a way of creeping into copies of copies, and sometimes a monk would could include only an abbreviated version or summary of a longer document in an original work of his own..
So – This old manuscript mentions DOG HEADED people. Nothing could be sillier of course, BUT- as it happens , at least one tribe of American “Indians” are known to have wore dog masks as a part of certain rituals and celebrations.
So- the fact that this ( translated ) manuscript mentions dogheaded people does not necessarily prove it is a fake. As a matter of fact, the opposite argument could be made.
Nobody denies that Marco Polo was a real historical explorer. Why should we ASSUME he has no Chinese counterpart?
We don’t know half as much, sometimes, as we think we know. A few years back, the academics and other professionally trained people who authored lead articles at the old TOD site had me convinced that peak oil was staring us hard in the face, TEN years ago, and that hell would be to pay by now.
I still believe there will be hell to pay in respect to peak oil, but now-I am not at all sure there isn’t enough oil to keep us reasonably well supplied for at least another decade.
OFM – in the name of accuracy, actually lots of people dispute whether Marco Polo ever went to China. They think more likely there were many travellers, mostly Persian, and he picked up their stories. He was a merchant not an explorer.
http://www.telegraph.co.uk/news/worldnews/europe/8691111/Explorer-Marco-Polo-never-actually-went-to-China.html
Ron and Dennis,
I recruited a local statistician to help me look for an empirical model for (WTI) prices. It looks like we came up with something. If your interested in a guest post (should be ready in a couple of weeks), let me know.
Yes Ian, I am always interested in a good guest post.
Let me know what you have.
I have had some ideas about which variables to use to model prices for some time. I found a statistician extremely at home with R. I gave her a bunch of variables and asked her to look for relations between them. She spent a few weeks transforming them trying all sorts of things, and finally came up with a simple model with only 2 variables and an R^2 of about .3. With two variables you can’t hope for better than that. With 3 variables she got an R^2 of about .35, but the fewer the variables the more robust the model is (I will explain this in my post). What’s exciting is that the model can be used for predictions. That is, from the EIA STEO, the model can predict future prices, from which we can predict future investment. Thus we can see if their production predictions are consistent with the (profitable) investment required to attain their production numbers . I haven’t had time to look at the model closely and I don’t have the file. My preliminary impression is that the model is very bearish and that it indicates that Dennis’ idea of 2% economic growth is the tail wagging the dog. I want to see if we can test this rigorously.
Off Topic
https://www.youtube.com/watch?v=3dmV4sFe4Fo
An analysis of how Trump got his wealth.
It turns out if he had taken the 40 million he inherited and simply invested it in an S&P 500 index fund he would have as much wealth as he made with his “great” business decisions.
Shallow Sand
That was a very interesting post on the Pv-10 current value. I don’t think you’re missing anything. There will be another round of huge impairments when companies report the next 2 quarters. The only good thing for them is they dont have to do another pv-10 until next year.
Shallow, as usual, appreciate your thinking. (Male/Female shopping habits notwithstanding)
Greenbub, thanks. That was a one off, hopefully we are all entitled to some nonsense, provided we have the sense to immediately recognize it as such and apologetically retract it.
On the other hand, I will say I am finding some very interesting reports of future production costs in the LTO companies estimates of future cash flows.
I am trying to figure out if there is a good explanation for this.
I have only looked at four shale companies thus far, and then compared them to ExxonMobil. Exxon’s future production costs, in relation to proved reserves, makes sense to me. I am trying to figure out how the shale companies will achieve the tremendous reduction in future production costs they have just reported in their 10K.
I know costs have come down. However, those are mostly with regard to development costs. To me, production costs have not fallen that greatly, not 40-60% as the LTO companies are projecting.
The whole point is a small group of us feel that LTO is not profitable at $30, $40, $50, or even $60 oil.
There was a time when estimates of future net cash flows, and long term debt to an appropriate discounted rate of those cash flows mattered in valuing oil and gas investments. The ability to grow reserves mattered.
Shale absolutely turned that on its head.
So many in the US industry want to blame OPEC, and to a lesser extent Russia, for the current low prices. I think this is misplaced. If we stick merely to economics, which I am sure the leading OPEC members and Russia have studied intently, LTO simply cannot survive if prices remain at these levels, or even below $60. Much of it needs much higher. Why do I say this so directly? Because the companies’ 10K tell me this.
Some posters here surely run, or have run a business, or worked in an accounts payable department. Everyone here, I am sure, pays for food, utilities and other expenses. In budgeting for those expenses, do any of you lower your household expense assumptions 40-60% in just one year? With no significant change in household size?
Well, that is what I have found shale is doing, at least the first four I have reviewed. I hope there is a good, legitimate explanation for how this can be achieved, and not merely a trick to make sure PV10 exceeds long term debt.
S. Sand – have you any thoughts on the tar sands producers compared to tight oil? In many ways they seem worse off than shale, their only advantages are that they are slightly larger companies and the weakness of the Canadian dollar. A good few SAGD producers appear to be losing money on every barrel but have to keep running as shut down and restart up costs would be killingly high. I think no-one has ever shut down a SAGD operation for a long time after it has reached steady state (i.e. for long enough for the reservoir to cool significantly). As I understand it there is a risk that the reservoir and wells get flooded with water and don’t recover. If nat. gas prices start increasing (e.g. as US production falls and/or LNG exports start) the impact on SAGD which, to be profitable at the best of times, needs cheap energy from NG for the steam, could stay hurting even if oil prices start to rise at the same time.
And of course, there is a fair amount of “zombie” production in offshore producing areas, e.g., the North Sea, where the abandonment costs are so high that companies keep producing at a loss in order to kick the can down the road.
George,
There is no difference between shale and tar sands from the business model point of view other than one is short term cycle and other is long term cycle production. Business model of Tar Sand would be equivalent of selling prized black caviar (not the cheap red caviar) to the broke Walmart type of consumers in hope of making any money in the long term (50 years).
George. Admittedly I haven’t looked into tar sands economics.
The discount to WTI or Brent, to start with, seems to be very tough.
ConocoPhillips and Marathon have tar sands production, and I think they split it out from other areas. I’ll look at it, but probably not till tonight at the earliest.
Just saw a press release on China’s crude production for January. It says they are down 2.1 percent year on year to 17.69 million tons.
http://news.xinhuanet.com/english/2016-02/26/c_135133603.htm
An earlier release shows them producing 18.15 million tons in December 2015. That’s a one month decline of 2.5 percent.
http://news.xinhuanet.com/english/2016-01/25/c_135043850.htm
It seems that China’s oil production will decline this year.
From Bloomberg:
China Oil Output Seen Cracking Under Pressure of Price Collapse
http://www.bloomberg.com/news/articles/2016-02-05/china-oil-output-seen-cracking-under-pressure-of-price-collapse
• Domestic production forecast to fall first time since 2009
• Crude output may decline by as much as 5 percent: Nomura
China’s output in 2016 will decline between 3 percent and 5 percent from last year’s record 4.3 million barrels a day, according to analysts from Nomura Holdings Inc. and Sanford C. Bernstein & Co. That would be the first decline in seven years and the biggest drop in records going back to 1990. The country is the world’s fifth-largest producer and biggest consumer after the U.S.
“We expect significant cuts in upstream production as the companies cut output at loss-making fields,” said Neil Beveridge, a Hong Kong-based analyst at Sanford C. Bernstein & Co. “Chinese explorers need to take more radical action to cut operating costs and increase efficiency.”
CNPC plans to maintain crude output near 2015 levels, Deputy General Manager Wang Dongjin was quoted in a statement posted last month on the company’s website. The country’s biggest producer has only a “limited amount” of money to invest this year and will spend on oil and gas projects that improve efficiency or promote sales, Wang said.
Fellow state-run energy giant China Petroleum & Chemical, also known as Sinopec, said on Jan. 27 that oil and gas output in 2015 fell for the first time in 16 years as a slump in domestic crude production outweighed record volumes of natural gas.
Cnooc. Ltd., the country’s biggest offshore crude explorer, said last month that output will fall this year, the first time in more than a decade, as it accelerates spending cuts.
While some Middle East suppliers can operate with oil at $25 a barrel, the break-even cost for China’s Cnooc is closer to $41, according to Nomura Holdings Inc. analyst Gordon Kwan, who predicts the country’s domestic crude production will fall by 5 percent this year.
China announced last month fuel prices won’t be cut in line with crude as long as it trades below $40 a barrel. The National Development and Reform Commission said the floor is designed in part to shield domestic oil producers from the global price collapse.
“The policy is designed to provide explorers room to breathe,” said Laban Yu, head of Asia oil and gas equities at Jefferies Group LLC in Hong Kong. “China cannot afford to shut down domestic production no matter how cheap crude gets.”
The articles I referred to above show a decline in actual Chinese production of 2.5 percent in one month. China produces around 4 million bopd, so it is a top producer. Any producing area can show a lot of variability from one month to another and production could rebound or have a small decline next month, however 2.5 percent decline in a month is big.
As a comparison, If the EIA came out with actual USA production falling 2.5 percent in January that would be a decline of around 230,000 barrels per day from December 2015. That’s big!
On the other hand, Ron’s historical production charts for China do show a lot of variation from one month to next. I don’t know anything about xinhuanet which ran this report, or the National Development and Reform Commission which is supposedly reporting this information.
So that’s a 215 mbpd predicted reduction from the world’s fourth producer.
http://www.tradingeconomics.com/china/crude-oil-production
Click on 5 Yrs. Looks like relentless increase in Chinese oil production since mid 2014 when price decline started and when oil was > $100. Apparently EIA data.
No reason this can’t be so given they have their own central bank.
Nope, its an actual reported one month reduction of 2.5%. The data is in tons and I’m not sure how it would convert but it would probably be a little over 100,000 bopd.
My point was that rate of decline in the US would be about 230,000 bopd in a month, so it is a large percentage decline.
Changes of 2-4% in China’s monthly oil production are not unusual. More important, if this marks a change in long-term trend.
China oil production kb/d
(converted from tons using 7,3 ratio)
Source: National Bureau of Statistics of China
It is hard to say how free oil companies are in China to go their own way, as they see fit, when it comes to production policy. The government exercises an enormous amount of power over Chinese industry.
Now if I were a Chinese commie, in a high position, knowing my country has a huge stash of dollars possibly subject to depreciation due to inflation, I would opt to buy oil, and hold on to domestic oil in the ground inside the country.
It seems like a damned safe bet it will be worth a lot more in a few years than it is now, and the interest China earns on dollars is trivial.
“Now if I were a Chinese commie, in a high position … I would opt to buy oil, and hold on to domestic oil in the ground inside the country.”
That’s what they are doing. China is planning to increase its Strategic oil reserve capacity to 500 million barrels in 2020
source for the chart below:
http://www.bloomberg.com/news/articles/2015-09-17/even-a-slowing-china-is-oil-s-best-defense-against-deeper-slump
I was referring to Nomura’s prediction of a 5% yearly fall in China’s 2016 oil production. If it comes to happen this should set back production to 2012-13 levels.
China’s production has been increasing at an average of almost 2% per year for about 10 years now.
…. and even longer-term
China’s oil production, 2002-Jan 2016
sources: JODI, National Bureau of Statistics of China
(JODI uses conversion rate of 7.32 barrels/ton)
China’s mature onshore oil fields are declining.
This includes Daqing, China’s largest field, currently accounting for a fifth of the country’s output.
excerpts from an article:
“In late 2014, CNPC essentially threw in the towel on its workhorse field, Daqing, announcing that it would allow the field to essentially enter a phase of managed decline over the next five years. Under this new approach, the field’s oil production will fall from 800,000 barrels per day (kbd) in 2014 to 640 kbd by 2020: a 20 percent decrease.
Daqing’s oil production has declined relentlessly, despite PetroChina’s significant increase in drilling activity in the field during recent years. This suggests a significant risk that production could fall faster than planned. For reference, PetroChina drilled 1,975 development wells in 2002 when oil production averaged 1.079 million barrels per day, but was forced to boost this to 4,498 development wells in 2014, when oil output at Daqing averaged 792,000 barrels per day. In short, the number of development wells drilled increased by nearly 250 percent while oil production fell by roughly 27 percent.”
source: “China Peak Oil: 2015 Is the Year. By Gabe Collins. The Diplomat, July 07, 2015 [ http://thediplomat.com/2015/07/china-peak-oil-2015-is-the-year/ ]
The chart below is from the article
Daqing field oil production, ‘000 bpd
The plateau, 2008 – 2014, was made possible by infill drilling. I suspect that the decline curve will be steeper than indicated in the above chart.
China’s second largest field is Shengli, operated by Sinopec (China Petroleum & Chemical Corp.). Although Shengli is a mature field (discovered in 1961, developed since 1964), production there remained relatively stable within a range between 510 and 540 kb/d for many years, thanks to intensive drilling program.
While Shengli’s output was plateauing, Sinopec’s other fields in China have delivered impressive growth, having doubled oil production from around 150 kb/d in 1999 to 310 kb/d in 2014 (see the chart below).
The growth trend was reversed in 2015, when Sinopec’s output in China declined by 4.7% – the first decline since the company’s IPO in 2000. Further decline is expected in 2016.
The quote below is from Bloomberg:
“Sinopec has been maintaining output in its aging oil fields by over-investing and this is no longer possible in the current oil price environment,” said Neil Beveridge, a Hong Kong-based analyst at Sanford C. Bernstein, who estimates the company needs oil to stay above $50 a barrel to break even. “We expect Sinopec’s domestic oil production to drop 5 percent to 10 percent this year as it shuts down aging high-cost oil fields.”
“Sinopec Shengli Oilfield Co. [Sinopec’s subsidiary – AlexS] will shut the Xiaoying, Yihezhuang, Taoerhe and Qiaozhuang fields to save as much as 130 million yuan ($19.9 million) in operating costs, the company said in a statement.
The four oilfields are among the least profitable among 70 run by Sinopec Shengli, according to the statement.
Fu Chengyu, the former chairman of Sinopec, said last year that output at the unit was being cut “proactively” because of low oil prices.”
http://www.bloomberg.com/news/articles/2016-02-17/oil-rout-echoes-in-china-as-sinopec-unit-shuts-crude-fields
Sinopec’s oil production in China (kb/d)
Source: Sinopec F-20 annual reports, Operational Statistics for 2015
Thanks for the information.
Widgets from Oil Price http://oilprice.com/free-widgets
A good but long podcast with Art Berman, not so much new stuff for the people here but gives a great over all picture on the oil market right now.
http://www.macrovoices.com/podcasts/MacroVoices-2016-02-25-Art-Berman.mp3
Thank you for the link.
The interviewer was very weak and rather arrogant. That spoiled the broth. See also a more valuable Art Berman presentation (PDF)
http://www.macrovoices.com/publications/guest-publications/1-the-origins-of-the-global-oil-price-collapse-and-potential-investment-opportunities/file
IMHO this presentation is more valuable then interview.
One interesting take from Art Berman presentation is that he ignores “Great condensate Con” (and grossly overplays Cushing “storage glut” MSM meme). He also thinks that without OPEC cut $30 oil price range will last for the whole 2016.
In the USA we use crude for various purposes. Based on old data of 2007 we use close to half for passenger travel, and only 2% for on farm use, for example. Probably hasn’t changed much.
How much of the passenger travel is important to GDP, or is “productive” vs “frivolous”?
Here is the source article for this analysis
https://grist.files.wordpress.com/2010/06/newoilage.pdf
and an article which provides the data in pie chart form-
http://grist.org/article/how-we-can-end-our-addiction-to-oil/
Thanks hickory, nice work.
Hickory,
An even better question is how much of GDP itself is “productive” or “frivolous”?
See http://www.softpanorama.org/Skeptics/Financial_skeptic/Casino_capitalism/Number_racket/gdp_is_a_questionable_measure_of_economic_growth.shtml
Households spent $306 billion on gasoline in 2015 which is ~1.7% of ~$18 trillion of GDP. If 2016 gasoline prices average $1.98 per gallon (EIA February STEO report), household spending on gasoline relative to total household spending will be the lowest in the 69 year history of the data set.
https://research.stlouisfed.org/fred2/graph/?g=3CRQ
Gasoline on its own it is pretty much useless unless you want just to start camp fire for marshmallows. If you want to include the true cost of using gasoline in the household you have to include the cost of vehicles that have never been higher in the history, you have to include the cost of insurance that is also marching higher every year. And let’s not even go into ever increasing cost of building and maintaining each mile of highway network.
So you have to look at built in price inflation in today’s monetary system to realize the true costs.
And anyway example that you provide for 2016 that “gasoline relative to total household spending will be the lowest in the 69 year history” is anomaly. Do you understand why it is anomaly? It is anomaly because at that price nobody in oil industry makes any profit. So you won’t have this anomaly for very long.
I wonder what ShallowS thinks of EOG’s new strategy? That is, to choose their very best of the best projects, cut costs to the bone and hope that they can make a profit.
Good analogies are hard to come by, but I will throw one out. In 2009, at the depths of the housing collapse, what if the CEO of Toll Brothers proposed: “We are going to select our very best lots – the Crown Jewels in our inventory. Then we are going to build some of our more modest houses on them, cutting costs to the bone. We hope that we can then sell them for at least break even.” Personally, if I owned the stock, I would have sold immediately.
Clueless. You know what I think. And I do really like your Toll Brothers example.
What I think is more impressive than their current meme on $30 oil is how they cut their estimate of future production costs from $52 billion at the end of 2014 to $32 billion at the end of 2015, without a major proved reserve reduction.
But hey, Continental cut theirs from $26 billion to $11 billion. So no big deal.
We have decided to that we too need to reduce our future production costs by 60%. The electric cooperative said no problem. So did the chemical company, our workers comp carrier , liability insurance carrier. The steel manufacturers did too , so our tubing and rods dropped 60%. The down hole and injection pump service providers were ok with that.
Hey Clueless, even our accountant said, “No problem! Since you need to compete with OPEC and Russia, we are knocking 60% off our bill! Now go beat those Saudi’s and Russians in this oil price war! Show em who is boss!”
Seriously, we have seen some cost reductions, but nothing remotely near 40-60%. And, of course, although we pay the most to the electric coop of anyone, they just don’t seem too keen on lowering rates for us.
http://www.wsj.com/articles/the-new-oil-storage-space-railcars-1456655405
Sounds like a damned poor return on the price of a tanker car, but better than nothing.
Perhaps a sign that some are running out of places to store oil?
With oil prices what they are now, not very much money is going to be spent on bringing any new production to market, unless the project is already well underway,and most likely, not too far from completion.
So , unless prices go up, depletion is virtually guaranteed to take a bite out of annual production. We all seem to be in agreement this far.
Now supposing little or no new oil comes to market for the next few years, if and because the price stays really low, Can anybody estimate HOW FAST the current production will go underwater? If a company is SPENDING say forty bucks to produce a barrel, and getting thirty for it, the loss will eventually FORCE that production to be shut in.
So – the question is, how many barrels will be shut in , and how soon, because those barrels are losing money propositions on a day to day basis, cash in, cash out?
Running at a loss is one thing, bleeding cash at a loss is something else and far worse.
Looking at the oil price question from this point of view, I can see oil staying cheap for quite some time if the overall world wide economy declines rather than at least holding steady.
OFM. Look up above. I mentioned three publicly traded companies whose combined BOE was 160K BOEPD who shut in production in Q4, before the latest $10+ dollar drop.
It’s here and will continue.
HI SS,
I follow your comments very closely, and agree.
“It’s here and will continue. ”
Just about every word you post makes good sense to me.
I am wondering about something just a little different, that being mainly HOW FAST this other companies follow after the three you wrote about.
Let’s suppose the price of oil gets up to fifty bucks. How many producers are going to be not only losing money, but bleeding cash on a day to day basis at fifty bucks? Or sixty or seventy ?
You keep a hotel open if you generate more cash than it costs to operate it,from one day to the next, even if it is losing money overall. I am thinking most oil producers will continue to produce as long as they are generating some cash, but not much longer after that.
Who has the highest day to day production costs in the entire industry ? Some deep water operators, most likely. They may hang on a while waiting for higher prices, or avoiding shut down and plugging expenses, but not forever.
How long can they possibly hold on, if it costs them fifty or sixty bucks to get a barrel out of the well and to shore?
So far as I can see, oil markets will remain COMPETITIVE.Nobody is going to pay a dime more for a liter of gasoline or diesel fuel than necessary.
The price of oil WILL NOT go up, until either the economy picks up a good bit, or the amount of oil coming to market drops off a a little.
All this talk about TRADERS controlling the price of oil is bullshit so far as I am concerned, until somebody shows me HOW THEY CONTROL the production and distribution of oil.
IF the world economy actually does start going downhill, there are enough desperate for cash oil producers out there for the cutthroat pricing to continue for a long time.
OFM. The way to look at production being shut in is not on a companywide level, but on a well by well level.
A good well goes down with a failure, you pull it and get it back going. A not so good well goes down with a failure, you leave it. Or, you have wells that are so out of the money you just put a good coat of chemical down hole and then shut them in.
We have wells that we would run at $10, not many, but we do. Others do not work at $60. They produce out of the same zone and can even be right next to each other.
For example, we have a lease where one well makes almost straight oil, about 3 barrels per day, I think the pumping unit just makes six strokes per minute. The well just 330′ away makes maybe 1/2 barrel of oil per day and about 30 barrels of water per day. Furthermore, the good well is a straight hole. Bought the lease in 2005, have changed the pump twice and fixed a tubing leak once in eleven years. The not so good well has been pulled 14 times, mostly due to tubing leaks. Likely a crooked hole.
So when not so good well goes off, at $25 oil, its stays off. If the good well goes off, it is repaired ASAP.
Companies don’t just shut everything down, unless they are very small. Normally, if they go bankrupt, the trustee will find a contractor to pump the good wells until sold, in a Chapter 7 anyway.
In the meantime,
http://www.wired.com/2016/02/electric-car-revolution-now-scheduled-2022/
I am personally willing to believe that battery costs can come down fast enough for this forecast to come true.
But as the article says, it will be a LONG time before there are enough electric cars on the road to really matter.
All the hands on regulars here will be long retired before electric vehicles cut significantly into oil consumption.
OFM,
I am personally willing to believe that battery costs can come down fast enough for this forecast to come true.
Does not matter. Hybrids will eat pure electrical cars for lunch in the consumer market.
I do not see any chances for EV to make a significant dent into consumer market using the currently available technology.
Hybrids max out at about 50-60 mpg thanks to the inefficiency of the gasoline generators. Battery-electrics are cheaper to operate. With the same size battery, a battery-electric is cheaper to maintain and cheaper to buy than a hybrid, because it doesn’t have all that gasoline engine/transmission junk (also no tailpipe).
At a certain price point for batteries, even with *big* batteries battery-electrics become cheaper than hybrids. This has already been reached for city buses (and the related school bus market). It will be reached for conventional cars (with a different duty cycle) in due time.
Agree. With the coming range of full EVs, hybrids are a poor overbuilt choice; an interim tech….
A plug in hybrid will have eighty percent of the impact on oil consumption that a pure electric has, because most driving is done on battery power in cars such as a Chevy VOLT.
Let’s remember that in many countries drivers are still paying five dollars or more yankee, due to high taxes, for gasoline. These taxes may go up, but they won’t be coming down, since they were passed in the first place to keep down consumption of imported oil.
So the potential market for electric cars, based on lower total costs, is still there, with the sole major exception of the USA.
Given that oil is a depleting resource, and that the oil still in the ground is increasingly more expensive to produce, the price of oil WILL go up, eventually, unless we learn to get by with a hell of a lot less oil from one year to the next.
Nobody has the power to force people to produce oil at a loss, at least not long term. Producers of any product faced with losing money long term go into another line of work.
Petrol too cheap, says the ft:
http://timharford.com/2016/02/the-consequences-of-cheap-oil/
another smart idea? – using 98 year old pipelines, does not sound like the best plan ever
http://www.freep.com/story/news/local/michigan/2016/02/27/crude-oil-st-clair-river-pipeline/80995416/
Things have been changing pretty damned fast for the last few decades, and lots of things that were once considered unthinkable are now realities. I can’t see any reason to think fast change won’t continue, or that some previously unthinkable things won’t come to pass, within the easily foreseeable future.
With a D in the WH next time around, a substantial increase in the federal oil taxes is a very real possibility. It won’t be a very big increase, in and of itself, maybe a nickel or dime a gallon, but just a nickel would be a hugh percentage increase. The D voter with a job won’t kick about a nickel or a dime, and poor people who can’t afford to drive will enjoy sticking it to supposedly rich R voters any way.
And for what it’s worth, barring HRC being indicted, or some other equally unlikely event, and that idiot Trump getting the nomination, I am now leaning towards believing there will be a D in the WH next time around. Sanders is a long shot,but if he gets the nomination, just about every body who will vote for HRC will vote for Sanders.
Trump is going to go into the election, if he gets the nomination, with the highest negatives of any R candidate EVER, at least as far back as WWII. Tens of millions of people will turn out to vote AGAINST him, probably even more than will turn out to vote against HRC, who has extremely high negatives herself.
Barring a coup at the nomination convention, Trump is probably going to win the R nomination. We can hope for such a coup, because just about anybody else would be better, imo, in the event of a Republican win.
This is a once in a lifetime matchup, probably the first time ever, with both parties likely running the opposition’s dream candidate. Every hard core R hates HRC’s guts, ditto every hard core D hates Trump’s guts.
The thing about an increase in the gasoline tax is that once the dam breaks, more increases will be politically palatable.
My initial impression last year regarding Trump, which I am still leaning toward, is that Trump’s goal is to get Hillary elected president.
I am almost cynical enough to believe it.
Jeffrey,
My initial impression last year regarding Trump, which I am still leaning toward, is that Trump’s goal is to get Hillary elected president
I doubt it. Trump will definitely try to use email scandal against her. Even among democrats way too many people hate Hillary due to her track record and personal traits.
http://www.dailykos.com/story/2008/04/02/488623/-Is-Hillary-a-Sociopath
How Trump can help her? Trump voters will never vote for Hillary. The same is true for considerable part of Sanders voters. Many people understand that she is in the pocket of large banks and essentially voting for Hillary is voting for GS.
Also a lot of people in the military are vary of Hillary as the Commander in Chief (the same is true for Trump). And that is a powerful voting block. Please listen to what Tulsi Gabbard said:
https://www.youtube.com/watch?feature=player_embedded&v=2UM8F4EuUbw
http://www.commondreams.org/news/2016/02/28/dnc-vice-chair-resigns-throws-support-behind-bernie-sanders
What really surprised me is that South Carolina black population was brainwashed or bought to vote for her. That’s a slap at Martin Luther King face. I wonder how much money it cost her to buy SC black establishment.
Donald Trump is an idiot for running as a Republican. However, it is probably a good thing. It becomes glaringly apparent that Marco Rubio and Ted Cruz are two complete fascist morons and nothing else. The Republicans should be ashamed of themselves for having matching brain-dead fools as candidates. You can’t fix stupid.
Perhaps why Trump may be POTUS 45
http://www.theburningplatform.com/2016/02/28/the-empire-will-strike-back/
Things are going to hell fast in Venezuela.
There is a good chance some they will have to curtail production later this year due to lack of credit to buy the necessary diluents, spare parts, etc. Whether this will be enough to affect the world market is an open question, but four or five hundred thousand barrels a day taken off the market would be significant imo.
http://www.aljazeera.com/programmes/countingthecost/2016/02/venezuela-world-worst-performing-economy-160227103201996.html
[…] Read full post at peakoilbarrel.com […]