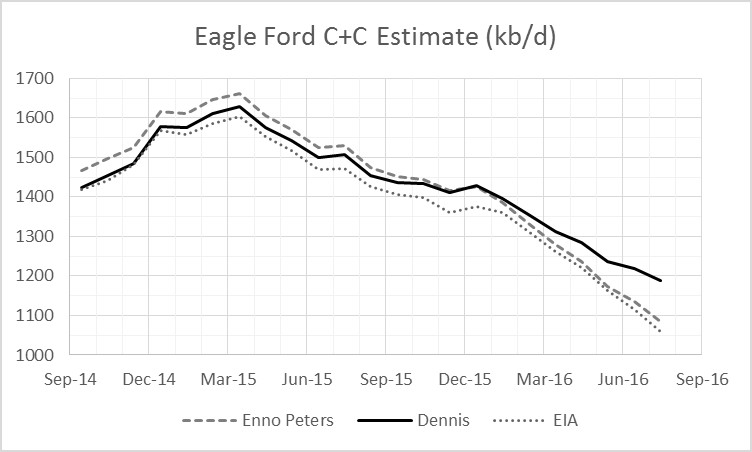
Enno Peters recently reported on Eagle Ford output at shaleprofile.com, so I have updated my estimate of Eagle Ford output by utilizing his data. Enno reports horizontal well output from the Eagle Ford region so some output from other formations is included (Austin chalk, etc). To compensate for this I compare the data from shaleprofile to the output reported from the EIA for the Eagle Ford.
For Sept 2014 through Nov 2015 Enno’s data is about 52 kb/d higher on average each month than the EIA estimate, so I deduct this amount from my preliminary estimate to arrive at my final estimate. Enno’s data for each month from Sept 2014 to July 2016 is divided by Texas (TX) statewide C+C output from the RRC to find the percentage of Eagle Ford region to TX statewide output. This percentage is multiplied by Dean Fantazzini’s 6 month corrected estimate of Texas C+C output and then 52 kb/d is subtracted to arrive at my final Eagle Ford estimate.
The Chart below has my estimate labelled as Dennis and Enno’s Eagle Ford region estimate (horizontal wells only) labelled as Enno Peters. The EIA estimate is shown as well.
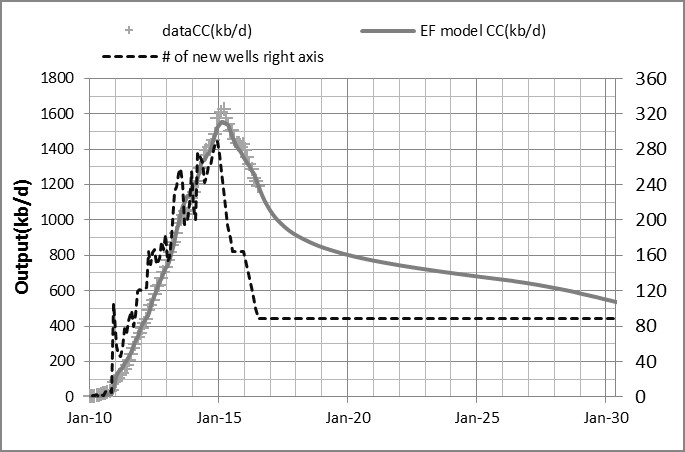
My Eagle Ford model has been adjusted somewhat to better agree with the output data. I don’t have reliable well completion data for the Eagle Ford play so I have to guess at the number of new wells per month.
A projection to 2030 is done by using the very simple assumption that the number of wells completed in July 2016 (roughly 88 wells) continues every month until March 2031 and then completions decrease to zero by Sept 2033. It is also assumed that new well EUR decreases at 3.8% per year starting in July 2016. A total of 28600 oil wells are drilled and total C+C URR is 6.5 Gb by Dec 2040. Through Sept 2016 about 2 Gb have been produced.
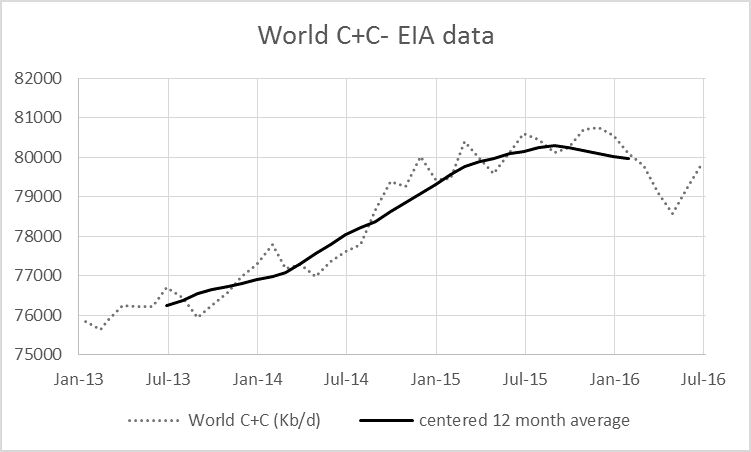
The EIA recently updated its World C+C output data through July, monthly output increased in July by 571 kb/d to 79,856 kb/d, the monthly peak was Dec 2015 at 80,761 kb/d. July output was 905 kb/d below peak monthly output.
The 12 month centered moving average of World C+C peaked in Sept 2015 at 80,243 kb/d and in the most recent 12 months, the average output was 79,797 kb/d, 446 kb/d below the peak.
154 responses to “Eagle Ford and World Update-Nov 2016”
Shell warns peak oil could be here as soon as 2021
http://www.zerohedge.com/news/2016-11-04/shell-warns-peak-oil-demand-could-be-reached-2021
It doesn’t matter if it is supply or demand that peaks, output is what matters and in the long run supply and demand will be equal. Now this may have an implication for the oil price, but generally this should be the marginal cost of the most expensive barrels produced (again in the long run where rational businesses produce oil that earns a reasonable rate of return). I expect by 2021, the marginal cost of a barrel of oil will be at least $90/b in order to meet demand, I think it might be as high as $150/b, all prices in 2016 US $ for Brent Crude.
From the data and the fact that efficiency and alternative transport/energy is coming on, production may have peaked already. Unless for some reason we are willing to invest huge amounts of money into expensive oil.
If demand stays high, it will be more reliance on imports for many countries or substitutes such as natural gas and renewables. With the exporting countries increasing their own internal demand and fighting depletion, the demand will be above the ability to supply soon, if not already.
Price won’t be the only indicator, NO GAS signs at pumps will be the other until things adjust.
Hi Gone fishing,
I don’t expect any supply shocks, without that the no gas signs are not likely to be widespread, it will mostly be higher prices which will destroy some demand.
A big war in the middle east between Sunni and Shite nations would create a supply shock.
The move to EVs, plugin hybrids, and hybrids will eventually reduce demand, but I think this will take 10 to 20 years before oil prices will fall due to lack of demand, possibly not until 2040, it will depend in part on oil prices and policy decisions.
Dennis, it took me a very short time to reduce my personal demand significantly, very significantly. If that were to catch on, especially with a high fuel price incentive, the demand could drop very quickly without EV’s or hybrids.
Besides occasional ride sharing there is consolidation of trips, not making extra unnecessary trips, keeping those tires well inflated and change those air filters.
Also:
https://www.fueleconomy.gov/feg/driveHabits.jsp
Even now the ride-share parking lots are often a quarter to half full in my area. With some more incentive the ride share lots would be full all the time and people would be asking for new ones.
Driving less is THE key, but a properly maintained car does go farther on a gallon.
But for those who look after their own, it’s not necessary or helpful to change the engine air filters in modern cars until you can see that they are noticeably dirty.
Most cars never leave paved roads these days, and except where there is blowing dust , as in construction zones, or very very dry areas in farm country or deserts, there is very little dust in the air.
The engine computer will maintain the proper air fuel ratio.
Maintenance is good, but throwing away a clean filter is a waste of money. We have been trained to waste our money of course.
You won’t hear this from reputable mechanics or shops who are actually IN BUSINESS for two reasons. They want the markup, and they know damned well that if they tell you something different from the conventional wisdom, you will think they are incompetent and go elsewhere.
Now I ‘m a guy who lives far enough back in the boonies that I still drive frequently on dirt and gravel roads, and I NEED new air filters, at the usual tune up intervals, or sooner.
Some people, such as Scrub Puller, might need new filters as often as every couple of weeks, since they operate in extremely dusty conditions as the rule rather than the exception.
In that situation, the way to go is to use a dual filter system, with the primary filter designed to be cleaned as often as twice a day, and reused. Farm and construction equipment usually comes equipped this way.
Why would one change out a clean air filter??? Change them when it’s time not before.
Hi Gone fishing,
If oil prices rise enough there might be changes, the goal is zero oil consumption, which will be hard to achieve without more plug-in hybrids and EVs. In the mean time, taking all the steps you suggest will help, getting people to take those steps is the problem.
We need to get to zero carbon emissions asap, a ramp up of EVs, wind, solar, and public transportation will be one path to get there, along with greater efficiency (the steps you outline), and better quality merchandise made to last a century rather than a year, and recycling as much as possible.
The real problem is that people think dollars are disposable, so they eat away at what would be their savings to get the unnecessary luxuries of today. Sometimes they are really sorry later when major setbacks occur in their lives and the extra funds are not there, but in tossed away Starbucks coffee containers, expensive cars, expensive vacations and just plain poorly thought out purchases.
The problem is a mindset that goes way beyond energy but of course always involves that. A mindset of unbridled extravagance and confusing desires with needs.
I fail to see why the goal should be zero oil consumption. I suppose you also propose zero cement manufacture, killing most cattle, etc.
Also, what are hybrids supposed to use? Ethanol?
Hi Fernando,
Some cement manufacture for non-structural stuff (sidewalks and patio blocks maybe) can be made with a process that absorbs carbon in the process, maybe that process will advance to the point that structural concrete can use that cement. See
https://www.technologyreview.com/s/535646/what-happened-to-green-concrete/
Methane emissions from agriculture will contine, but as population peaks and declines it may be reduced.
I assume it will be best to attempt to stay below the 2 C limit above pre-industrial. Continued use of oil will make that impossible.
Hybrids are a bridge to lower oil use, plugin hybrids the next bridge and EVs as a final step.
This will take 45+/-10 years in my view. High oil prices and appropriate policy may make it possible.
I fail to see why the goal should be zero oil consumption.
Fernando, I realized that to a retired petroleum engineer the goal of zero oil consumption is basically anathema to your very existence.
However that is precisely the goal that humanity must both aim for and achieve in the relatively near future. BTW, my definition of near future is much sooner
than Dennis’.
I also realize that no matter what I say or how I frame this issue, you will never accept that this is the case.
C’est la vie!
Cheers!
BTW, before someone starts quibbling with my saying ZERO oil consumption, I could see some minuscule percentage of oil use continuing well into the far distant future but not in any way shape or form the way we use it today as main source of energy for our industrial civilization.
Our most recent information is that 2C is way too high, even 1C might already be too high. The potential for multiple meters of sea level rise might already be set in motion at 1C.
I could see some minuscule percentage of oil use continuing well into the far distant future
There’s really no need. It would be far better to just go to synthetics for those kinds of niche uses. That might be a little more expensive, but for such small scale who cares?
Hi Fred,
I was trying to be realistic.
So as a realist how soon will reduce fossil fuel use to zero.
My recent unrealistic scenario was 2059. How much sooner is realistic?
I would like it to be 2030, but that seems unlikely.
What’s your plan?
That “what threatens your very existence” is one of the funniest remarks I’ve seen here. Next you will claim you live inside my head, I guess.
Dennis, it’s not useful to ponder on maybes. These dingbats are proposing that cement manufacture has to be shut down, and they don’t have any idea of how to accomplish it.
I also wonder if you ever consider their carbon cycle is set up to lead to their dingbat conclusions? That’s sort of a skeleton in their closet, they simply assume CO2 doesn’t get sequestered (it’s a model gap similar to the RCP8.5 baloney)
Hey Fernando, I may be a dingbat but at least I look around at what is happening in the world and try to keep an open mind whereas you just have a knee jerk reaction to anything that seems to threaten your world view.
BTW, I never say that there are any silver bullets but that doesn’t mean there aren’t more than one way to skin a cat.
So speaking of cement tell me why something like this can’t work on a large scale?
http://www.blueplanet-ltd.com/
Sack Concrete
Blue Planet bagged concrete is made of carbon sequestered coarse and fine aggregate. Until recently the only method for offsetting the carbon footprint of your building was achieved by planting trees. With Blue Planet sack concrete the highest CO2 footprint building material can now be carbon neutral or carbon negative.
Disclaimer: I am not affiliated in any way with this company.
BTW, I hear you often talking about geoengineering, though it seems to me you don't understand even the basics of non linear dynamics and the precautionary principle when you do.
Cheers!
Hi Fernando,
The carbon models factor in that as temperature increases there will be a release of carbon from thawing permafrost, and that a warming ocean sequesters less carbon (reduces solubility of CO2 as the ocean warms). So no the carbon models may not be perfect but they do not assume that no carbon is sequestered, you are mistaken on that point. The carbon cycle is complex, it cannot be modelled with a simple exponential as was done at Energy Matters.
Read
https://geosci.uchicago.edu/~archer/reprints/archer.2005.fate_co2.pdf
Denis, I’m familiar with carbon model theoretical structure. I also know they aren’t well supported and are a wild ass guess. The ocean’s ability to absorb CO2 is set by several factors, and it’s fairly easy to tweak a model to change the way it sequesters CO2. This includes the “release of carbon from thawing permafrost”. Those models seem to have accounted poorly for the fact that when permafrost thaws the vegetation cover changes and it can end up with more carbon above the surface in the form of bushes, trees. It will happen at least until the taiga reaches the ocean.
Hi Fernando,
The carbon models are not perfect, there are competing effects. There is a lot of carbon in that frozen permafrost that is converted to CO2 by bacteria as it thaws. There will also be releases of methane. Yes some grass and bushes and even trees may grow and absorb some of the carbon emissions. The models suggest the first effect is bigger than the second and paleoclimatology also suggests this is the case for the Earth system. Why did carbon dioxide levels increase during interglacials about 130 ka BP and earlier?
If the increased plant life from thawing permafrost caused a decrease in atmospheric CO2 we should see atmospheric CO2 decrease during inter-glacials rather than the reverse.
I will go with the climate scientists on this one.
A hand wave doesn’t cut it.
“NO GAS” signs will only show up if politicians implement fuel rationing.
My guess (perhaps similar to Dennis?) is that this will not happen in western countries unless there is some external event that affect one or several big oil exporters to the extent that supply decrease very drastic in a short period of time.
Have you paid attention to the ELM? Right now the big exporters are pumping at top end, how long can that go on?
Why would the western nations be exempt, they are the ones that need the imported oil (excluding Canada)?
I´m familiar with the ELM and the hypothesis of rapidly shrinking oil export. Import dependent Western countries are not excluded. However, I don´t think that the political response in most western countries will be fuel rationing. Instead I think that price will increase and poor people will not afford to drive as much as today.
There is no rationing of private jet trips today, poor people (or rather average middle class) can´t afford it.
Whatever happened to Jeff Brown and the ELM updates?
http://caplinepipeline.com/Reports1.aspx
Eagle Ford “oil”.
As I have been saying on this blog for more than a year now, Russia’s oil output is nowhere near peaking anytime soon. The same applies for Iran, Iraq & Kazakhstan. This largely explains the current geopolitical stand-off and proxy wars. This is why NATO is obsessed with destabilizing/regime-changing these countries.
Keep in mind that the US-EU-GCC-Japan (etc) alliance have done everything in their power in order to sabotage the Russian oil industry, including banning the sale of oil equipment to Russia, preventing their very own super-majors from investing in Russia, preventing their banks from lending to Russian oil (and other) corporations, and have also along with their GCC puppets done all in their power to crush the price of oil so as to minimize the funds available for both the Russian government and the oil corporations for reinvesting in oil production. If Russia can maintain and increase her oil production at this levels and rates under so negative external conditions, then what is the full potential?
http://oilprice.com/Energy/Crude-Oil/Russia-Continues-To-Raise-Its-Oil-Production.html
Hi Stavros,
Russian output indeed has increased by 353 kb/d since July 2016, latest data from Oct 2016 at 11.2 Mb/d. Output dropped in August and has rebounded by 490 kb/d in the past two months.
Data from
http://minenergo.gov.ru/en/activity/statistic
I have converted tonnes of oil to barrels by assuming 7.33 barrels per tonne.
Re-posted from the previous petroleum thread:
East Messoyakha was launched in September; Suzunskoye. Pyakyakhinskoye and Filanovsky in October.
Novy Port, Trebs & Titov, Prirazlomnoye (in Arctic offshore) and several other fields are rumping up output.
Russian oil production in January-October 2016 was up 210 kb/d (almost 2%) from the same period of 2015.
There will be more start-ups and further increase in production from the recently launched fields in the next 3 years, while production from brownfields is supported by increased drilling.
Hence Russian oil production is expected to peak no earlier than 2019-2020.
Hi AlexS,
Thanks. So what is the expected peak output? I would think that new fields might simply offset decline from older fields and that we would see a plateau of around 11.5+/-0.5 Mb/d between 2016 and 2020.
Dennis,
The most recent official 3-year forecast (very conservative, as usual) says that production will slightly increase in 2017-18 and remain flat in 2019.
Most Russian experts and analysts from some Western investment banks (Goldman, BofA ML, UBS) project higher volumes for the period to 2020.
According to the recently revised version of Russia’s energy strategy to 2035, Russion oil production will remain stable at ~455 million tons from 2021 in the “optimistic” case; and will gradually decline (beginning from 2022) to 476 million tons by 2035 in the conservative case. (2015 output was 534 mtons)
The conservative case assumes no significant production volumes from the offshore Arctic projects and tight oil.
Both projections were revised upwards from the previous versions.
Hi AlexS,
Is there a typo there? It seems the optimistic case has lower output, usually for an oil forecast optimistic is higher, so I am confused. Are those forecasts available in English?
Dennis,
sure, the optimistic case is ~555 million tons for the whole period between 2020 and 2035.
Conservative scenario actually projects a decline from 548 mtons in 2020 to 490 mtons in 2035.
Gradual decline from 516 mtons in 2020 to 476 mtons in 2035 was anticipated in the previous version of the Energy strategy, conservative case (as of February 2016).
Russian oil production forecast to 2035 (million tons)
Source: Russian Energy Strategy 2035, October 2016 version
red line – optimistic scenario
blue line – conservative scenario
Hi Alex S,
Thanks, I couldn’t find that report on English and I don’t speak or even read Russian.
Based on that scenario (with a peak at 555 million tonnes of oil), Russia is at the peak in Oct 2016.
If we use 7.33 barrels per tonne in Oct 2016 Rusian C+C output was about 11.2 Mb/d, almost the same as the peak in that “optimistic” scenario which sees that peak level roughly maintained until 2035.
Does the “optimistic” scenario seem reasonable to you or would you expect somewhere between the two scenarios with the peak at the Oct 2016 level and a moderate decline to 2035 maybe to 525 million tonnes?
Dennis,
The Energy Ministry’s forecasts are always rather conservative. For example, for this year they were initially projecting production at 537 m tons, flat output in 2017 and a slight decline in 2018.
The most recent medium-term forecast is 544 mtons in 2016; 548 in 2017 and 553 in 2018-19.
However in reality production this year should exceed 547 mtons (10.95 mb/d using 7.33 conversion rate) even if output in November-December remains slightly less than October average (11.2 mb/d).
In fact, in late October-early November daily output reached 11.22 mb/d.
Some Russian experts are projecting peak in 2019 at 575 mtons. This equals 11.55 mb/d, some 600 kb/d above this year’s average.
As regards, the “optimistic” case of the long-term forecast, it was revised from initial 525 mtons (10.54 mb/d) in 2014 version of the Energy Strategy to 555 mtons (11.15 mb/d) in the most recent version.
Note, that this document was released in October, but prepared several months earlier, before Russia’s output reached recent peaks.
It is clear to me that peak output in 2019-2020 will be above current levels and above 11.15 mb/d projected in the Energy Strategy.
If plateau output can be maintained until 2035 depends on many factors. The ministries of energy and natural resources say that Russia’s oil resourse base is big enough to keep flat output for at least couple of decades. But to achieve this, there should be:
(1) A significant increase in exploration activity for conventional oil both in mature and new onshore regions.
(2) An increase in recovery rates for mature fields to the levels already achieved in North America and the North Sea.
(3) In addition, the optimistic scenario assumes output from offshore Arctic zones (post 2030), other offshore (incl. Caspian), tight oil (not only Bazhenov, but also Achimov and other formations), heavy oil in Tatarstan, etc.
From what I know, projections for LTO and Arctic offshore are not too aggressive
Thanks AlexS,
So I assume there has not been a slowdown in oil investment in Russia, interesting.
Are they sending Trebs and Titov to the Varandey terminal?
Yes
http://caplinepipeline.com/Reports2.aspx
Select Porovskiy?
Many years ago I worked on the feasibility project to take oil out of that sector. But oil prices were too low to justify the terminal, and we could never get around the politics. We also didn’t dare extrapolate the available data to rely on reduced ice cover. I assume the bottleneck will be the terminal and its loading system.
Longer term they need to worry about water flooding those Devonian reservoirs. They have significant rock quality risks.
“the bottleneck will be the terminal and its loading system”
The terminal capacity is 12 million tons per year. It is sufficient to transport oil from Trebs & Titov (4.8 m tons projected plateau by 2020, up from 1.4 million in 2015) and other fields in the North of Timan-Pechora.
Ice is no problem as in the winter time they are using icebreaking tankers.
We had planned all the fields could produce 30 million tons per year, from the Timan Pechora basin sector in the Nenetsky AO. This included a higher rate from the Lower Devonian, as well as YK field, and the fields down towards the upper Devonian trend away from the coast. As you can imagine that was one hell of a demand on pipelines and terminals. 12 million tons is definitely smarter, and will allow gradual developments. I suppose Toravey will be next?
Fernando,
Production in the NAO this year is expected at 16.4 million tons, and is projected to exceed 20 million tons by the end of this decade.
Varandey is used only for the northern part of Timan-Pechora.
Oil from the southern part is transported via Transneft’s pipelines.
P.S. YK (South Khulchuya) was a big dissapointement for Lukoil.
Development programs for Trebs and Titov and most other recent Russian start-ups assume a very gradual growth and longer-term plateaus. That makes sense given current low oil prices.
I should have bought shares in the Naryan Mar hotel, I guess.
Production up 2%, and drilling up 16%. Not good trade.
https://www.rt.com/business/365110-russia-crude-production-october-record/
Development drilling is indeed up almost 16% year-on-year.
Supporting output at mature fields requires more drilling.
But ultimately, unlike shale companies and some oil majors, Russian producers remain profitable despite low oil prices and increased capex.
AlexS, I assume the Russian economy is still struggling?
Am still holding out hope for some cooperation to get to WTI $55-65, but looking very bleak.
I do not think US can quickly grow production at $55-65 WTI price band, especially if natural gas and natural gas liquids stay low.
shallow sand,
The Russian economy is still struggling, but is slowly improving.
( http://www.bloomberg.com/news/articles/2016-11-01/russian-manufacturing-unexpectedly-jumps-to-four-year-high
http://blogs.barrons.com/emergingmarketsdaily/2016/11/02/russia-recovery-on-track-manufacturing-data-show/ )
GDP growth for next year is projected at ~1-1.5%.
A big problem is that achieving more decent growth rates of at least 3-4% would require serious structural changes.
As regards OPEC-Russia agreement on output, I also think that its prospects are bleak.
It would be difficult to achieve an agreement within OPEC itself, as Iran, Iraq, Nigeria and Libya refuse to cut or freeze output.
Without an OPEC agreement, Russia will do nothing.
In any case, Russia will not cut output and may only freeze it at current levels (around 11.2 mb/d) for several months.
Like earlier this year, talks about OPEC/Russia output freeze helped to add some $5 to oil price for a relatively short period of time (a couple of months). But failure to agree will result in renewed weakness. This time I expect a decline to low $40s.
I agree with you that sustained oil price at $55 would not result in a rapid increase in the US LTO production, but $60-65 might change sentiment. What’s important, at these levels, banks may resume new lending to shale companies. This is one of the main factors that deter Russia and Saudi Arabia from drastic cuts in output
AlexS. It is difficult to determine the maximum price that will not result in shale oil growth seen from 2010-2015. However, I do think that service costs will rise if rigs continue to be added.
Of course, $55-$65 is our preference, but we can live with $40-$50 for awhile if necessary. Sub $40 WTI causes problems for us, sub $30 WTI hurts.
However, sometimes I think maybe we need another crash back below $30. Seems that may be necessary to chop unprofitable US shale off at its knees, plus would shake up the Gulf States, Iraq and Iran into a deal, which I believe Russia would be motivated to join at those levels.
Shale is generally still not profitable at current prices. PXD is considered best of class in the Permian. They earned 13 cents per share in the most recent quarter, and would have posted a loss but for an income tax benefit. Keep in mind, PXD is well hedged, realized oil price with hedges was $55.
So, assuming $5 differential on oil, PXD roughly breaks even earnings wise at $60 WTI, with service costs being given away. Many Permian service companies have filed BK. Basic Energy Services is a big player in the Permian, filed Chapter 11 2 weeks ago. As did Key Energy Services, another big player. In fact, a review of Haynes and Boone List of North American Service Company Bankruptcies shows most filed in Texas.
I have been wrong about how long the US industry could go on losing tremendous sums, but hanging on is one thing, growth is another.
One thing for sure, the price rout has caused significant declines in US conventional production.
Kansas is a good barometer of US conventional production IMO. There is some Mississippian unconventional there, but most production is conventional stripper production from decades old fields.
Production in 2014 was 49.510 million barrels from 53,685 wells.
2015 oil production dropped to 45.480 million barrels from 53,551 wells.
First seven months of 2016, just 22.740 million barrels from 50,229 wells.
Our small field has only one year below 900,000 barrels, being in 2010. Our field will struggle to produce 850,000 barrels this year.
One possibility to consider is what will happen to LTO financing if rates rise.
Hi Shallow sand,
Rates might not rise until oil prices rise.
If not the case then oil output will decrease in the US due to higher interest rates, and then oil prices may rise due to oil supply falling while World demand rises.
The longer oil prices remain low, the more bankruptcies we will see in the LTO patch.
So far supply has been much more resilient than I thought it would be while demand has grown relatively slowly, eventually supply and demand will balance, probably by June 2017, at that point we may run short and prices will rise. I keep guessing wrong on this, so maybe 2018 is a better guess. We will know in time.
A big problem is that achieving more decent growth rates of at least 3-4% would require serious structural changes.
What do you have in mind?
I mean new engines of economic growth: investments in high-tech industries, and manufacturing in general, as opposed to growth based on commodity exports and rapidly rising private consumption.
Double glass pane windows, those gadgets used to paint lines on the street, drivers’ academies and instructors, natural gas heaters with decent humidifiers, high by pass turbofan engines, and decent mud pumps should do for starters.
Russia have budget plan, gdp growth and all other economic parametars on $40/b on Ural($42-43/b on Brent) to 2020. That is Russian base scenario. They clearly thinks oil price will back in 30s, maybe short period 20s.
We need to remember that although Russia today is way the hell smaller than the USA population wise and way the hell behind economically, they still have the best big rockets, or at least the most reliable ones, nuclear subs, EXCELLENT military equipment of every kind, etc, and a lot of heavy equipment and infrastructure of all varieties. They build their own big turbines and generators for hydro power for instance.
My point is that this demonstrates that a Leviathan, a sovereign state, can accomplish awesome things,things considered impossible by lots of people, by choice if it is an authoritarian state, or if forced to do so by circumstances in the case of democracies.
When the energy shit is once and truly in the fan, many countries with the luck to have reasonably competent leaders will do what has to be done to ramp up home grown renewable energy on a war time economic footing, and to dramatically improve the efficiency of use of fossil fuels, especially imported fossil fuels.
BUT some, a lot, will fail because they are starting from too far behind and they are too poor, and short term troubles will prevent their investing long term.
Given the speed at which the prices of wind and solar power are falling, I am growing ever more confident that a successful transition to renewable energy is possible, assuming a little luck, and assuming there is no Seneca Cliff decline in oil and gas production within the next decade or two.
Yes, the USA can no longer go to space using it’s own fleet. They are reliant on the Russian Soyuz. They stuck with what works and is relatively low cost.
The number of new wells is 77 by the Enno Peters site – so already below your plateau number – and on a declining trend. There are only 29 oil rigs by Baker Hughes, although I’m not sure they count every county – other sites indicate 40. The number of DUCs is declining, once they are down to a working inventory – I’d guess from recent articles at around 250 – they are only going to be able to complete the number of wells they drill, say around 50, and probably of increasingly poor quality as they move out of the sweet spots.
Hi George,
We will see. David Hughes analysis suggests 7.8 Gb of recovery from the Eagle Ford, so my estimate is conservative relative to his. Enno may be underestimating the number of wells due to incomplete reporting for RRC data. Eventually oil prices are likely to rise because at these oil prices there will not be enough investment to keep output up. The projection is very simple, the number of wells completed may fall below 88, do you think that will remain the case until 2020? I am doubtful.
I have included falling EUR as they run out of sweet spots. If they drill fewer wells the rate that the EUR falls will drop.
http://www.rrc.texas.gov/media/34802/ogdc0716.pdf
At link above they give July completions for texas. For Oil, new drill in districts 1 and 2 there were 113 completions in July, most oil from these districts is Eagle Ford Oil. August 117 completions, June 110 completions, and Sept 91 completions. Note that the Eagle Ford region is probably districts 1, 2, 3, and 4 so I am probably underestimating completions as I only used districts 1 and 2. Link below gives links to all the monthly completion reports for texas.
http://www.rrc.texas.gov/oil-gas/research-and-statistics/well-information/monthly-drilling-completion-and-plugging-summaries/
Majors continue cutting opex and capex and shifting spend to short cycle shale projects. I would be interested to know when Ron and Dennis think non opec conventional production will succumb to lack of investment and commence a meaningful decline? There must be a tipping point or capitulation that correlates to the lost investment dollars and human resources required to maintain, never mind increase production, but it doesn’t appear to be happening as yet. David Demsur keeps repeating decline never sleeps but it certainly seems to have taken a nap.
I’d be interested to know what Ron and Dennis think about spare capcity from KSA and Russia. If they are pumping close to full out, how much more can they add?
Russia, like other non-OPEC producers, doesn’t have spare capacity. Production is increasing thanks to new field start ups.
According to the IEA estimate, Saudi crude production capacity is 12.2 mb/d.
Output in September was 10.6 mb/d.
So spare capacity is estimated at 1.6 mb/d.
The trick is that the Saudis have never produced more than 10.65 kb/d; and there are doubts that they can really increase production above 11 mb/d
Hi AlexS,
Good points. I think the OPEC spare capacity numbers are not believable, so World spare capacity is pretty close to zero.
Dennis,
” I think the OPEC spare capacity numbers are not believable, so World spare capacity is pretty close to zero.”
I think it is not close to zero, but less than estimated by the IEA.
BTW the EIA’s estimate is lower that the IEA’s
“Have those new Russian fields hit capacity in Oct 2016?”
No, they have just started production and will reach plateau in 2017-19.
Furhermore, some of the fields started in 2013-15 are still increasing output.
I will post a more detailed analysis of the Russian upstream oil industry.
Hi AlexS,
Doesn’t it seem that with the exception of Venezuela, Nigeria and Libya that most of OPEC is producing every barrel they can. One could even argue that the three with “spare capacity” are producing every barrel that is politically feasible at the moment. From that perspective I would argue that unless we know for certain that the political situation in OPEC nations that are producing less than capacity will change within 90 days that such capacity should be reduced to zero. In other words one cannot predict its availability so it should be set to zero.
What do you estimate spare capacity is? How much of that would you feel 75% confident could be producing within 90 days if needed?
We will have a better idea what “true” capacity is when oil prices rise to $85/b or more.
Looking at OPEC production for the past 10 years or so, if Venezuela, Libya, and Nigeria suddenly solved all their political problems in the next 90 days and the extra output was needed, all three nations might supply an additional 1.8 Mb/d, 1 Mb/d from Libya, 300 kb/d from Venezuela, and 800 kb/d from Nigeria based on EIA data though July 2016, all other OPEC nations are producing all they can in my view.
You are right, but:
– we don’t know if Saudi Arabia could add something (say, some 500 kb/d, at least for several months period);
– Iran and Iraq continue to increase production capacity and actual output.
Hi AlexS,
Maybe Saudi Arabia could add some output, and Iraq at some point, less sure about Iran and it is not clear if it would happen in 90 days.
Dennis,
Of course, speaking of Iraq and Iran, I was meaning expected production growth in the medium-term, not current spare capacity
Hi AlexS,
Thanks for your input. I agree with Iran, Iraq, and even Saudi Arabia potentially being able to increase capacity in the medium term, but they will be fighting decline from existing fields so I expect only modest increases which will barely offset declines from non-OPEC output.
Overall I think an undulating plateau for World C+C output from 2016 to 2021 may be reasonable (79-81 Mb/d) with slow decline from 2021 to 2030 (under 2%/year annual decline rates). This assumes not major war in the middle east (say between Iran and Iraq vs Sunni OPEC members) and no major global financial crisis (similar to 2008/2009 or worse) before 2030.
If C+C URR is 3300 Gb (500 Gb of extra heavy oil included), using a shock model with extraction rates under 10.6% per year (from proved producing reserves) through 2030 (extraction rate was 8.45% in 2015 and 7.4% in 2009) annual decline rates remain under 1%/year until 2025 and under 1.5%/year through 2029 in the scenario below.
Dennis,
Kuwait also plans to significantly increase oil production from the current 2.9 mb/d.
Quote from the recently issued EIA report:
“Kuwait wants to remain one of the world’s top oil producers, so the country has targeted crude oil and condensate production of 4 million barrels per day (b/d) by 2020. These planned production targets include the expansion of the Neutral Zone production, which has been shut in since the fourth quarter of 2014 because of a dispute with Saudi Arabia.5 However, Kuwait has struggled to boost oil and natural gas production for more than a decade because of upstream project delays and insufficient foreign investment.
Most of the increase in oil production capacity is expected to come from the Kuwait Oil Company (KOC) projects, with total KOC capacity expected to reach 3.65 million b/d by 2020. The remaining 350,000 b/d is expected to come from the Kuwait Gulf Oil Company (KGOC) in the Partitioned Neutral Zone (PNZ).”
http://www.eia.gov/beta/international/analysis.cfm?iso=KWT
Hi AlexS,
I am pretty skeptical of EIA forecasts which usually are not conservative. Maybe we will see more output from Kuwait as well, but this seems a little like the Iraqi plans for 12 Mb/d of output by 2016 announced back in 2010.
http://www.theoildrum.com/node/6101
Forget Venezuela rebounding. Two days ago dictator Maduro got on all TV stations simultaneously, gave a nearly three hour speech and vowed the opposition would never gain the presidency EVEN IF THEY HAD THE MAJORITY VOTE.
Meanwhile both the Obamer and the Poper are working hard to keep the opposition at what appears to be completely useless “negotiations”. Social media has a high content of comments remarking that both Obama and Bergoglio are being fooled by Maduro. Some are starting to realize that both of them are working to sustain the Maduro dictatorship in power at this time.
This has become evident to opposition leaders, and November 11 has been set as a deadline for the talks to conclude with an agreement to have elections. If this doesn’t happen we will see Obama and the Pope siding with the dictatorship (like they do with Castro). This won’t stop unrest, which will cause further oil production drops.
What I’m wondering is when will somebody decide to blow up the 16 inch diluent pipeline which runs from Jose to the Orinoco oil belt? That will knock off a huge volume off line. And the way those reservoirs are performing, a shut in for a couple of weeks will make quite a few wells produce with a higher water cut.
Dennis,
“What do you estimate spare capacity is? How much of that would you feel 75% confident could be producing within 90 days if needed?”
Apparently most of them produce at full capacity, but I can only guess what Saudi spare capacity is. In any case, OPEC’s total spare capacity is well below historical average levels.
One big unknown is Libya. The IEA estimates their capacity at 400 kb/d (as of September), but there were reports that in October Libya was producing 550 kb/d. As far as I know, Libya’s production facilities were not seriously damaged by hostilities, so theoretically the country could significantly increase output. Note that before the civil war they were producing 1.6 mb/d. In any case, this is not “sustainable spare capacity”, but still a potential threat to the global supply-demand balance.
OPEC spare capacity.
source: IEA Oil Market Report, october 2016
Hi AlexS,
I agree there might be a lot of spare capacity in Libya especially if peace breaks out, seems low probability, but maybe when oil prices increase the warring factions will compromise and a lot of oil would become available. This would be a potential solution to the looming shortfall due to low investment which could keep oil prices under $100/b. Probably won’t happen though.
Dennis,
It’s only my guess, but I suspect that internal situation in Libya largely depends on interests of outside players: Saudi Arabia, Qatar, U.S. and west European powers.
If all those outside players decide that Libyan oil is needed in the market, the warring factions in Libya will compromise.
I tend to agree with that assessment, but I am not a foreign policy expert, just a casual observer.
Simce saudi is depleting its inventories would you not argue that spare capacity is negative?
Spare capacity has nothing to do with reserves (inventories), but only the ability to increase output within a short period of time. Spare capacity can be increased by drilling enough new wells to more than make up for declining output from old wells. Even though depletion causes declining reserves, spare capacity can be increased by more and more drilling right up until the last drop of oil is gone, at which point all capacity goes to zero.
However, to do so would be economically foolish because spare capacity is an investment made, but not productively used. Spare capacity should be just enough to make up for unforeseen production disruptions and still allow the meeting of contractual production obligations.
Saudi Arabia’s historically great spare capacity is accidental. They were drilling and producing full out until the oil price crash of the eighties, at which time they cut back production greatly to help prop up prices. Their spare capacity from legacy wells gradually diminished right up until the beginning of this century. Manifa coming on line in 2013 and may have added some spare capacity, but only they know for sure.
Alex is there any good source on the drilling and if material fracking equipment Russia uses? I believe they are not in the bh rig count, but don’t know if people know you many oil and gas rigs they are running . Or if the rigs have seen sharply increased power as in the US to drill the deeper and longer wells
Wake,
Unfortunately, my sources on the oil services market in Russia are in Russian
For example, this report by Deloitte:
https://www2.deloitte.com/content/dam/Deloitte/ru/Documents/energy-resources/Russian/oilservice-market-in-russia-2016.pdf
There are good reports in English, if you can afford them:
http://www.rpi-research.com/publications/index.php?SECTION_ID=29
Thanks Alex, always interesting and quick with a response
Hi John,
My guess is that there is not much spare capacity. At some point there will be decline, but I think it will be modest until 2020 and that any decline will make prices increase and more output will follow with a lag of 12 to 18 months (maybe more than this, depends on the project). LTO and more infill drilling onshore might respond fairly quickly to higher oil prices, for deepwater offshore it is more like 5 years, maybe 4 if a project is ready to go off the shelf (project ready to go and waiting for higher prices.)
In short, I haven’t a clue, but decline will happen at some point. Actually it began in Jan 2016, but I think we will see a plateau from 79-81 Mb/d until 2020 and possibly longer (though less likely).
“My guess is that there is not much spare capacity.”
Dennis, could you define your definition of “spare capacity”. Is it the ability to produce more within a day, month, year or decade ? Is it the amount that current infrastructure can produce today minus actual production ? Do you deny Opec could raise it’s output substantially with additional ports, pipelines and wells ?
“Excess capacity is a situation in which actual production is less than what is achievable or optimal for a firm. This often means that the demand for the product is below what the business could potentially supply to the market.”
Why should an organization increase it’s “spare capacity” when it’s current capacity drives down prices and would be seldom used ?
According to the IEA, “Sustainable Production Capacity” is “capacity levels that can be reached within 90 days and sustained for an extended period.”
Spare capacity = Sustainable Production Capacity less current monthly average production
Hi Huntington Beach,
Spare capacity it what can be produced within 3 months and then sustained for 12 months in my view.
I agree that potentially OPEC might be able to increase output if oil prices were high enough to justify it. Whether this amount would be substantial (which I will arbitrarily define as 25% above peak output to date) is not known. Nobody knows how large OPEC reserves are, there are only guesses.
Hi Dennis,
Label me gadfly, and I am willing to bite on the possibility that even the OPEC countries themselves don’t necessarily know what they have in the ground, in some cases.
But considering what we KNOW about spies and and disillusioned insider people telling our enemies, and what an occasional honest to Jesus patriot tells us about what our government is up to, I find it hard to believe that Obama can’t have a pretty good analysis of OPEC reserves in his hands within the time frame it takes to either print it out.
My belief is that with the info an outfit such as Shell or Exon or any other truly big time oil player has access to thru equipment suppliers, engineers and tradesmen who have worked inside OPEC countries, etc, and a few million spent on direct bribery or on purchased purloined data ( in a fashion that is legal, technically, in both cases, potentially or maybe not ) they have a very good idea as well.
Hi OFM,
I’ll check with Obama and see what he thinks. 🙂
I don’t have access to any inside information, eventually Saudi Arabia will peak, just like the US in 1970, my guess is that it will be before 2025, but its a WAG.
Here’s a question for the hands on guys.
You look for oil these days primarily by using state of the art seismic equipment, and running the seismic results thru a sophisticated computer program, and then you be good and say your prayers for a day or two, and commit to drilling some test or exploratory wells, and hope to strike it rich, right?
Well, typically how many test wells must be drilled, and over how large an area, to come up with a pretty good estimate of how much oil is THERE?
What I am thinking is that given satellites, and lots of commercial jets, not to mention a few military aircraft equipped with awesome cameras, there is little chance of drilling a dozen or more exploratory wells in a place where none have been drilled before, without it being common knowledge inside the industry.
So – If you observe these wells going in, one after another, considering the cost of them, it seems you would know there has been a new field found.
Otherwise you have the seismic, and not much if any thing to back it up. Can the discovery of a large new field be kept secret very long?
How accurately can the amount of recoverable oil in such a field be estimated WITHOUT test wells?
Excellent points. I’ve designed gas field development projects with spare capacity to make sure we could meet pipeline or LNG plant demand 100 % of the time. Some oil field developments have spare well capacity and are limited by production equipment, and OPEC nations used to have a spare capacity they used to fight for quotas and defend market share. But this spare may not last very long. My guess is Aramco runs field tests to make sure they tune their reservoir and surface kit models. That’s what I would do.
AlexS – could you give me Russia’s natural gas production figures for this year?
29,180 yen for a metric ton of oil in Japan. 103 yen per dollar, 283 dollars per tonne fur zie oil, 7.3 barrels per tonne, 38.80 usd for a barrel of oil in Japan on Friday.
Looks like oil will be under forty dollars one more time.
https://www.bloomberg.com/energy
http://www.kitco.com
7 pounds for a gallon of oil, 42 gallons per barrel, 7 × 42 × 7.3=2146.2 pounds, close to a metric ton.
“It’s Getting Tougher for Shale Drillers to Impress Investors”:
https://washpost.bloomberg.com/Story?docId=1376-OG2XUK6JIJUO01-5TLE030M7F91M822T8O7COPJ8R
“After two straight quarters when the U.S. shale industry posted outsized oil production figures that clobbered expectations, explorers are finding it more difficult to be overachievers. Once-innovative engineering tricks such as drilling two-mile long sideways wells and cracking the rocks with mountains of sand are becoming routine, depriving oil companies of methods to deliver shockingly big output numbers.”
Blloomberg see things only in terms of investments and economics. Geology, depletion, decline, sweet spots etc. rarely get considered, and when they are they are often misunderstood.
We have been discussing why there are so many wells in North Dakota that do not have a full month of production days.
Clearly, many low volume wells are not economic, and have been shut in.
Also, mechanical issues cause lost production days.
However, is it also true that many wells now have low enough fluid volume that they cannot be pumped continuously?
For example, 58 of 377 wells operated by EOG in Parshall had less than 10 production days, by my count.
Are a lot of wells being pumped intermittently because there has to be time for fluid to get high enough in the well bore to be pumped by the rod pump down hole?
Looking at the larger fields in the Bakken, it appears average production days in August ran between 22-27 days per well. Why is this?
Shallow
There is a lot of ‘strangeness’ going on with hydrocarbon output both in curtailment of producing days, as you’ve pointed out, in the Bakken and in the Appalachian Basin’s erratic output month by month of numerous wells from many operators.
Bruce Oksol pointed out, and I just verified, that Whiting shut in its highly prolific Twin Valley field in August … completely. These 16 wells produced 40,000 barrels the month before, July, and that shortfall is more than the overall August decline, I believe.
I have no idea what is behind this, but in my ‘halo hunting’ searches, it was very common to see fairly recent, highly productive wells shut in constantly.
When Filloon and Enno got into a back and forth over categorizing output by specific online days (Filloon’s approach) rather than calendar months (Enno’s method), Filloon put a lot of time into tabulating production days in a bunch of northeast McKenzie county wells and came up with something like 270 days online over a 12 month timeframe.
Don’t know the reasoning, but shipping oil via DAPL may provide an immediate $6/$8 barrel increase in revenue.
That, plus shut ins while the frac’ing is occurring in the concentrated core areas may be playing a role.
coffee. Pipeline constraints is something I had not thought about.
Well completions are another possibility, but given the overall number of producing wells compared to completion activity, this can’t be a primary reason.
Something that surely someone in the know has an answer to.
I will say we do not intentionally shut wells down to intermittent status unless we have to because total fluid production is too low.
In any event, we don’t say we have a two barrel per day well just because it is pumped just 182 days but produces 365 barrels in a year. I did not agree with Filoon in that regard.
2 possible reasons to shut in. Anti-collision concerns when drilling nearby wells (not very common though) or a downhole failure requiring a workover.
270 days online out of 365 days, that is a regularity of 74%.
It is hoped for that this was accounted for when the companies ran the economics and that those data were presented owners and investors.
The decline in Bakken was above 46 kbo/d from July to August.
In July -16 the 16 Whiting wells produced about 1.2 kbo/d, that is not as coffee believes more than the decline from July to August.
Chart below shows oil extraction developments for the 16 Whiting wells in twin Valley.
I’m in the Ozarks ( NW Ark ) this week, and we had an Earthquake ~19:45 this eve.
No damage noticed yet here, however lots of shaking. Dogs went nuts.
Looks like center is Cushing OK and twitter feeds indicated Power was cut to
several Oil facilities.
Shallow, I asked one of my operations guys and this is what he told me. “It could be productivity issues as mentioned above. More likely it is due to regulatory rules. North Dakota has led the way in flaring reduction. Basically a well can flare 1800 MCF per month. Without gas takeaway (pipeline) the well would have to be shut in for the rest of the month after reaching that threshold. I cannot tell you if that is what you are seeing but that would be consistent with the rule. “
Shallow, here is an observation to your query about partial production months by a former Kodiak production manager:
“Interesting observation. Can’t really come up with a single reason. The goal at Kodiak was to limit down time to 5-10% but it usually ran 10-15%. Keeping thins running is tough due to weather and a shortage of experienced staff.
Most of the pump off controllers down cycles will be for a few hours vs days. With lots of wells on automation at the bigger companies I would speculate the some office people may total hours and divide by 30 or 31 for days on.
Wells not on pipeline get shut in when there are road restrictions. Whenever it gets wet rain or snow melt) the counties restrict truck traffic including oil trucks.
Wells May be down for batch fresh water treating (salt) but this is usually days.
They will shut wells in for offset fracs”
JohnS. Thank you for all of the information.
The reasons for shut ins is likely “all of the above”. Interesting comment re: pump off controllers. I wonder what percentage of wells are already on these – which I assume is what we call “time clocks”.
Yes, that is the most interesting take from John’s comments, “pump off controls.” Which, by the way, Shallow, are sensors that automatically shut down the rod lift well when the well is pumped off, different from manually set “time clocks.” The fact that a lot of those wells pump off at all, even for hours at a time, go hand in hand with my long term theory of increasing GOR in pressure depletion shale “containers” (I cannot bring myself to think of shale as a reservoir) and loss of fluid conductivity to the wellbore. That is, in my opinion, exactly how depletion will look in the shale business and why we are going to be shocked how short EUR tails actually are.
What a mess in N. Dakota. Their net back price at the WH, after all costs deducted, are now down to 10 bucks a barrel again, there is no place to sell the stuff unless they shoot more rubber bullets at Indians and get the pipeline finished, and now there is clear indications that we might be starting to see signs of early retirement for middle aged wells. They owe more money in the Bakken than the entire country of Puerto Rico owes, their interest expense alone hundreds of millions of dollars per quarter. Its a revolution alrighty.
Chart below, development in the water cut for the Twin Valley wells.
Rune
You may have just presented the clearest depiction yet of the hydraulic communication between wells after frac’ing offsets.
Note how existing produced water spikes coincident to, or immediately after the elevated flow back levels of the new wells as they come online.
I just did a quick check of output of several of these wells in the dimming daylight, and – should you choose to do a little digging – you may be the first person on the internet to graphically show the halo effect.
Tarpon Federal 21-4-1H, permit #22360, had an eightfold increase in oil output from 7/14 to 11/14.
Skaar Federal 41-3-2H shows, for September 2016, produced water of over 8,000 barrels, up from June’s 500+.
Looks like a bunch of wells are coming online shortly as a lot are in this area on confidential list and could show offset well oil increase.
Seems like a few are also on Inactive Status.
This Twin Valley field, located at T152N 97W, is tiny at only eight sections. Could be an interesting model as the new wells come online.
And, yes, I missed big time thinking the 40k shortfall from this field for the month equated to the 40k+ daily drop.
Mistakes made and lessons learned.
shallow,
For some time I have found developments of GOR (Gas Oil Ratios) for the wells to be the most interesting metric to follow.
According to NDIC, Directo’s Cut about 89% of nat gas is captured, (gas flaring is down).
Chart below shows developments in GOR for the 16 wells in Twin Valley mentioned by coffee.
These are gassier, but notice one thing, the GOR for many started a steep climb last winter.
A closer look at one of the 16 wells in Twin Valley.
GOR in a steep climb while oil extraction in a steep decline.
This is not a good development and it will be interesting to see future data for these wells.
Rune and Mike: Thank you for your comments.
Rune, the well you highlight is proof of what you have been driving at regarding GOR for quite some time.
It seems to me these wells are expensive versions of the deep pays in our field (2,700′-4,100′ are the deep pay depths in our field, LOL).
In those zones, high IP are common, but so are high declines. In the deepest pay, IP’s of 100-500 BO in first 24 hours were recorded. This was in the mid-1970s, a large independent still controlled much of the field and was testing this zone.
Based on those initial wells, they ended up drilling about 50 wells in a couple years, and some other independents also came in and drilled wells in that zone.
Guess what, the play ended pretty quickly after the wells went from the initial IP to under 5 bopd in about a year or two. Some of these wells are still produced today, they make little water, and little oil, usually 1/2 to 1 1/2 BOPD. At current prices, one downhole failure does you in for the year.
We had one of the wells in the 2,700′ zone, since sold. It was actually not a bad well, we pumped it one day, shut it in the next. We operated it just like the previous owner had.
It produced about 300 net BO per year for us, and we never pulled it in the 10+ years we owned it. There are a few other wells operated by others near it, and they more or less have the same thing, 1 BOPD, 5-20 BWPD, wells pump off so cannot pump them 24/7/365. The well we owned has cumulative production of just over 19,000 BO, with 12,000 of that in years one and two, and the remaining 7,000 in years 3-22.
Some wells in the same pay as the 4,000′ in our field were drilled 2013-2014 in a field about 35 miles to the north of ours. Similar shallow sandstone field above the “shale” source rock. One well had IP of 70, now down to 5, the others ranged from IP of 5-20, and are now all below 2 BOPD.
This is also what I understand was experienced during the Spraberry boom in the early 1950s. High IP, leasing and drilling frenzy, followed by realization that EUR was not nearly what high IP initially was thought to predict.
I am not a geologist, nor a petroleum engineer. However, I think I know enough to see that these shale wells have production decline curves similar to “tight” zones which have been explored in the US since shortly after WW2. So I guess, given this, how are we supposed to believe these wells will behave differently?
I looked at those Twin Valley wells, it appears very little produced water.
I have heard of the slang term “gas lock” used by guys in the field. Is this what is happening? Twin Valley wells were selling (not flaring) the gas.
Are these wells that they completed with “monster fracs?”
No, “gas locking” is a production term used to describe the inability for a down hole pump to work properly as solution gas in the production stream keeps valves in the pump (balls and seats) from opening and closing properly.
From Wikipedia, re: solution gas: “This drive mechanism, also known as depletion drive, depends on the associated gas of the oil. The virgin reservoir may be entirely liquid, but will be expected to have gaseous hydrocarbons in solution due to the pressure. As the reservoir depletes, the pressure falls below the bubble point, and the gas comes out of solution to form a gas cap at the top. This gas cap pushes down on the liquid helping to maintain pressure.
This occurs when the natural gas is in a cap below the oil. When the well is drilled the lowered pressure above means that the oil expands. As the pressure is reduced it reaches bubble point and subsequently the gas bubbles drive the oil to the surface. The bubbles then reach critical saturation and flow together as a single gas phase. Beyond this point and below this pressure the gas phase flows out more rapidly than the oil because of its lowered viscosity. More free gas is produced and eventually the energy source is depleted.”
I bow to Rune’s expertise in these matters but I find the two Twin Valley charts Rune has provided are a stark indication of depletion in rock that’s drive mechanism is pressure depletion. GOR increases and eventually leaves oil trapped in the rock, essentially immobile and unable to move toward to the well bore. Pressure maintenance thru flow back choke management was vogue for awhile, you recall, until prices dropped, then it was monster frac’s and let ‘er rip wide open stuff. In this case that has now caught up with this particular operator.
Mike. Thanks.
Do you think this is why wells in the OK resource plays just stop producing oil?
One of the Flatland Federal wells, 11-4-TFH, is the 104 stage coiled tubing frac which came online October, 2014.
It’s produced over 550,000 barrels oil and is still flowing.
The other two wells on that pad have produced 360k/390k bbo, were both still flowing, and are on Inactive Status.
A closer look at one more Twin Valley well and note the GOR tripling over one year as oil production plummeted.
Rune: coffee posted a lot about EOG’s Riverview 102-32H in Antelope Field being a game changer. How does GOR look for it?
That is one very good well. Chart below shows development in production (per day in operation) and GOR.
Been online 460 days … 430,000 barrels oil produced … still flowing… lateral is 4,200′ long.
I don’t know how relevant but that well was drilled to a shallower depth than almost any of the others (and there are plenty) in the Alexander field. And it is noticeable that EOG have not drilled any of the other 12 permits they have in the same section (all still confidential but not spudded as of last September).
Antelope – not Alexander, don’t know where that came from. The EOG well is at 15500 feet, almost all others around 20 to 21000. It may be just a small local feature, maybe a conventional trap albeit still requiring some fracking.
Mr. Kaplan
This Riverview well targeted the middle bench of the Bakken formation with the vertical depth (TVD) running from 10,535′ to 10,555′ for most of the lateral’s length.
The length of the lateral is especially short, about 4,300′, giving the total ‘depth’ – Total Measured Depth (TMD) the 15,000′ figure you referenced.
In thus section, down in the SWSW quadrant is the location of the twelve permitted, yet to be drilled wells you mentioned.
It should be interesting to see the results when this dozen ultimately comes online.
Have you considered plotting GOR versus cumulative oil?
Or GOR versus cumulative (oil plus gas), assuming 1 MCF is equal to say 1 barrel of oil? Note that this is a purely empyrical trickery which relies on voodoo engineering, but it might work.
This example well is representative of less than 5% of total wells drilled in the Bakken. It is a really good well but it is an anomaly. As good as it is, it has not paid out yet. At sub 40 dollar WH prices an 8 million dollar Bakken well now requires something in the order of 730,000 BO, not BOE, to pay out.
Mr. Likvern’s GOR analysis is troubling to me; clearly this well has not been managed properly from a pressure maintenance standpoint and it will be interesting to see what happens to liquids production over the next 18 months. EOG is infamous for this kind of balls to the wall production management; in the Eagle Ford they have ruined countless wells by gutting them in this same manner.
Mike. It looks to me that there have been 359 Bakken/Three Forks wells that to date have cumulative production of 400,000+ BO. 27 of those produced 6,000 BO in the last reported month, and 88 produced 3,000-5,999 BO in the most recent month.
So, looks like these wells are outliers, but yet even the outliers are short-lived.
Wow! that’s all? Its even worse than I thought.
Based on data as per Jun-16 (when this work was done) the Riverview was the best of all of 2015 vintage and amongst the top 10 in Bakken based on first 12 months totals.
The well (so far) is among the best 0.1% in Bakken.
The overriding significance of EOG’s Riverview well may not be so much in the actual production numbers as in the method (completion process) that enabled the results.
EOG had, in the previous year, been trying different fracturing protocols in the EF with varying pump rates, water volumes, proppant amount and sizes.
The sheer volume of proppant amount (20/30 million pounds) is what catches the most attention, but it is the interplay of all the components, including successfully employing diverting agents, that is the real accomplishment with these fracs.
The Riverview was the first Bakken application of this approach and the production history should validate EOG’s work.
This massive scouring of the near wellbores area under high pressure water (12,000,000 lbs. of #100 mesh were used in the Riverview’s frac) is now being copied by other operators.
Chesapeake just used over 50 million pounds of proppant in a 9,500′ lateral in the Haynesville.
The most crucial aspect of all this completion stuff is the economically expanding footprint of wells that can now be expected to have higher output than earlier wells.
This is one reason the Powder River Basin is starting to see more activity in recent months.
There is currently just a shocking discussing about peak oil demand falling over the next 15 years.
….Bloomberg New Energy Demand estimates that plug-in cars will displace 13 mill barrels of oil a day by 2040… Fitch Ratings reported …..electric cars could trigger a death spiral for investors with securities linked to fossil fuels.
see at
http://www.resilience.org/stories/2016-11-07/peak-oil-review-nov-7-2016
After languishing sales over decades, and even falling last year in the US, EV took off this year – increasing mainly in China by 118% year over year.
http://insideevs.com/monthly-plug-in-sales-scorecard/
I am not sure what is behind this trend, yet it could be psychologically devastating for the oil price over the next years. So, again investors beware, maybe some very hard times are coming.
1. What does that do for Natural gas/Coal demand?
2. What is the percentage for cars replaced yearly? and how many of those are EV (for the world)
I think those are questions need to be answered to get an idea of what this will look like? And that is only a couple basic questions.
Reno,
I think Fitch, Shell, Bloomberg have done already some scenario evaluation. 1.5% of all new cars are in China already plug-in cars. At the current growth rate, next year 3% are already plug-in EV. In theory in about seven years all new cars will be EVs. There is still the stock of maybe 200 mill fossil fuel cars in China, which will not be scrapped immediately. So, the question is how long will this take. Yet, what I want to emphasize is the huge psychological effect from : we are running out of oil towards: oil will be worthless in 15 years.
So, the recent numbers say EVs are getting real and this is the message – no matter how long this will take. See also the side effects: German car exports to China plunged by 40% fom 80 bn USD to 50bn USD. Ditto for UScar export. A Chinese company BYD is the EV world market leader, not Ford neither GM nor VW nor Tesla. So, this turns upside down everything.
And what about the oil market? Will the shale business completely vanish when oil is at 30 USD per barrel for a few years? What influence does this have on the US and European economy when trillions of oil and car investments implode?
So every market – the smartphone market, the computer market….- start with just a small move. I am wondering if this is now a beginning of a total new world. The writing is on the wall.
You do realize hmm I think most of the cars on that list are gasoline engine cars?
And that link starts out saying no such thing is pending, with a projection from Shell for increased consumption driven by aircraft and trucks. Bloomberg New Energy Finance is somewhat less than impartial?
http://www.eia.gov/forecasts/ieo/liquid_fuels.cfm
In the International Energy Outlook 2016 (IEO2016) Reference case, worldwide consumption of petroleum and other liquid fuels increases from 90 million barrels per day (b/d) in 2012 to 100 million b/d in 2020 and 121 million b/d in 2040. Much of the growth in world liquid fuels consumption is projected for the emerging, non-Organization for Economic Cooperation and Development (non-OECD) economies of Asia, the Middle East, and Africa, where strong economic growth and rising populations increase the demand for those fuels.
The EIA forecasts have never been very good, IEO 2016 is not an exception to that general rule. Oil (C+C) will peak by 2025 at the latest, probably more like 2020 (possibly 2015 will remain the peak). Perhaps we will see a C+C plateau between 80 and 81 Mb/d from 2015-2020.
Don’t forget these guys live in a world where oil production climbs relentlessly, they don’t usually project beyond 2040, but I see lots of forecasts which show C&C climbing above 100 mmbopd. In real terms what may happen is much slower growth or even an undulating plateau around say 85 mmbopd. Or maybe oil production already peaked?
Outfits like Fitch ratings have very little inside knowledge about oil, they use consultants. I have consulted for some of these mba types, and I know from the questions they ask that they are both ignorant about oil, and also not very interested in learning. Whenever I’ve tried to do nuances they get bored, stare at their manicure and interrupt to ask another dumb question.
Hi Fernando,
According to the latest EIA data World C+C is about 80 Mb/d. Do you think we are likely to see 85 Mb/d if prices remain under $70/b? If the answer is no, what would your guess be for the price needed to get us to 85 Mb/d, some places (OPEC and Russia) might be able to increase output, but there will be decline due to depletion elsewhere.
For World C+C I think an 80-81 Mb/d plateau seems reasonable unless oil prices rise above $120/b, and possibly even then it might only extend the plateau a bit with little rise in output (maybe from 80 to 81 Mb/d at most).
http://money.cnn.com/2016/11/07/news/economy/iran-energy-total-investment/index.html
Iran has managed to up production quite a bit recently, and with TOTAL coming in with the expertise and some of the money, and more money from elsewhere, Iranian oil and gas production might go up quite a bit more over the next few years.
saudi aramco suspends Egypt’s oil shipments until further notice:
https://www.bloomberg.com/news/articles/2016-11-07/saudi-aramco-suspends-egypt-s-oil-shipments-until-further-notice
It is about Egypt not doing things, non economic, that KSA wants. Some island territory was to change hands, and some military involvement in Yemen is demanded.
Good lesson here. There is no mention of KSA . . . or Egypt . . suggesting a higher price could make the oil flow. Money doesn’t decide things. Egypt can have that oil, if they do what they’re told.
The oil is part of the investment fund deal set up in April where Saudi invest directly in a Suez industrial zone and other ‘growth’ schemes in Egypt rather than giving direct grants and loans. The oil would have been paid out of the fund with Egypt paying it back at 2% over 15 years. I doubt if that scheme ever had much chance of doing anything positive except lining some politicians and industrial leaders pockets, and Saudi might be coming to the same conclusion
Egypt is not supporting Saudi policy in Syria. Within days of this transgression oil shipments were halted.
https://www.washingtonpost.com/world/middle_east/allies-saudi-arabia-egypt-in-rare-public-spat-over-syria/2016/10/10/cc54b6cc-8ef3-11e6-bc00-1a9756d4111b_story.html
https://www.middleeastobserver.org/2016/10/10/egypts-vote-for-russian-resolution-draws-wide-condemnation/
http://english.alarabiya.net/en/News/middle-east/2016/10/09/Saudi-Egypt-s-stance-on-UN-Syrian-resolution-painful-.html
Yemen
Production stats from Euan
http://euanmearns.com/oil-production-vital-statistics-october-2016/
Figure 10 with the Middle East OPEC rig count is interesting. Infill drilling for all they’re worth.
Euan’s comments on individual countries’ oil production (particularly Russia) show that he doesn’t know the facts about field start-ups, seasonal shut-ins for maintenance etc.
Baker Hughes international rig count came out yesterday: down 18 oil, up 5 gas, down 21 offshore, up 7 onshore. Norway dropped 7, Saudi 4 oil, Venezuela 2, Mexico 2. Angola and Nigeria combined now have only 6 rigs, down from a peak of 33 in late 2014. I think this generally reflects the general withdrawal of IOCs from frontier, deep and ultradeep (i.e. high upfront capital and long pay back times). Colombia added 5 rigs, which is in line with their plans from a few months ago, they don’t seem to be publishing any news for their energy ministry any more so have to wait for EIA or IEA numbers to see what impact these have.
Commentators get excited mainly about additions to the US oil rig count, but one decent offshore well might produce more than 10,000 bpd (admittedly maybe taking 6 to 12 months to plan and drill it and the water injector for support) and maintain that for 5 to 10 years (e.g. URR added is minimum of 15 mmbbls per year per rig), while a land rig is producing one well per month with URR of 200,000 bbls (URR added 2.4 mmbbls per year). So the cuts in offshore are having a much bigger medium and long term impact on supplies than the short term and relatively small gains from US LTO increases.
George
Colombia recently brought the OBA pipeline onstream exporting crude directly in to the Ecuadorian pipeline network. This has prompted shut in wells to be reactivated and a drilling program. Pipe capacity is 50K barrels per day but excisting pump capacity is 18K.
Considering that politics will obviously have a LOT to do with when non renewable resources peak, and what we do about it, and the results, it is worth taking the election into consideration, over in the other thread.
Question for any body who knows, or is willing to guess.
When the seismic work indicates you have found a significant amount of new oil, but you have not yet drilled the test wells to verify, how good are the estimates based on the seismic alone, compared to seismic plus test wells ?
I know this can only be answered in general terms, but how much , on average do actual test well production result in increasing or decreasing earlier estimates ?
And what is the longest the discovery of a major new field has been kept secret, if anybody knows?
OFM,
From my rather dated knowledge, seismic data is used to identify possible hydrocarbon “traps/prospects”. Oil is not identified by seismic although seismic sometimes may identify ” bright spots” offshore that can indicate natural gas accumulations.
Mike and Fernando can give you a better explanation than I could about how potential reserves are determined and risked.
It is very hard to keep something completely secret. There are just 2 many people and companies involved. When, I worked for a major in the Gulf of Mexico, my company’s security would sweep for listening devices in meeting rooms when we had bid meetings with partners.
When industry bid for the North Slope oil and gas leases, my company actually rented a train for its bid meetings with partners that went back and forth across Canada stopping only to let people on or off while they determined which tracts and the amounts to bid for each tract. Most of the people involved in that era are long dead.
Corporate America losing its positive image, oil companies featured: Corporate America doesn’t need lube.
I’ve a new post on the Permian, here.
KSA is finished. Acording with today’s Pioneer investor presentation, the Permian will be producing 10 million barrels per day in a few years. No mention about profits.
Ten million BOPD, WOW !! That’s amazing. Shallow, the price of oil is going to be 10 cents a barrel, just like the ‘ol East Texas Field days.
http://www.executiveoilconference.com/eoc-confagenda
There is lots of KoolAid to drink in Midland today. Everybody is making money @ $40+ / barrel! But no one is explaining the 3rd/4 10Ks either. All the slides shown were IPs & 180 day production declines.
Mike….you old hard head you!!!
I am glad you went to this, John; the program looks interesting and probably something I would have walked out on in the first hour to have gone at looked for a beer joint somewhere. I know several in Midland. I am indeed very hard headed about this kind of thing; more than anything, I hate being lied to. Apparently lots of people don’t mind being lied to and, in fact, or so arithmetic challenged, believe it. I probably should go see a doctor.
You raise an excellent question as for all the hoopla about lower costs and higher EUR’s: Pioneer, the jefe in the Permian, only squeaked out a 22 million gain last quarter. Apache lost a bunch (900M?), as did every other jefe-wanna-be in the Permian. Over a billion in losses, actually.
Here’s to borrowing money you can never pay back! God Bless Texas.
Well, I didn’t attend Mike. I looked at the agenda and didn’t want to waste my time or money. My brother attended and he filled me in while I took him to the airport. According to him, about 20% of the crowd were grey beards. The rest were all young guys.
It proves the adage that goes something like this; ” Its hard for someone to comprehend something if his paycheck depends on not understanding it.” Or words to that effect. Am I quoting or paraphrasing you here?
Harold Hamm would suddenly appear to be 90% probable as Secy of Energy. This should do . . . something for shale operations in NoDak and OK. Might want to check the expiration date on all the subsidies for solar and wind and . . . Tesla. Secy Hamm won’t be recommending extension.
OPEC JUST KNOCKED $20 OFF ITS OIL PRICE OUTLOOK
“OPEC warned in newly released report that oil prices might not rise above $60 per barrel until the end of the decade, in an acknowledgement that an array of bearish forces will conspire to keep a lid on any price rally.”
http://oilprice.com/Energy/Oil-Prices/OPEC-Just-Knocked-20-Off-Its-Oil-Price-Outlook.html
Hi Doug, thanks for the link.
How can OPEC increase production by 7 Mb/d? From which countries?
The OPEC countries having increased production by 10% or more since their local peak in 2005-2008 are Iraq, SA and UAE. All other countries are producing flat or are in decline.
Do they mean OPEC will include new countries? Russia?
It seems to be a political prediction.
Hi Chris,
Iraq supposedly can ramp up to 12 Mb/d, Libya by 1 Mb/d, Kuwait, Saudi Arabia maybe 2 Mb/d each. So that’s 13 Mb/d right there. Just kidding. 🙂
I agree. I think OPEC might be able to increase output enough to offset decline in the ROW for a few years (4 or 5 is my WAG). Or there might be a slow decline of 0.5% per year in orld C+C output, it will depend on oil prices which in turn are determined by demand.
Over the medium term I expect demand will increase and will drive up oil prices to $100/b by mid 2019 at least. I think it could be as early as mid-2018.