A post by Ovi at peakoilbarrel
Below are a number of oil (C + C ) production charts for Non-OPEC countries created from data provided by the EIAʼs International Energy Statistics and updated to December 2020. Information from other sources such as OPEC, the STEO and country specific sites such as Russia, Norway and China is used to provide a short term outlook for future output and direction for a few countries and the world.
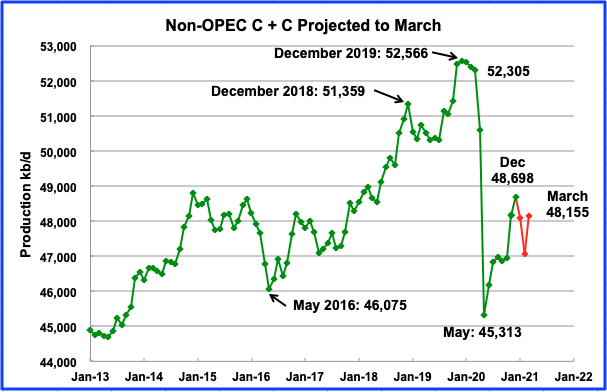
Non-OPEC production continues to rebound from the May 2020 low of 45,313 kb/d. According to the EIA, December output increased by 533 kb/d to 48,698 kb/d from November. The December increase was primarily driven by output increases from Canada (419) and the UK (109). From May 2020 to year end, production increased by a total of 3,385 kb/d.
Using data from the March 2021 STEO, a projection for Non OPEC output was made to March 2021. Output is expected to drop to 48,155 kb/d, which is a recovery from the February output disruption caused by the major snow storm in the L48 U.S. states.
Ranking Production from NON-OPEC Countries
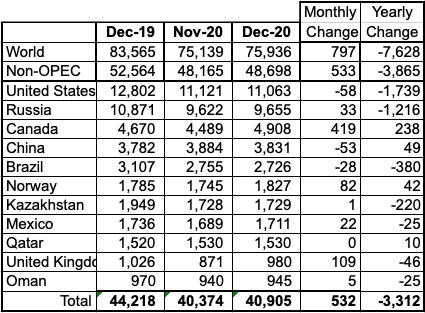
Above are listed the worldʼs 11th largest Non-OPEC producers. They produced 84% of the Non-OPEC output in December. On a YoY basis, Non-OPEC production decreased by 3,865 kb/d while on a MoM basis, production increased by 533 kb/d to 48,698 kb/d. World YoY output is down by 7,628 kb/d. The largest MoM increase occurred in Canada which also achieved a new record high output of 4,908 kb/d.
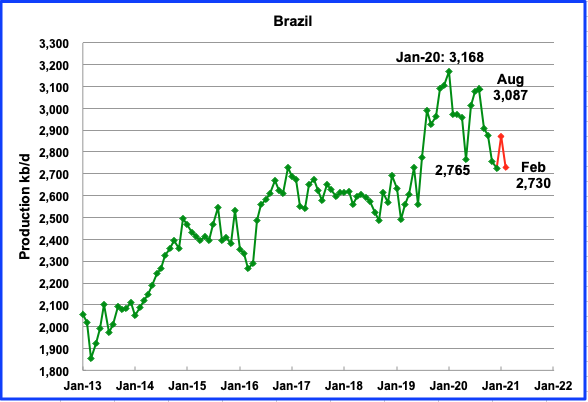
The EIA reported Brazilʼs December production was 2,726 kb/d, a drop of 29 kb/d from 2,755 in November due to prolonged field maintenance and the presence of Covid on their sea platforms, according to OPEC. According to this source the pre salt comprises 73% of Brazil’s production in February
According to this source February’s output dropped by 8% from January to 2,730 kb/d, (Red Markers). Maintenance and covid are continuing issues.
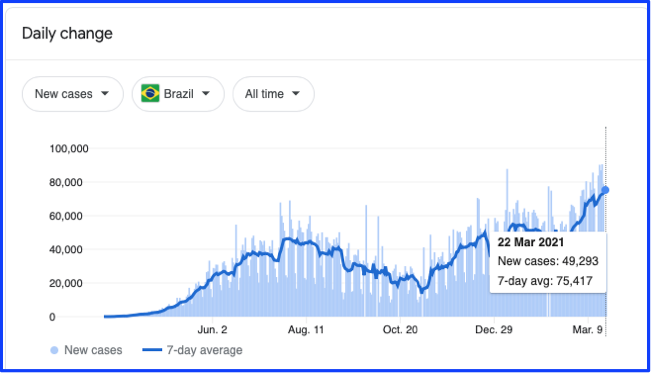
CV cases in Brazil’s oil basin is a big problem. Not a good scene.
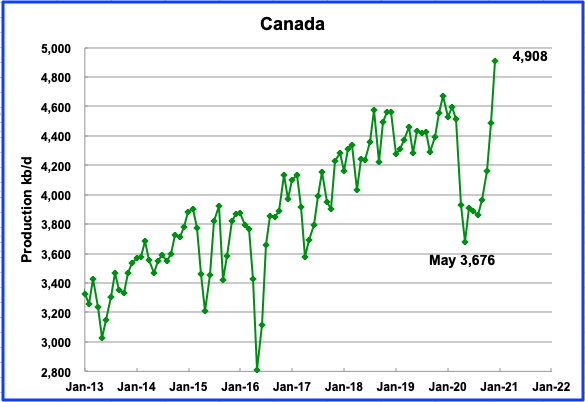
The EIA reported that December output increased by 419 kb/d to 4,908 kb/d. This is a new record. What is different this month is that Canadian production, according to the Canada Energy Regulator (CER) is 4,933 kb/d, which is only slightly different from the EIA info. Typically, the difference in output between the EIA and CER is close to 290 kb/d with CER being higher. Not sure if this is an error on the part of the EIA or a change in thinking and reporting.
Note that a major portion of Canada’s crude oil exports to the US are heavy oil and the gulf coast refiners have a substantial need for this crude to feed their cracking units.
Oil exports by rail to the US in December were 190.5 kb/d, up from 173.1 kb/d in November.
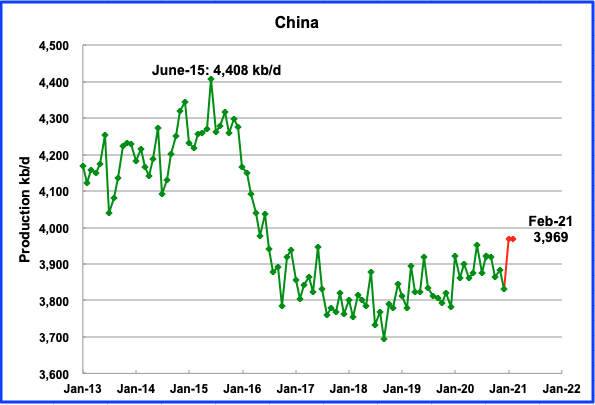
The EIA reported that Chinaʼs December output decreased by 53 kb/d from November to 3,831 kb/d. This source reported combined crude output for January and February 2021 to be 32.08 million metric tons. Averaging this over 59 days gave an average output of 3,969 kb/d.
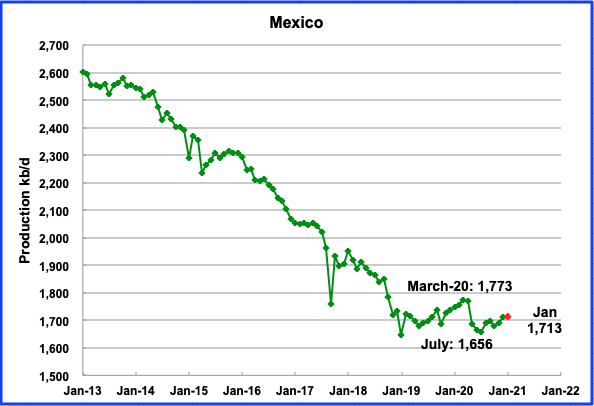
Mexicoʼs production increased in December by 22 kb/d to 1,711 kb/d, according to the EIA. Data from Pemex shows that January production increased to 1,713 kb/d (Red markers).

Kazakhstan’s output was unchanged in December at 1,729 kb/d. Their OPEC + partners have given Kazakhstan permission to increase their output by 20 kb/d in April from March to 1,437 kb/d. Note that the 1,437 kb/d is strictly crude.
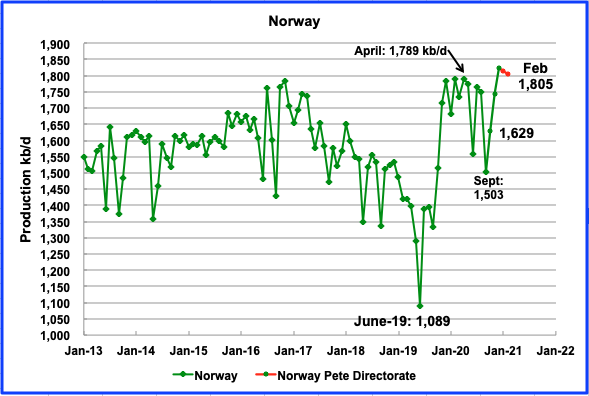
The EIA reported that Norwayʼs December production was 1,827 kb/d, an increase of 82 kb/d from November. Norway had an objective of producing 1,833 kb/d after phase one production started from the Johan Sverdrup field. Their objective met in December.
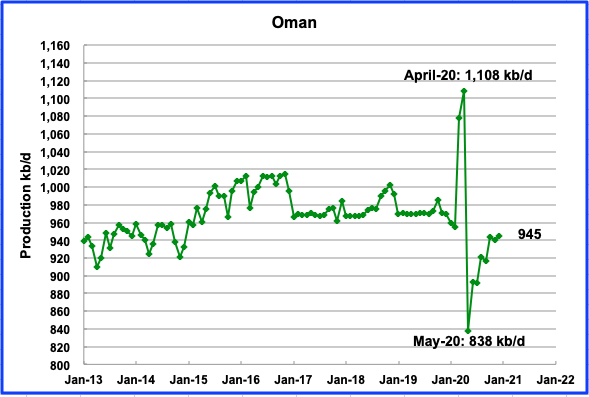
Omanʼs December production increased by 5 kb/d to 945 kb/d.
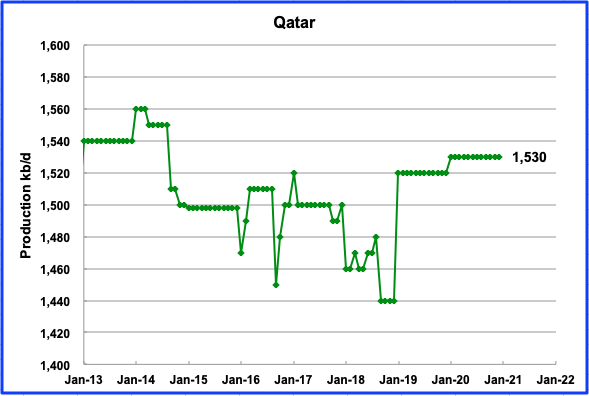
Qatar output remained steady at 1,530 kb/d in December.
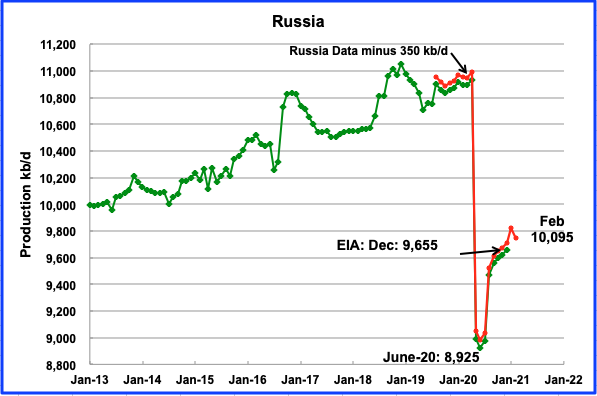
According to the Russian Ministry of energy, Russian production decreased by 75 kb/d in February to 10,095 kb/d. Russia’s OPEC + partners have given Russia permission to increase production in April by 130 kb/d from the March level of 9,249 kb/d. Will it happen?
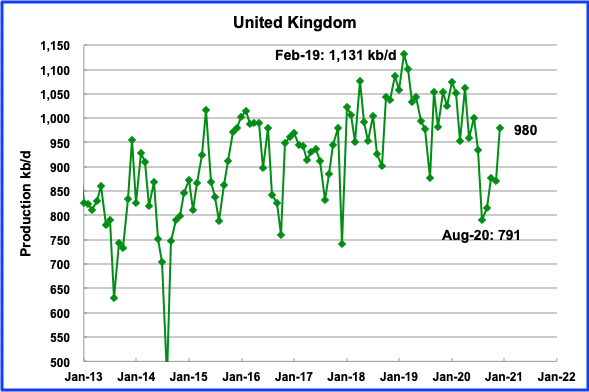
UKʼs production increased by 109 kb/d in December to 980 kb/d. The recovery from September to December was due to the completion of the planned summer maintenance. According to OPEC, UK production is expected to average slightly over 1,000 kb/d in 2021.
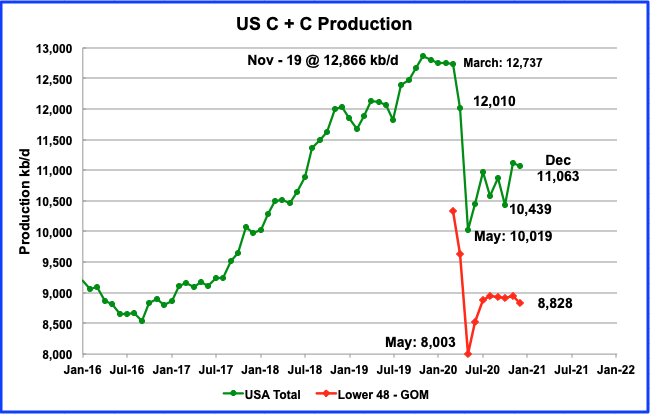
Decemberʼs U.S. production decreased by 58 kb/d to 11,063 kb/d from Novemberʼs output of 11,121 kb/d. December’s decrease was largely due to the top three producing states, Texas, ND and NM all having lower output.
The effect of the output decrease from these three states can be seen in the December onshore L48 production graph which shows a total drop of 127 kb/d to 8,828 kb/d. Of the 127 kb/d decrease, the three states contributed 114 kb/d, or 89.7%. The only significant increase came from the GOM which added 70 kb/d to December’s output.
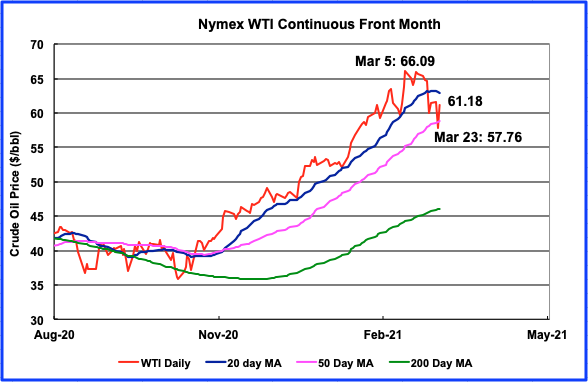
US oil production is very sensitive to the price of WTI. It has been very volatile over the past two weeks. It went from a high of $66.09 on March 5 to $57.76 on March 23. Yesterday, March 23, WTI dropped $3.79 to settle at $57.76. Today, March 24, it is up by $3.42 to settle at $61.18. It is difficult to believe that such volatility is occurring in the real crude market. Probably occurring mostly in the paper market.
Today’s increase is all the more perplexing because crude inventories rose by 1.9 million barrels in the week ended March 19.
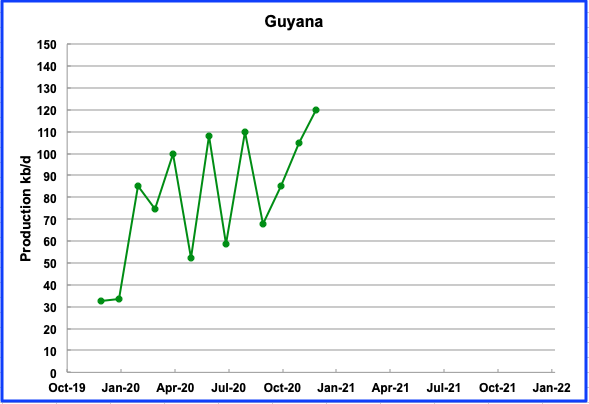
Guyana’s first offshore field reached full production in December according to this source. Their offshore fields are expected to reach 750,000 b/d by 2026
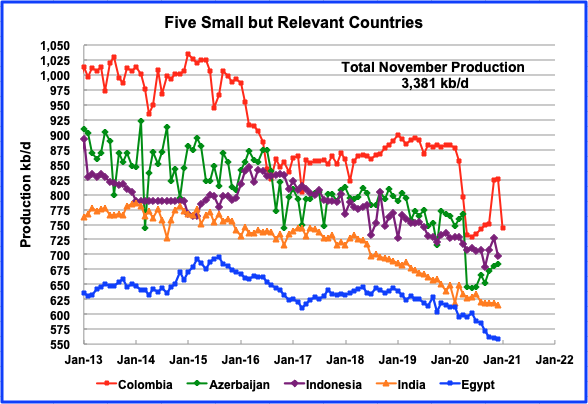
These five countries complete the list of Non-OPEC countries with annual production between 500 kb/d and 1,000 kb/d. Their combined December production was 3,381 kb/d, down by 30 kb/d from Novemberʼs output of 3,411 kb/d. Columbia and Azerbaijan appear to be recovering. However the EIA data for November and December is not consistent with data from Hydro Carbons Columbia (HCC).
The HCC reported December production of 759 kb/d, according to this source. However the EIA is reporting December production of 826 kb/d which is not consistent with the later source. For January, the HCC is projecting a production drop to 745 kb/d. (Last red marker for Columbia). Is the HCC just reporting crude??
World Oil Production
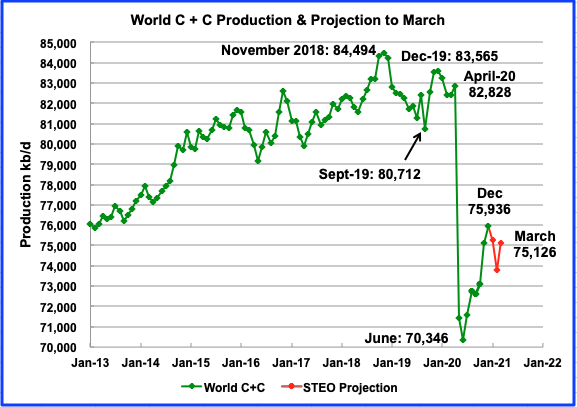
World oil production in December increased by 797 kb/d to 75,936 kb/d according to the EIA. The biggest contributors were Canada (419), UK (109), Libya (160) and Iran (127).
This chart also projects world production out to March 2021. It uses the March STEO report along with the International Energy Statistics to make the projection. It projects that world crude production will drop from December to March by 807 kb/d to 75,126 kb/d.
Ovi.
Unfortunately the paper market (or electronic market) is what most US producers are paid on.
As I have posted before, we are paid on a monthly average of the daily settles of WTI, less a discount which primarily is due to transportation expenses. Saturday and Sunday are the same price as Friday’s close, so we watch the Friday close a little more closely.
After a very difficult 2020, 2021 has been mostly good oil price wise. I thought prices might run a little higher, but COVID just has not subsided worldwide like I had hoped it would by now. Maybe this summer?
Shallow Sand
Thanks for the info. I hope that WTI stays up for you.
I used to follow a Cdn oil company that sold some of their oil on a daily basis and some a month or two forward, based on the settled price of WTI. I later found out that the CEO was a believer in peak oil and did well with oil on the rise to $147. The company doesn’t exist today.
Ovi.
We are able to hedge our production and we did that many years ago when we bought a considerable amount of production with money borrowed from a bank. This was in 2003-2004.
The hedge was not with the crude oil purchaser, but with a separate company.
Rather than fixing a price (SWAP) or fixing a price range (collar), we decided to buy floors, also known as puts. That limited our downside, but not our upside.
We were very, very lucky. We never collected one penny on the floors, as oil prices went up from late 2003-2005. Actually, our timing was incredibly fortunate all the way around on those transactions.
At that time, we paid $0.80-1.20 per barrel for the floors. I still receive a daily floor quote from Cargill. Similar floors today cost $4-6 per barrel. I’ll
Try to remember and post some examples next time I get a quote.
Hedging is the tool to use to offset the price volatility. But it isn’t easy and has gotten very expensive. It is also much cheaper to hedge 2021 production than 2022 and later years, which makes sense.
Project hedges, like we did, aren’t as difficult conceptually. You know what you need to pay the bank, and are willing to forego some profit to make sure you can pay the bank.
However, floors are so expensive now due to the extreme volatility. But using a fixed price or range is tough too. Many locked in prices in March, 2020, trying to avoid complete disaster. It looked like a good move for a few months, but if they hedged past the 2020 election, the tables have turned.
Having lived through crashes of 2008, 2014, and 2020, have to question why we still are involved with oil production. Add on the negative view of petroleum, makes it tough to think staying is a bright idea.
2020 does seem to have reduced the pool of buyers for stripper wells in our area. Haven’t heard of any transactions which amounted to anything.
Shallow Sand
Thanks for the insight. It is great to have someone here with real hands experience.
Ovintiv to sell Eagle Ford Assets for $880 M.
Debt-ridden Ovintiv Inc said it will sell its Eagle Ford assets in Texas to Validus Energy for $880 million, as the oil and gas producer seeks to shore up its finances following a tumultuous year for the energy industry.
In 2014, they paid $3.1 B for the properties.
https://www.ogj.com/general-interest/companies/article/14200083/ovintiv-to-sell-eagle-ford-assets-for-880-million
Everything Trump Touches Dies
Written by a Republican
Rick Wilson’s book and a founder of the Lincoln Project.
From what little I know about EFS, I’d say they got a good price per BOPD and BOEPD. I agree, measuring sales in this manner is a crude way to do it, and isn’t a very good way to value high decline shale.
Press releases say 21K BOEPD, 14K being crude and condensate.
Notice all of these sales are to private equity. I doubt private equity will burn cash on shale assets like the pubcos did. The owners of the PE are usually much more in control than shareholders of pubcos.
We were a bidder on assets owned by a PE firm many years ago. We weren’t successful bidder. For us, it would have been a huge deal, that would have been wonderful during most of 2003-14, and pretty much terrible since.
The sale process turned out to be a cluster. The guy running the PE firm was very involved, and when things got serious, the people who we determined actually owned the majority of the PE company were personally involved. It was their money, not OPM.
I’m sure things have changed and maybe PE has more free reign over OPM now.
Russia’s crude oil export set to drop 3pc in Q2 vs Q1
Russia plans to decrease its oil exports in the second quarter 2021 despite an OPEC decision to allow the state an additional output hike from April.
On a daily basis, Russia’s oil exports will drop by some 3% in April-June compared to the first quarter of 2021, Reuters calculations showed.
And no one asked why? There is a reason for everything.
Hint: Four of the five largest fields in Russia are located in West Siberia, Samotlor, Priob, Lyantor, and Fedorov. 61% of Russian production currently comes from Western Siberia.
Russia’s second-largest field, Romashkino, discovered in 1948, is located in the Volga-Ural Basin and is also in serious decline.
The five largest fields in Russia produce approximately 75% of Russian oil. And they are all in serious decline.
I wrote, in 2015: Reserve Growth in West Siberian Oil Fields
“Russian oil production will not get any help from reserve growth in Western Siberia. Old dying fields, like old dying men… do not grow.”
I really don’t like to brag, but I was dead on. From 2015 to 2019, Russian oil production increased by about 200,000 barrels per day per year, for a total of 800k barrels per day. That growth came from new fields in Eastern Siberia. The largest of those new fields, Vankor, peaked in 2019 at just under 500,000 barrels per day. Hell, even their new fields are starting to peak.
But those old dying fields did not grow one iota. They are all now in decline.
And world oil production is going to skyrocket, according to IEA and EIA projections. Of course.
Jean-Francois,
Consider that pre-pandemic World C+C output had been increasing at an annual average rate of 800 kbo/d over the 1983 to 2019 period, if the pandemic had not occurred we would expect that trend might have continued from the 2019 level of about 83 Mbo/d that would be 4000 kbo/d over the 2020 to 2024 period where we would expect annual output of about 87,000 kbo/d for World C plus C output in 2024.
The “skyrocket increase” in World C plus C output would simply be a return to trend, but note that I believe the peak will be about 86,000 kbo/d and will not be reached until 2029 at the earliest and I expect an undulating plateau at about 86 Mbo/d from 2029 to 2036 (with output fluctuating from 85.5 to 86.5 Mbo/d).
You should speak rather of the production plateau of 2018-2019. The growth of the previous years has been interrupted in november 2018. It is rather unlikeky that the production could have increased further.
Jean Francois,
There was an oversupply of oil that became apparent in Oct 2018 and oil prices tanked due to a large stock build. The plateau of 2018/2019 was simply the oil producers cutting back to balance the market (especially OPEC ). OPEC can readily put another 5000 kbo/d on the market if they believe there is demand for it at $75/bo.
In addition US output can return to previous peak at $75/bo (Brent in 2020 US$), and we will also see higher output from Norway, Canada, and Brazil. OPEC (particularly Iraq and Iran) can also increase output over several years to as much as 32 to 35 Mbo/d (compare with recent output levels of 25 Mbo/d).
World output will increase to beyond the 2018 annual peak, odds about 20 to 1. Monthly peak output is irrelevant imho.
About Brazil, the oil production will increase at most of 500 kb/d according to the post of George Kaplan. Currently, they are dealing with 3000 deaths/d due to covid pandemic. Even the activity on oil offshore installations seems disturbed. And the process of vaccination is very slow : only 2 % of the population is completely vaccined. How could they be able to increase their production in these conditions ?
About Irak, they are not going to produce oil to produce oil. Indeed, after different episodes of wars, UNO sanctions, invasion by US, insurrections againstt US and British troops and after EI insurrection, they did extract less than half of their oil reserves. Then, they are in very favorable position. As a matter of fact, they are using the oil rent to buy social peace more or less successfully. For that, they rose and maintained their oil production at 4500 kb/d or so, between July 2016 and Januar 2020, outside their OPEC quota as much as they were so pleased to do so. Obviously, this rate of production was a nice ompromise between their will to spare oil reserves and maintain an oil rent at an acceptable level as long as possible. Then, they have no incentive to produce more oil.
About Norway, by looking at the post of Georges Kaplan about current state of oil reserves and production, it seems rather unlikely that they will be able to increase significantly their oil production.
Four scenarios going forward:
1) Higher output and higher prices
Dennis?
2) Higher output and lower prices
“Brent crude oil prices will average $64 per barrel (b) in the second quarter of 2021 and then fall to less than $60/b through the end of 2022” (source)
– EIA
3) Lower output and higher prices
Many “Peak Oil:ers”
4) Lower output and lower prices
“Within a few months to a year, the worldwide debt bubble will start to collapse, bringing oil prices down by more than 50%.” (source)
– Gail Tverberg
Schinzy?
”I have long maintained that peak oil is a low price phenomenon, not a high priced phenomenon” (source)
No surprise if we see all 4 scenarios during this decade.
Hicks , a decade is too far out in the future . I will make a WAG .
Scenario 3 up to Sept . Scenario 4 post September . This is based on normal circumstances . Black Swan events are exempted . A drone strike on Ras Tunara or closure of Hormuz can happen and push prices to heaven .
I agree that all 4 scenarios are possible.
Scen 1 from 2021 to 2030, then Scen 3 from 2030 to 2037, then Scenario 4 from 2037 to 2070. I think Scenario 2 only happens perhaps in the 2033 to 2037 time frame when OPEC sees they may have stranded resources and pumps all out in a price war, we might see output rise while prices fall for a short time, but it will quickly shut down any new oil sands, deep water offshore, Arctic, and tight oil development and we will see output start to fall as oil prices fall in short order.
This will simply be due to demand falling faster than oil supply and will drive expensive oil from the market.
That’s how I see it, and no doubt this will be incorrect, like all other predictions of the future.
I think another scenario which might play out in my opinion is:
Lower output: Lower prices = Lower economic growth + rising prices of goods (Stagflation)
Iron Mike , your scenario is more likely . I have earlier commented ” Inflation in all things essential and deflation in all things non essential .”
HiH,
I agree with your statement. But one has to also be cautious of using the word essential for details of such a scenario. Would you consider housing an essential. I am supposing you would, in this scenario housing would (in my opinion) be deflationary. Because banks have to increase interest rates in an inflationary environment (CPI data) and housing (or any assets) in such an environment would drop as nominal interest rates rise, the high unemployment rate in such an environment would also contribute to the deflationary aspect of housing.
However other than that. You and I would see eye to eye as all essential goods would increase in price.
Quite a scary scenario if it where to play out.
The EIA’s latest Monthly Energy Review is out.
They have US C+C production falling 58,000 barrels per day in December, 108,000 bpd in January, and 591,000 bpd in February to 10,364,000 barrels per day. The huge February drop was due, mostly, to bad weather.
Ron,
Most of the drop in US C plus C output was from tight oil, which dropped by 512 kbo/d in February 2021. No doubt conventional output also fell in Texas in February which may account for the other 79 kbo/d (assuming the MER estimate for February is correct.)
Chart below has EIA’s most recent short term estimate for international oil output (all liquids).
Unfortunately they do not estimate future crude output for the World, one would need to make assumptions about the proportion of crude plus condensate vs all liquids in the future in order to estimate C plus C output.
I have trouble with this scenario given Rystad Energy’s investment outlook for 2021: flat with respect to 2020 which was 35% below that of 2019 which only got 2019 extraction rate just shy of 2018. See https://www.rystadenergy.com/newsevents/news/press-releases/drilling-activity-is-set-for-two-consecutive-years-of-growth-but-will-lag-pre-pandemic-levels/
Schinzy,
Great piece, thank you.
Note that not all wells are created equal so simply looking at wells completed in various years does not tell the whole story, for US tight oil, much of the investment will be in the Permian basin which has higher output wells than the Eagle Ford or Niobrara (but somewhat lower than the Bakken). Much of the forecast increase in US output is tight oil and most of this will be from the Permian basin.
The scenario below assumes a modest increase in well completion rate from 355 new wells per month in March 2021 to 460 new wells per month in Dec 2022 (an increase of 5 wells each month). Clearly future completion rates are unknown, but the trend in frac spreads and horizontal oil rigs is up, suggesting that future completion rates will also increase.
See also
https://oilprice.com/Energy/Energy-General/OPECs-Biggest-Fear-Is-Becoming-A-Reality.html
Dennis
Here is the C Plus C chart to to December 2022. In the original chart in the post above, I only took it out to March 2021.
The March STEO report along with the International Energy Statistics are used to make the projection. It projects that world crude production December 2022 will be 81,759 kb/d, 2,735 kb/d lower than November 2018
Ovi, thanks for a great chart. And even this, 2,735 kb/d below the previous peak, I think is overly optimistic.
I think, at least two of the world’s three greatest oil producers have peaked, (The USA, Saudi Arabia, and Russia), have peaked, and the rest of the world has clearly peaked, there is no way we can possibly surpass that 2018 peak. Actually, I think all three have peaked. I was just being conservative.
World less USA, Saudi Arabia, and Russia peaked in 2017. All three peaked, yearly average, in 2019. Of course you can argue that this is just the peak “so far”. But I do not believe any of the three will ever surpass their 2019 yearly average peak.
Ovi and Ron,
Great charts, thanks.
Ovi does not explain how he makes his estimate from the STEO all liquids forecast from Jan 2021 to Dec 2022. Below I use the trend in the ratio of World C plus C to World petroleum liquids from Jan 2017 to Dec 2019 to estimate World C+C from Jan 2021 to Dec 2022. Note that beyond Dec 2023 the EIA expects World petroleum liquids will continue to increase, I agree with their assessment to about 2030 (International Energy Outlook).
Monthly output reaches 82335 kbo/d by November 2022 by my estimate and centered 12 month output reaches 81522 kbo/d in July 2022, the peak centered 12 month output was 83009 kbo/d in December 2018. I expect that World C plus C output will continue to rise in 2023 to 2028 to at least 84000 kbo/d, but I think 86000 kbo/d is possible before a plateau in output is reached (2029-2036). A scenario with lower output (such as 84000 kbo/d) might see a longer plateau (2026-2040 perhaps).
Much depends on future demand, future oil prices, and the speed of the transition to electric land transport and continued expansion of telecommuting over time.
Chart with World C plus C to World Petroleum liquids used for scenario in chart above.
Dennis
The methodology was discussed with you when I first put out the future estimates for C plus C . It is the same as you have done. However recently the ratio I use has changed. Now I use the ratio of NGPLs to C C averaged over the last six months since they have been very steady at close to 0.25. I am thinking of trying another approach. Not quite sure how one tells which one is better, but simplicity helps.
As for explaining how to do it, I figured telling our participants it is derived from a mix of using the STEO and the International Statistics is sufficient. If someone was interested in the details, I felt they would ask. If they did, it would provided.
Comparing the November estimates. Your estimate is 82,335 kb/d. Mine is 81,961kb/d. A 1/2% difference.
Ovi,
I couldn’t remember how you did it. So you look at absolute value of non-crude petroleum liquids and take the average of the past 6 months and then assume it will remain constant thereafter?
Below I consider total liquids minus crude and find the trend from 2005 to 2020 and then extend that trendline to December 2022. I deduct the non-crude liquids estimate from the STEO all liquids estimate from Jan 2021 to December 2022 to get the estimate below.
Sorry about small chart, click on chart for larger view.
Dennis
The primary info I use is the Ratio of the non-crude world liquids to the world C plus C. I then take a six month average of the and use it to project out to December 2022.
As you can see in the attached chart, that ratio began to change very rapidly in July 2020 due to the drop in OPEC production. When that big change occurred I cut back to a three month average and have increased to six as more monthly ratios came in above 0.25. It is not clear where the ratio will settle out now that OPEC Plus and the US are starting to increase production since it is now starting to drop. As I noted in my previous response there is only a 1/2% difference between the two methodologies.
The biggest variable in this exercise is the EIA projection, which I believe is an economic model which is very price driven and with very little geology input. This may be OK for about the next year since there is so much shut in capacity.
However moving into 2022 and beyond, there is much speculation on the effects of lower investment and drilling on world oil production that the value of a purely economically driven model is questionable. Regardless, our efforts are an interesting exercise that invites some interesting views from our knowledgeable participants.
Ovi,
I started with the ratio idea, perhaps based on previous conversations with you. I realized we have the non-crude data and it seems to me it is independent of crude output, so I decided to look at the trend of non-crude output from 2005 to 2020 (crude is short for C plus C).
Also looking at your chart, it is clear the pandemic has ruined any consistency for you preferred method. I would throw out any data from 2020 or use a longer period such as 2005 to 2020 for your method and look at the trend over the longer period. In any case the future is unknown and all assumptions about it are likely wrong.
Dennis, you wrote: Below I use the trend in the ratio of World C plus C to World petroleum liquids from Jan 2017 to Dec 2019 to estimate World C+C from Jan 2021 to Dec 2022.
Okay, you use past trend lines to estimate future production. Well, I guess there is also how the EIA does it and the IEA does it. I just don’t have confidence in that type of analysis.
Above I have charted past World oil production less the USA, Russia, and Saudi Arabia. There is clearly a trend there. Do you think this trend will continue?
World C+C production in 2018 averaged 82,897,000 barrels per day. In 2019 that average was 82,306,000 barrels per day. I have little doubt that future world oil production can come close to those averages. But I would bet my SS check that the 2018 peak will never be surpassed. (I like annual averages but if you like centered 12-month averages, then go with that.)
At any rate here are four possible sources for a surge in World oil production:
1. THE USA
2. Russia
3. Saudi Arabia
4. The World less USA, Russia, and Saudi Arabia
If World oil production is yet to peak, which one, or ones, of these four sources, will it come from?
Ron,
The problem is that we do not have an actual World C plus C estimate from the EIA STEO, they only give us Petroleum liquids output. So to estimate World C plus C I use the trend in the ratio of World C plus C to all petroleum liquids over the Jan 2017 to Dec 2019 period to estimate this ratio in the future. Of course this trend might change in ways that are impossible to estimate.
I am simply being transparent in how I make my estimate of future World C plus C from Jan 2021 to Dec 2022.
As far as the trend continuing, there are good reasons for expecting that World output of NGL will continue to rise as natural gas output continues to rise so I would expect the future ratio of C plus C to all liquids to continue to fall, though the rate may be higher or lower than the rate from 2017 to 2019.
There are also good reasons to expect that higher oil prices will lead to a change in the trend for World output from the downward trend from 2018 to 2021 to an upward trend from 2021 to 2030, my guess is the peak for World C plus C occurs around 2030 to 2035 at roughly 86 Mbo/d.
I doubt that combined output annual average output from the US, Russia, and Saudi Arabia has reached a final peak. Russia may have peaked, I am not familiar with the possibilities for new fields in eastern Siberia, I believe I have seen reports that suggest a plateau near the recent 12 month peak output can be maintained for 5 to 10 years. Saudi and US output can surpass previous annual output peaks with sustained Brent prices above $75/bo (2020 US$) in my view.
In addition, we may see rising output from Canada, Brazil, and Norway over the next 5 to 10 years. I also expect output increases from the other large OPEC producers such as UAE, Kuwait, Iraq, and Iran.
The drop in World minus KSA, US, and Russia C plus C output since 2018 has mostly been due to a combination of lower oil prices and OPEC reducing output to try to bring oil prices back up, basically we have had an oversupply of oil since October 2018, mostly due to higher output from US tight oil over the 2017 to November 2019 period.
Things may look different in the future as the World economy recovers from the effects of the pandemic, demand for oil increases and oil prices rise. We will see.
I believe I have seen reports that suggest a plateau near the recent 12 month peak output can be maintained for 5 to 10 years.
No Dennis, you have not seen that. I posted that myself some time ago. Russia stated that they hoped to hold production at about 11.2 million barrels per day for the next four years, 2021 through 2024. I have since lost the link but it was posted right here on this list. However, I think that was wishful thinking on Russia’s part. I don’t think they will hold that level, ever again.
The drop in World minus KSA, US, and Russia C plus C output since 2018 has mostly been due to a combination of lower oil prices and OPEC reducing output to try to bring oil prices back up,…
I am not talking about the drop since 2018, I am talking about the peak and decline before 2018. The peak month in my chart above was November of 2016 at 52,206,000. The peak 12-month average was September of 2017 at 51,161,000 barrels per day. At that point, in September of 2017, the World less USA, Russia, and Saudi produced 63% of all World production. 63% of World oil production peaked in September of 2017.
While World oil production was peaking in 2018, due to increased production by the USA, Saudi, and Russia, the World less these big three was declining to 50,737,000 barrels per day, the average for 2018. A decline of almost half a million barrels per day.
Dennis, regardless of what happens in Canada, Brazil, and Norway over the next 5 to 10 years, the World less the big three peaked in 2016 monthly and 2017 annually. Any increase in World production must come from one or more of the big three.
Dennis , your post on the last thread .
”I stand by my estimate, in 2020 World C plus C output dropped by 5.5 Mbo/d due to a lack of oil demand and the resulting drop in oil prices from the 2019 annual average, so a 10 Mbo/d increase from the 2020 level (annual average) of C plus C output requires a return to the 2019 average level (roughly 82.3 Mb/d) requiring a 5.6 Mbo/d increase and then a further 4.4 Mbo/d increase in output to reach 87 Mbo/d.
If World demand for C plus C warrants such an increase by 2028, I believe it can be produced, and yes the model accounts for depletion, which has been ongoing since the first barrel of oil was produced. The basis for the estimate is likely World resources of 3400 Gb of C plus C (this includes the 1428 Gb of crude plus condensate that was produced from 1860 to 2020), remaining resources (this includes conventional and unconventional C plus C) are about 1972 Gb (this includes future discoveries and reserve growth).
It is possible less will be produced due to lack of demand, if a rapid transition to non-fossil fuel energy sources occurs, I hope that is the case, but I am skeptical”
Well, 2020 production came in at an average of 75.93 mbpd . Decline rate was 7.5% compared to 2019. How will you achieve additional 10 mbpd by 2028 ? Ron is correct . Igor Sechin boss at Rosneft confirms what Ron has stated , shale party is over , KSA is going to cut domestic consumption by 1mbpd so that it can export that oil . Sorry, Brazil , Norway ,Tom Dick and Harry are in no position to cover this lag in production .In the future decline rates will increase as horizontal wells reach their limits of extraction . You must rethink your models with the new facts . Your statement “If World demand for C plus C warrants such an increase by 2028, I believe it can be produced ” does not hold water . Your belief or mine is irrelevant . Geology prevails .
Hole in head,
We will see. The decline in output since December 2019 has been due to a combination of oversupply (due in part to the spat between Russia and KSA) and lack of demand due to the pandemic.
The geology has not really changed since late 2020. The resources that have not been produced due to low levels of output in 2020 and 2021 remain in the ground and will be produced later.
Ron,
OPEC has been holding back production since 2017 in order to get oil prices up, how much different nations produce depends on their cost of production relative to price, I focus on World output from World resources without trying to determine individual national output profiles (with the exception of tight oil in the US where I have fairly detailed information from shaleprofile.com and the EIA.)
A decline in output for the World has occurred since 2018 because oil prices dropped due to oversupply of oil relative to demand.
If we see Brent oil prices remain at an average price of $75/bo (2020 US$) or higher for a 12 month period or longer, and no new 12 month average peak for World C plus C is reached, then perhaps peak oil (the final peak) has been reached.
I am confident that the current 12 month centered average peak (83009 kb/d in December 2018) will be matched or surpassed by December 2026. Time will tell.
OPEC has been holding back production since 2017 in order to get oil prices up, how much different nations produce depends on their cost of production relative to price,
I don’t see any evidence to support that statement. Average OPEC production in 2018 was only 170,000 barrels per day below the average for 2017. If they were holding back, they weren’t doing a very good job of it. I think they were producing flat out all three years, 2016 through 2018.
Average 2016 – 31,701 (Peak)
Average 2017 – 31,507
Average 2018 – 31,336
Ron,
What were oil prices like in 2017? Why does OPEC exist?
The purpose of OPEC is to restrict output to keep oil prices high (admittedly they do a poor job of this).
Chart below has centered 12 month average Brent oil spot price data from EIA. I remembered incorrectly, OPEC likely started cutting back on output in the middle of 2016 to get oil prices higher, it worked until oil prices rose enough to get US tight oil back up to high enough levels that another glut arrived in late 2018, leading to another fall in oil prices (though less severe than the plunge from 2014 to 2016.)
I remembered incorrectly, OPEC likely started cutting back on output in the middle of 2016 to get oil prices higher,
You remember very incorrectly. OPEC, in the last months of 2016 was emptying their storage tanks in order to produce as much oil as they could. They would set their quotas on the amount produced in November and December of 2016, so they were making heroic attempts to produce every barrel possible in order to get a higher quota. (November 2016 was the OPEC all-time peak. And in my opinion, will remain so forever.)
They started cutting in January of 2017. But by June everyone was cheating and they were all, by July 2017, producing flat out.
Why does OPEC exist?
OPEC was formally constituted in January 1961 by five countries: Saudi Arabia, Iran, Iraq, Kuwait, and Venezuela. They existed then for the sole reason of trying to drive oil prices higher. They would like to do that today but squabbling among members has made them somewhat of a joke. They are a disorganized bunch of buffoons. Yes, they have dramatically cut production during the pandemic. But so has everyone else in the world. The bottom dropped out of demand so everyone cut production trying to save money.
A decline in output for the World has occurred since 2018 because oil prices dropped due to oversupply of oil relative to demand.
Okay, but what about 2017 and 2018? OPEC could not keep their members in line and by June of 2017 everyone was again producing flat out, causing that oversupply. And their cut was a pittance anyway, not enough to make much difference. For most of 2017 and all of 2018, every OPEC member was producing every barrel they could. (With the exception of Iran and Venezuela of course, but that is another story for another thread.)
Just look at the chart Dennis, that is just so damn obvious it cannot be denied.
Ron,
Yes, you are correct, I was guessing based on the oil price.
So output increased due to quota dance as usual, then output was cut to raise prices, that would explain the “peak” in 2016, which is far less pronounced when we look at 12 month average (which is the metric that matters in my view). Basically there is a plateau from 2016 to 2018 (based on centered 12 month average for OPEC C plus C output.
Look at the prices in 2017 and 2018, very low compared to 2011 to 2014. Also you are ignoring Libya, Iran and Venezuela where output crashed for a variety of reasons. If you want to look at OPEC consider OPEC minus those three nations, since 2016.
For OPEC minus Iran, Libya, and Venezuela the centered 12 month average peak was 26759 kbo/d in January 2019.
You are correct that there are fluctuations in output as OPEC nations vie for larger production quotas, but I see a plateau in OPEC output from mid 2016 to mid 2018, chart below.
misspelled output on chart sorry.
Click on chart for larger view.
For OPEC minus Iran, Libya, and Venezuela the centered 12 month average peak was 26759 kbo/d in January 2019.
Okay, you need to update your nations here. Libya is already back, producing at maximum possible capacity for the last 4 months. Venezuela will never be back, not in the next decade anyway, long after peak oil is history. That leaves only Iran. Iran, if sanctions were lifted today, could possibly increase production by approximately 1.6 million barrels per day in the next six months or so. That would not be nearly enough to make up for the natural decline in OPEC, especially Saudi Arabia, since the peak in 2016.
Iran is the only nation on earth that can possibly increase production in any significant amount. So you should only deal with Iran when talking about possible OPEC production increases.
Dennis, OPEC has done nothing but basically tread water since 2005. Why do you think they will now save the world?
(In the chart below 2021 is only two months, January and February.
Ron,
OPEC does not produce at maximum output, except when fighting for quotas. Also they do not develop their resources nearly as fast as non-OPEC nations.
They cannot increase output forever, just to higher levels than the 33.5 Mbo/d produced over the 2016 to 2018 period, possibly 35 or 36 Mbo/d. Also US, Canada, Brazil, and Norway can increase output. It will not be just OPEC that increases output.
OPEC does not produce at maximum output, except when fighting for quotas.
Dennis, OPEC is not an oil company, they are a cartel. The only ones that increased when battling for quota were Saudi, the UAE, and Kuwait. The rest just produced flat out all the time. Check the charts.
Yes, they were all producing flat out most of the time. Only in a few instances did they actually cut production. Of course, the pandemic hit everyone. But as you can see by the yearly chart I posted their total share of the market has shrunk dramatically since 2005.
Dennis, OPEC peaked in 2016. Saudi Arabia is in decline. End of story.
Ron,
Good point about past trends lines being a dubious predictor of future trends. This is testable too. In this case three years of past data was used to predict the future.
If there is 40 years of data, you could run the algorithm on 35 three-year data sets and check the accuracy of the prediction. That would give you some idea of how likely the latest prediction is to be accurate.
My guess is that the accuracy is fairly low, but checking would reveal the truth.
Alimbiquated,
I agree, I have also done a scenario with non-crude liquids trend from Jan 2005- to December 2020 (16 years). This is used to estimate non-crude liquids (where crude means C plus C) from Jan 2021 to Dec 2022. This estimate is deducted from the STEO all liquids World forecast to estimate C plus C output from Jan 2021 to Dec 2022.
see link below to comment
http://peakoilbarrel.com/december-non-opec-oil-output-continues-rebound-from-may-low/#comment-715605
The future can never be predicted regardless of method.
As to prediction out to 2038, I use the shock model which uses past production (1870-2019) and a dispersive discovery model which accounts for past discoveries and reserve growth as well as producing reserve estimates for conventional oil resources which gives an idea of past speed of development of discovered resources. Also we use geophysical estimates of ultimately recoverable resources (3000 Gb conventional and 400 Gb unconventional recources). Past extraction rates for conventional resources can be estimated with the model as well as remaining resources. Assumptions need to be made about future development of undeveloped resources and future extraction rates. There are as always an infinite number of possible future paths which would be compatible with an infinite number of possible assumptions about the future. Odds that any one scenario chosen will be correct are exactly zero.
These models are not based on trends. For a full explanation see
https://www.amazon.com/Mathematical-Geoenergy-Discovery-Depletion-Geophysical/dp/1119434297
Your local University may have a copy.
Recent version of model in comment below.
Recent Oil shock model referred to in comment above.
click on chart for larger view.
Note that OPEC output has decreased by 5844 kbo/d from 2018 to 2020. If that output comes back online, World output increases to 81992 kbo/d before accounting for increases from Russia and the US. Russia can likely increase output by 1000 kbo/d from recent 12 month average levels and US can likely increase output by at least 1100 kbo/d from recent 12 month average levels.
Add it up and we have 84092 kbo/d, before we account for increases from Brazil, Norway, and Canada, the increases there will at least equal declines elsewhere in the World.
This is why claims that the current peak will not be exceeded seem specious to me.
In November, Saudi Arabia’s domestic crude stockpiles fell to 17-year low:
“Saudi Arabia’s domestic crude stockpiles fell by 1.2 million barrels in November to 143.43 million barrels, the lowest since November 2003.” (source)
This trend continues and in January, stockpiles fell to 137.207 million barrels:
“The country’s domestic refinery crude throughput rose to 2.343 million bpd while crude stocks fell to 137.207 million barrels in January.” (source)
From http://www.jodidata.org:
SA needs to go back to a hunter/gather economy with less than 1 million people.
The current society, meme infected by toxic religion, and living off excess energy, is primitive and destructive.
We shall see——
We will apply sanctions and abuse you but please give us your oil .
https://www.rt.com/business/519108-us-import-record-oil-russia/
Also Saudi facility is under drone attack as per Saudi govt .
https://www.spa.gov.sa/viewfullstory.php?lang=en&newsid=2207999#2207999
The US is not asking Russia to give them oil. They are paying a pretty penny for it. Well, freshly minted dollars actually.
The USA does not import oil from Russia.
Europe and China, yes.
Importers of Russia crude, in order, as of 2019
China, Netherlands, Germany, Korea
https://www.statista.com/statistics/1100591/russia-main-crude-oil-export-destinations/
In an article Steven Kopits wrote “In its February Short Term Energy Outlook (STEO), the EIA forecasts this month’s world oil consumption at 96.7 million barrels per day (mbpd). The oil supply, however, is much lower, only 93.6 mbpd, with the difference of 3.1 mbpd of necessity being drawn from crude oil and refined product inventories. This is a shortfall of 3.5% ”
Is he correct ? if yes ,then are we in trouble ?
There could be also delays in oil supply coming fromMiddle-Est as Suez channel is temporarily blocked.
Hole in head,
Better to focus on crude output and crude and petroleum product stocks. Much of all liquids output (about 17 to 18 Mb/d) is NGL, biofuels, other liquids, and refinery gains. The really useful stuff (petrol, gasoil/diesel, jet fuel, and bunker fuel) comes from crude oil. Stocks have been very high since early 2020, now they are approaching the latest 5 year average, as petroleum stocks reach that average 5 year level, oil prices will rise and oil output will also rise to meet demand.
Short answer is no we are not in trouble from a shortage of oil, maybe by 2030.
link to Kopits piece, he is very good. His thesis is that $100/bo is possible, if OPEC keeps output low. Note that $100/bo will lead to a sharp increase in tight oil output and I doubt OPEC would maintain discipline, in other words output from OPEC would increase and for that reason I expect Brent to hover in the $70 to $80/bo range (2020 US$).
http://www.prienga.com/blog/2021/3/8/explaining-the-road-to-100-oil
These guys were not cutting, they were declining.
Ron,
You need to take Venezuela, Libya and Iran out of that chart as well to see the true decline of OPEC producers due to geology rather than simply politics.
Chart below for 2010 to 2019 shows an annual decline rate of 166 kbo/year for OPEC minus KSA, Iraq, Kuwait, UAE, Iran, Libya, and Venezuela. I leave out 2020 because decline was mostly due to the pandemic after March 2020.
I agree this group of smaller OPEC producers has likely been producing flat out. As a group they produced about 17% of OPEC output in 2019 (5339/31314). The annual decline rate of this group over the past decade (2010-2019) was about 2.7% per year (166/6049).
As a group, OPEC has not been producing flat out except perhaps just before quotas are decided. I believe your assumption of constant flat out production for all of OPEC is incorrect.
As regards consumption, I see no evidence in the daily death numbers of Covid that the vaccines are having any effect. Deaths began to decline in early January at the peak, due to measures taken or maybe just natural behavior (the vaccines were not out yet when the decline began), the rate of decline established a slope, and that slope has not become more steep — which it should with 70% of the 65-plus population now vaccinated.
Something is going on and the curve suggests there will be no end to this. Odds are perhaps high that the variants have outrun the vaccines. Go track down the daily deaths graph and see for yourself.
Death rates started to decline continuously about 6 weeks ago according to this article, and now seems to be increasing which is quite odd.
https://news.yahoo.com/global-coronavirus-deaths-rise-1st-195128442.html
I don’t think anyone has a clear picture of what’s going on.
People are being much less cautious in the last couple months, around the world.
The more infectious variants are more prevalent.
Nonetheless- death rate/100K is way down from the peak in the usa
https://covid.cdc.gov/covid-data-tracker/#demographicsovertime
I think it instructive to recall oil and gas investment history. Unregulated oil and gas markets have always yielded boom bust cycles. There was a bust cycle from 1986 to 2000. A boom cycle started in 2001 with investment in oil and gas rising on average 11% per year to $780 billion in 2014 (this was from a Kopits talk in 2014, but the link I have no longer works).
There is a lag between increased or decreased investment and the response in extraction rates. The lag is longer offshore than onshore. For example, in spite of the investment boom from 2001 to 2014, extraction rates were stagnant between 2005 and 2010.
A bust began in 2015 with investment dropping 25% in 2015 and a further 20% in 2016. The drop was more pronounced offshore than onshore. Investment stayed essentially flat through 2019. Extraction rates continued to climb through 2018 but were flat in 2019.
The IEA began warning in 2016 that investment was not sufficient to meet demand in the early 2020s. In their 2019 WEO they stated that $650 to $750 billion was needed annually to attain 106 mb/d in 2030. I am assuming this sum referred to oil AND gas investment. In 2019 oil and gas investment was $483 billion. In 2020 it was $313 billion (close to 2009 levels).
As Dennis noted in response to my comment above, the relationship between a drop in investment and the corresponding drop in supply is not linear. But unless investment increases, I don’t expect extraction rates to achieve 2018 levels soon.
Ovi. I appreciate your posts. Thanks.
Schinzy. Look at what the integrated oil companies are forecasting. BP, RDS and TOT are shrinking production. CVX and XOM are greatly reducing CAPEX. So is COP, the largest independent. So is PXD, one of the largest shale players. Of course, these companies can change strategy quickly, likely next year if any do.
For the first time I can recall, the government of the United States is not supportive of it increasing production. Contrary to popular belief, this matters.
To keep a lid on oil prices, on the supply side, either the USA needs to keep adding barrels or some other country that does not benefit as a whole from high oil prices will need to step up. The CAPEX currently isn’t budgeted to do that.
Of course, decreased demand due to the continued spikes in COVID cases will continue to put a lid on demand. Hopefully by fall this won’t be much of an issue, not for oils sake, but for public health sake.
The other demand side lids I see could be Western EV adoption offsetting developing world oil demand growth. Worried here about both the needed upgrades to the grids, plus the lack of rare earth metals. The other could be another big economic issue. Don’t want that, but seems economy issues are also going to be with us given the high debt levels. The stimulus in response to COVID isn’t cheap.
All very true Shallow. I suspect these companies are reducing CAPEX because of increasing debt. The more conservative CAPEX spending seems to be helping their share prices.
Schinzy.
IHS Markit doesn’t see US CAPEX spending at the 2018-19 levels returning until 2024-25. Probably too far out in the future to be accurate. However, it’s 2021 forecast is for lower CAPEX in all years since 2010 except for 2020.
I will add another big player to my list above, EOG also lowered CAPEX guidance for 2021 from where it had been pre-pandemic. Will seek to hold production flat in 2021.
Shallow sand,
I think tight oil CAPEX spending plans will change markedly if oil prices rise to $75/bo or more, these plans can be changed relatively quickly onshore, offshore output response to higher oil prices will see a 3 to 5 year lag from any significant oil price increase.
Note that if all of the conservative CAPEX guidance holds, oil prices are very likely to increase to $80/bo or more, especially if OPEC maintains output discipline (I doubt that will be true at oil prices over $75/bo, that is the fundamental problem with cartels.)
To consider long term decline rates for the World, I took a group of 12 nations including 9 large producers (United States, Saudi Arabia, Russia, Iraq, Kuwait, UAE, Canada, Brazil, and Norway) and 3 nations with fluctuating output due to sanctions and/or political difficulties (Iran, Libya, and Venezuela) and deducted their output from the World total C plus C output.
The 12 nation group saw an average annual increase in C plus C output of 1419 kbo/d over the Jan 2010 to March 2020 period. For the World minus the 12 nation group, C plus C output decreased at an annual rate of 455 kbo/d.
The 12 nation group might not see annual C plus C output increases of 1400 kbo/d in the future, but it will take time for the rate of increase to fall to 455 kbo/d (where a plateau in World output would occur) especially if oil prices rise to $80/bo or more.
The 12 nation group might not see annual C plus C output increases of 1400 kbo/d in the future, but it will take time for the rate of increase to fall to 455 kbo/d (where a plateau in World output would occur) especially if oil prices rise to $80/bo or more.
No, it will not take time. Why would you think production would graduallly fall off? Yes, decline slops are usually gradual as well as increasing slopes. But the change from increase to plateau or increase to decline is seldom, if ever gradual. USA+Saudi+Russia has already plateaued. Their decline is very likely to be sudden, well, it has actually already happened.
However, in the two charts below, I have used your method of stopping the chart just before the Covid induced decline. The charts speak for themselves.
The second chart. The rest of the world is in serious decline.
Ron,
The serious decline is mostly due to OPEC cuts since late 2018. If we consider World C plus C output minus OPEC plus US plus Russian C plus C output, the serious decline becomes an average of 61 kbo/d annual decline in C plus C output for the trend over the Jan 2013 to Dec 2020 period. Not really a big deal.
OPEC as a group is likely to be able to increase output significantly from December 2020 levels imho. The World can easily return to its previous 12 month peak of 83 Mbo/d, only higher oil prices are needed which we will likely see within the next 12 months or so.
Dennis, many OPEC nations are in serious decline. See my chart above of OPEC, less Saudi, UAE, Kuwait. and Iraq. Of course, if you show a chart that leaves out all the nations that are in serious decline you will get a chart that shows an increase…Woah…No Increase… Even then you still get a slight decline.
Well damn, how about that?
Ron,
Most of the serious decline in Iran, Venezuela, and Libya that has occurred is due to sanctions/civil war/inept government.
The sharp decline from these three nations from 6771 kb/d in 2018 to 3600 kb/d in 2020 (12 month averages) has little to do with geology and depletion and is primarily political. In fact if the December 2020 output level is maintained over the next 12 months (a conservative estimate, we are more likely to see an increase in output) we will see average 12 month output increase to 4500 kb/d for Iran, Libya, and Venezuela.
Yes there is a small decrease from the OPEC small producers and it is not a big deal. If we take OPEC as a whole output (centered 12 month average) was relatively stable from the middle of 2016 to the middle of 2018, in October 2018 oil prices crashed due to oversupply of oil and OPEC output declined as OPEC began to cut back on output to support oil prices near the beginning of 2019, then there was a temporary pause due to the Saudi/Russia supply fight (late 2019/early 2020) then pandemic related decline.
Very little of this is geology related, it is cartel politics and OPEC acting as the World swing producer (with some help from Russia).
We will know if the decline is “serious” when Brent oil prices have risen to $75/bo or higher for 6 months or longer, my estimate is that such a price increase will be followed by a “serious” increase in OPEC output.
Hi Ron,
From Jan 2018 to November 2019 about 96% of the decrease in the centered 12 month average C plus C output for OPEC was due to the decrease in the centered 12 month average C plus C output from 3 nations, Iran, Libya, and Venezuela. It is doubtful those nations as a group will continue to decline, more likely there will be an increase in output for Libya and Iran, Venezuela is in talks with some companies to increase output, though I doubt Venezuela will see much increase in the short term (next 3 to 5 years).
Chart below has centered 12 month average output of C plus C in kb/d, note that OPEC is read from left axis and the 3 nations from the right axis. Also note that for both axes the scale from minimum to maximum is the same (7000 kb/d from low to high).
click on chart for larger view.
Hi Ron,
Perhaps you shod rethink your doomer scenarios. My scenarios in the past have consistently underestimated future output.
For most of your past predictions of the future the reverse haz been true.
Perhaps this time will be different, I remIn skeptical.
Perhaps you shod rethink your doomer scenarios. My scenarios in the past have consistently underestimated future output.
For most of your past predictions of the future the reverse haz been true.
Perhaps this time will be different, I remIn skeptical.
Dennis, did you really write this shit? This just does not sound like you. What the hell is going on? Or, perhaps you are just drunk? Don’t feel bad, that happens to me sometimes.
Dennis, Libya has already returned to pre-collapse levels. They are now producing flat out as they are exempt from any quotas. They will see no further increase. You are wildly optimistic about Venezuela returning to pre-collapse levels in 3 to 5 years. If, big if, they ever reach some kind of political stability, it will take at least a decade for China to rebuild their infrastructure. I say China because only China will dare take the job because Venezuela has nationalized every other oil company to dare invest in Venezuela, paying them pennies on the dollar.
Yes, Iran can restore production, likely in a year or less. But that will not be nearly enough to make up for the decline in the rest of OPEC.
Ron,
Libya has been in chaos for about 10 years, and it’s unlikely that there’s been any kind of systematic investment in new or infill production, or even proper maintenance. Even before that, I’d be surprised if investment was optimized: Ghaddafi was obviously an unusually autocratic ruler, with absolutely no plan for succession or governance with broad participation.
It seems unrealistic to write it off.
Nick, I was never writing Libya off. All I said was that they were producing flat out. They are producing 1.2 million barrels per day. If they ever achieve political stability, (in years to come), and then invest in more oil infrastructure, then they could possibly increase that to 1.4 or even 1.5 million barrels per day. But that would be years in the future. In the meantime, if they continue to produce at 1.2 million barrels per day, their depletion will continue.
At any rate, any increase that they might achieve will make little difference. You are talking crumbs here when what you need is a complete cake. You will not find that in Libya or with any other OPEC nation.
Ron,
I agree Venezuela is unlikely to come back in less than a decade, a 5 year period was for there to be some increase and is likely optimistic. It is also doubtful that Venezuela will decline to much less than current output, but even if it did, it is not producing much only 430 kb/d for Dec 2020, so even if it went to zero, it is not going to lead to a serious decline in overall OPEC output going forward.
With sanctions relief Iran could increase output quickly by 1350 kb/d. OPEC as a group could quickly (within 3 months) increase output by 4450 kb/d from the Dec 2020 level of 27238 kb/d as demand and oil prices increase. Also Russia can likely increase output by 1240 kb/d and the US by 1300 kb/d. Combined OPEC, US, Russia increases add up to 6990 (US output will take a couple of years to ramp back up so perhaps by 2023 or 2024). From the December 2020 World C plus C level of 75936 kb/d the 6990 kb/d increase gets output to 82926 kb/d, this ignores potential increases from Brazil, Canada, and Norway and future potential increases from OPEC and US. It is for these reasons I expect the World peak at about 85 to 86 Mb/d in 2030-2035.
Really Dennis? The odds of all these things happening is slim to none. And Slim just left town. 😉
Ron,
We will talk in 12 months and see, much will depend on the price of oil and economic recovery as more of the World gets vaccinated. My guess is there is a lot of pent up demand and as the pandemic subsides the economic recovery might be rapid and demand for oil would recover rapidly in that case, that leads to oil prices north of $75/bo before October 2021 as the most likely scenario.
The increases I have suggested are conservative for that oil price level.
In short, yes I really think we will see 83 Mbo/d for World C plus C output by 2028 at the latest. A more realistic scenario has World C plus C reaching 83 Mb/d by 2025.
Dennis, my point was, all these things have to fall into place at the same time. Russia, Saudi Arabia, the USA, Norway, Brazil, Canada…. All of them. The odds of that happening is minuscule. No Dennis, that is just not going to happen.
You fail to realize just how much of the world is now in serious decline. Western Siberia is a perfect example. They are not just in decline, they are in very serious decline. Ditto for Ghawar and much of the rest of Saudi Arabia.
That is the one thing all your charts, all your scenarios, fail to take into consideration. You need to seriously rethink your cornucopian scenario.
Interesting chart Dennis.
Do you know what percent of total production is attributable tot he 12 nation group?
Hickory,
Thanks.
For most recent 12 months (2020) 69% of World C plus C was produced by the “12 nation group”.
The “12 nation” list is:
Brazil
Canada
Iran
Iraq
Kuwait
Libya
Norway
Russia
Saudi Arabia
United Arab Emirates
United States
Venezuela
Thanks Dennis.
It is easy for us to discount the production capacity of Iran, however this could be a mistake.
If China needs oil it will fund production in Iran, regardless of the ‘worlds’ concern over Iranian nuclear and regional ambitions [very aggressive ambitions that are largely theocratically driven].
This weekend-
‘Iran, China sign strategic long-term [25 yr] cooperation agreement
The agreement covers a variety of economic activity from oil and mining to promoting industrial activity in Iran, as well as transportation and agricultural collaboration.’
https://www.politico.com/news/2021/03/27/iran-china-agreement-478236
I’d be willing to bet that China’s investment in Iran will be made in US dollars. And that China will regret letting those US dollars go before long. There is another global US dollar shortage looming large over markets right now.
HHH —
The NY Times claimed Beijing plans to direct some $400 billion [nominal] into Iranian infrastructure in exchange for oil as a key part of the deal. No indication that actual U.S. dollars will be involved. Further, with the RMB now in the IMF currency basket, it seems Chinese currency is being used more frequently for cross-border trade, at least in Asia. Not that I know anything about cross-border trade. 😉
HHH, Renambi will be used wherever possible and will form the major part of investment . USD will be used where not so. The Chinese are well aware of the looming dollar shortage and that is why they have not offloaded their treasury bonds . The Chinese play GO , the world plays checkers .
Soon, it will be the digital yuan
“GUANGZHOU, China — China is arguably leading the world in developing a national digital currency, a project it has been working on since 2014.
The People’s Bank of China (PBOC) has been spearheading work on the digital yuan, a so-called central bank digital currency (CBDC) that aims to replace some of the cash in circulation.”
https://www.cnbc.com/2021/03/05/chinas-digital-yuan-what-is-it-and-how-does-it-work.html
@Hickory. The possibility of a major solar storm and coronal mass ejection on sun provoking a geomagnetic storm enough to disrupt all things electrical and electronic on Earth is not so low. This nearly did occur in 2012 : a massive coronal mass ejection did miss Earth with a margin of nine days. According to astrophysicists, this CME was comparable to that which caused the Carrington event in 1859, during which polar aurorae were seen in Venezuela. Therefore, digitizing the currency to replace the cash in circulation is highly unwise. Furthermore, this is the result of a society using limitless energy. Yet, there are physical limitations of the available energy. When Chinese will have to put up with restrictions on the availability of oil and coal, I am not sure that the energy spending associated with the digital currency will be a priority.
Dennis , analyzing your list of 12 . My comment is ;
USA : Maxed out . Shale is over . Will never touch 13mbpd even if price goes to $ 100 .
Canada : Little leeway . Upper limit + 300000 mbpd . ESG ,pipeline and price constraint .
Brazil : Max + 100000 bpd . Geological and logistical constraints being offshore and salt basin .
Norway : Not much . Most of the new production will cover the current decline .
Russia : Self confessed they don’t have anything to add .
KSA : Indirectly self confessed when they announced a 1mbpd cut in domestic consumption to free it for exports .
UAE ,Kuwait, Iraq : All past peak and decline .
Iran : Iranians are champion sanction busters . They sell everything they produce . Sometimes shipping (smuggling) via Turkey , Iraq or shipping blatantly in the open to countries where the US, cannot intervene like China, Venezuela .
Libya and Venezuela have been nicely summed up by Ron .
He is correct when he says ” these are crumbs when what we need is a whole cake ” . I had earlier given an analogy of the “cash on the sidelines ” myth in Wall Street to ” spare capacity on the sidelines ” in the oil industry .No CAPEX since 2014 means nothing new in the pipeline . Last but not least the decline rate is 7.5 % and this is a force that is relentless .
Hole in head,
You are wrong about US tight oil, the US is likely to return to at least the previous peak. Likewise, Saudi Arabia, UAE, Kuwait, Iran, and Iraq are all likely to return to the 2018 12 month average output. Russia is also likely to return to its 2018 12 month average level, Canada and Brazil will increase output and Iraq may be able to increase output above the 2018 level. My guess is that Saudi Arabia, Kuwait, and UAE might also be able to increase output above the 2018 level.
We will find out when we see Brent oil prices sustained at $80/bo (2020 US$) or higher for 12 months or more.
See link below for my best guess based on USGS estimates for World conventional C plus C URR (3100 Gb) and a very conservative estimate for World unconventional C C URR (300 Gb for tight oil and extra heavy oil combined).
http://peakoilbarrel.com/december-non-opec-oil-output-continues-rebound-from-may-low/#comment-715611
Also if we exclude the “12 nation group” (Brazil, Canada, Norway, Russia, US, Saudi Arabia, UAE, Kuwait, Iraq, Iran, Libya, and Venezuela) from World C plus C output from Jan 2010 to Dec 2019, the annual decline rate is about 1.74% per year. For the most recent period (where we did not see oil prices cut in half as was true from 2014 to 2016) from Jan 2017 to Dec 2019 the annual decline rate for World minus 12 nation group was only 0.88% per year. The 7.5% annual decline rate you cite is for smaller fields where no new investment is undertaken (no new wells drilled), the so-called “natural” decline rate.
Note that this would only be “natural” in a failed state or perhaps after a nuclear holocaust (at the World level).
Dennis , your post is using the words ” likely ” and ” guess” too leniently . I have backed all my calculations based on good info .However your main condition for this to occur is ” We will find out when we see Brent oil prices sustained at $80/bo (2020 US$) or higher for 12 months or more.”
Of course everything is possible ( we did have – $ 37 barrel) but what is the probability of getting this benchmark . My guess would be close to zero . Further the 7.5% decline was calculated on the current worldwide TOTAL production based in 2019 and 2020 in the last thread. CAPEX on existing wells and infrastructure continued in 2019 ,2020 for maintaince and will continue in 2021 also but that is just to keep the current output flowing . Nothing to bring new oil online . It takes 8-10 years to bring oil to the gas tank from the date of FID and that has hit a wall since 2014 when the price fell down drastically .
hole in head,
World output declined in 2020 due to lack of demand, much of this was cut backs in output by OPEC, US, Russia, Canada, and Brazil, most of this output can be brought back online with little further investment. As to 8 to 10 years, that applies to deep water offshore and Arctic projects, for tight oil, it will take 12 to 24 months for production to ramp up.
If your prediction of $25/bo for WTI proves correct, your scenario for the future will also be correct, my guess is we won’t see a 12 month average price for WTI of $25/b prior to 2060.
We will simply continue to disagree about the future. I have laid out my expectation for the future. Here is an alternative which is the minimum that I believe is feasible based on USGS estimates of World conventional oil resources. Not the very low extraction rate after 2019, the lowest that the World extraction rate has ever been to date (1871-2020). URR is 3300 Gb (the legend is mislabeled.)
click on chart for larger view.
I said:
“Not the very low extraction rate after 2019…”
This should have been,
“Note the very low extraction rate after 2019…”
Short interest in US stock is at all time lows. Hardly anybody is short. Means there are hardly any shorts to squeeze out to ramp valuations higher. My guess is there will be one last ramp higher on the release of US infrastructure bill. Which Biden will release I think it is Wed of this coming week.
Short interest in the dollar is near all time highs. Hardly anybody is long. These shorts will start to be squeezed out soon sending dollar much higher as shorts cover.
Oil price might get one last surge off this infrastructure bill but it will be short lived if it comes at all.
With margin debt set to shrink starting April 1st. There won’t be a continued ramp of prices. There will be a contraction of prices. Might take a month for this contraction to start showing itself in prices as banks tighten down on margin debt.
Suez canal shutdown . Nightmare .
https://www.youtube.com/watch?v=zBvFuq7Mkzs&t=215s
What a salvage expert has to say .
https://www.youtube.com/watch?v=Ws3BtZ7mma8&t=339s
Cost is $ 9.8 billion per day .
https://www.statista.com/chart/18109/seaborne-oil-transiting-possible-chokepoints/
10 million barrels are backed up .
Good news . The vessel is now freed .
>> New Mexico regulators finalized rules to nearly eliminate routine natural gas flaring, making it the second state in the US to ban the practice. <<
OK, so if it's not flared, what happens to it? Is it stored? Or just released into the atmosphere? (which would be worse than burning it?)
John,
It is likely the gas is not vented (which is worse than flaring), they either collect the gas and send it to processing plants or perhaps the wells get shut in.
JOHN —
“OK, so if it’s not flared, what happens to it?”
Re-injection of gas into wells to enhance recovery of oil is the normal (preferred) procedure. Alternately, small-scale solutions for utilization include mini gas to liquids plants, small-scale liquefaction plants and compressed natural gas plants.
Why US shale oil production will not show a recovery this year. This article was published yesterday, March 29th.
Exxon, Chevron take a slow walk on the path to U.S. shale recovery…Bold mine
(Reuters) – Exxon Mobil and Chevron Corp have scaled back activity dramatically in the top U.S. shale oil field, where just a year ago the two companies were dominating in the high-desert landscape.
The cautious approach of the two largest U.S. oil companies is a major reason domestic oil production has been slow to rebound since prices crashed during pandemic lockdowns in 2020. Production now is about 11 million barrels per day (bpd), down sharply from the record of nearly 13 million bpd hit in late 2019.
The share of drilling activity by Exxon and Chevron in the Permian Basin oil field in Texas and New Mexico dropped to less than 5% this month from 28% last spring, according to data from Rystad Energy.
“We essentially hit a pause button,” said Chevron Chief Financial Officer Pierre Breber. “When the world was oversupplied we didn’t see the virtue in putting more capital to add barrels.” (Graphic: Exxon and Chevron slash Permian drilling, here)
Neither company is likely to boost spending until next year, according to the companies and analysts. Chevron expects to produce around 1 million barrels daily by 2025 and Exxon 700,000 bpd by 2025, the companies said at investor days this month.
Chevron will increase Permian spending from $2 billion now to pre-Covid levels of $4 billion annually “over the course of the next several years,” Breber said, but the company will not increase drilling in the Permian this year. It is currently running about five rigs in the Permian with two completion crews, down from just under 20 a year ago.
SNIP
However, output is unlikely to increase dramatically, due to the swift decline rates for shale wells.
“We would need three months of oil prices sustained at current levels followed by six months of drilling activity before production begins to climb higher on a sustained basis,” said Peter McNally at Third Bridge.
Exxon and Chevron are not the only producers keeping spending down. Many shale companies have hedged a majority of expected 2021 oil production at an average price below $45 a barrel, well below current market prices, Enverus’ Andy McConn said. The hedges reduce exposure to the recent increase in oil prices, discouraging near-term growth. (Graphic: Permian oil production stalls, )
It looks like they hope to return to normal production by 2025.
My conservative model for US tight oil based on Brent oil prices rising to no more than $62.50/bo (in 2019 US$). Annual average output for each year shown.
Trying to make heads or tails of your chart. It appears that the red dot is the center of the year, representing, I guess, the average for that year. Or, is that from the center of the year to the center of the next year???
The red dot, fourth from the left. Exactly when does that V-shaped decline and when does that recovery start. Is that June-July of 2021? Could you explain that?
Ron , the 4th dot is June/July 2021 and the 5th dot is June/July 2022 . That is what I read . Of course not going to happen .
Hole in head,
So tell us what is going to happen. 🙂
Ron the dots are annual average output centered on the middle of the year (2018.5, 2019.5, etc).
In 2021 output of tight oil reaches its low point, then it starts to increase as rig counts, frac spreads, and tight oil well completions increase.
Longer term chart below. Change in units from kb/d to Mb/d.
So tell us what is going to happen. ?
Well, Dennis ,Ovi already knows about it so he started a new thread with the appropriate tagline . For a change I will tell what will not happen . 🙂
What % of this Permian LTO is exported? Perhaps there is limited demand since the light stuff is not as fungable?
LT, pay a visit to Mike Shellman’s blog . He has just posted an excellent article on exactly what you are looking for . Usually I link his posts but some here on POB have heaped uncalled insults ,so he has forbidden me from doing it . Hope this will help .
I have no idea. And I am not sure they get the WTI price for the light stuff.
longtimber,
Depends on what refineries do, they could make upgrades to process it or it can be exported, I am not concerned about exports and imports, I am a free market guy, see
https://en.wikipedia.org/wiki/Comparative_advantage
This is the basis for free and fair international trade, everyone is better off.
If we are worried about exports to China, we can restrict exports of oil to China.
No reason we cannot export oil to our allies, as we have done in the past (WW2 for example).
In 2019 about 2982 kbo/d of crude oil was exported by the US of about 7757 kb/d of tight oil produced, so if we assume all exports are tight oil exports, this suggests 7757-2982=4775 kbo/d of tight oil can be handled by US refineries. At the peak for my model tight oil output is 9119 kbo/d, assuming the refinery capacity for tight oil does not change from the 2019 average level, then 4344 of 9119 kb/d of tight oil would be exported or 47.6%.
Refineries have had 14 years to make “upgrades” to better process US shale oil; they haven’t for a reason. To “assume” they will in the future, with shale oil productivity declining, over-drilled sweet spots getting gassier, shale debt increasing and shale economics getting worse, under the most anti-oil presidential administration in American history, is ridiculous. Texas is overbuilt now on shale oil gathering infrastructure by a factor of 2. Also on borrowed capital.
There is nothing “free” about free trade. Ask OPEC. They’ve manipulated world oil markets for the past decade, at its great expense, only to watch the US flood that market with LTO, extracted on borrowed money from the great American printing machine. Truthfully, the economies of oil producing nations throughout the world have been decimated by American shale oil over-production. Investment in the worlds remaining recoverable conventional oil has been destroyed because of LTO oversupply and price volatility. Better off? Phffffttttt. In five more years we’ll be back to begging OPEC for help; we’ll see how “free” that trade will be.
In the 30’s and 40’s America was making vast discoveries from big, fat juicy sediments in producing basins all across the country; the giant East Texas Field, for example. Everybody made money then, even at $3. We ramped up to fuel a worldwide war effort, one in which the US participated in. We had oil to spare. It was cheap to get to. Domestic demand for crude oil in our country was half what it is now.
Now oil is not cheap to extract. Any 5th grader can see that. Now we’re down to wringing oil out of tight source beds in producing basins and those resources come out of the ground in 400K BO increments that cost $8MM per unit. The shale oil phenomena has NEVER made money doing that.
The most obvious reason to be opposed to exporting American shale oil then is because we don’t have it to spare. We’re going to need it in the future. All of it, in spite of the renewable dung heap. Exporting shale oil, BELOW ITS COSTS, is stupid. I can’t even fathom anybody thinking otherwise. I suppose its like having a “savings account,” which 70% of Americans don’t have either.
As to massive debt, flaring, the loss of groundwater in arid W. Texas, long term job security, etc., those are all ancillary downsides to exporting oil below costs that will have a negative affect on our country and our children’s future. Those are matters that require deep thought and compassion, something few Americans are capable of anymore, particularly NIMBY believers from both coasts, out of touch with Middle America and reality. You know, some like the immigration crisis in Texas along the river… out of sight, out of feeble mind.
Mike,
I agree US refineries will probably not do anything. I suggested that upgrades are a possibility, especially if exports are not allowed. If no change in refineries occurs and my model peak proves correct, then 46% of tight oil would be exported. The problem in the future is likely to be an oversupply of oil.
Generally it seems Texans would prefer to decide what is best for themselves rather than the government.
Permian basin producers can make money at present average well productivity and OPEX and CAPEX costs in a scenario where oil prices rise to $70/bo by December 2021 and rise gradually to $75/bo by Dec 2026 and then remain at that level until 2040 followed by lower oil prices. I assume in this model that average Permian new well EUR falls to 326 kbo by July 2040 from 420 kbo in Dec 2019. I assume average new well productivity starts to decrease in Jan 2020. Discounted (discount rate of 10% per year) cumulative net revenue (with interest rate assumed at 7.5% per year) on left axis in chart below, output on right axis. Completion rate based on cash flow, no further debt needed, debt paid back by Jan 2024.
The biggest risk to oil production potential over the next decade is human disruption. The chance that the major producers all continue at the ‘economically efficient’ production levels is less than 50% I’d guess.
There are so many scenarios of human disruption possible.
Everyone is producing flat out .
https://oilprice.com/Latest-Energy-News/World-News/OPEC-Excess-Oil-Production-Rises-To-3-Million-Bpd.html
hole in head,
Excess production is supply that is more than demand for OPEC. The article says nothing about everyone producing flat out, in fact KSA plans on continuing its cut of 1 Mb/d below its quota in May and June.
Biden’s plan will end tax preferences for fossil fuel companies. I am not sure if there are more specifics than that.
However, if expensing intangible drilling costs is eliminated, the shale boom will officially be dead.
As percentage depletion applies only to the first 1,000 BOEPD per company, elimination of that would primarily hurt marginal wells.
Also, Biden has proposed $16 billion to plug abandoned wells and reclaim abandoned mines.
Of course, at this point, the infrastructure bill is not entirely specific. There will be a lot of negotiation in Congress.
To me, it would seem short to medium term positive for oil prices. Shale companies will finally have to pay income taxes, and assuming the corporate rate goes to 28%, I don’t see how there would be another drilling boom in shale, absent a super spike in oil and/or natural gas prices.
Further, the bill would cause a spike in US oil demand. Lots of heavy equipment and materials that will consume petroleum, even that needed for more clean energy.
Future will be more clear once the plan is signed into law.
I would note grain spiked on the USDA estimates for corn and soybean acres. This could affect oil prices short term.
Shallow sand,
Doubtful changes would be made that hurt the oil industry significantly, it will not make it through the Senate, seems unfair to change the rules of the game in the middle of the game, perhaps changes in rules would be phased in gradually (if at all).
No doubt Biden expects significant negotiation on the bill. Should the Republicans make a good faith effort, compromise might be reached. Unfortunately the adults have mostly left the Senate and that makes compromise nearly impossible, we have been left with a government that no longer functions.
A new thread US January Oil Production has been posted.
http://peakoilbarrel.com/us-january-oil-production-continues-slow-slide/
A new Open thread Non Petroleum has been posted.
http://peakoilbarrel.com/open-thread-non-petroleum-april-1-2021/