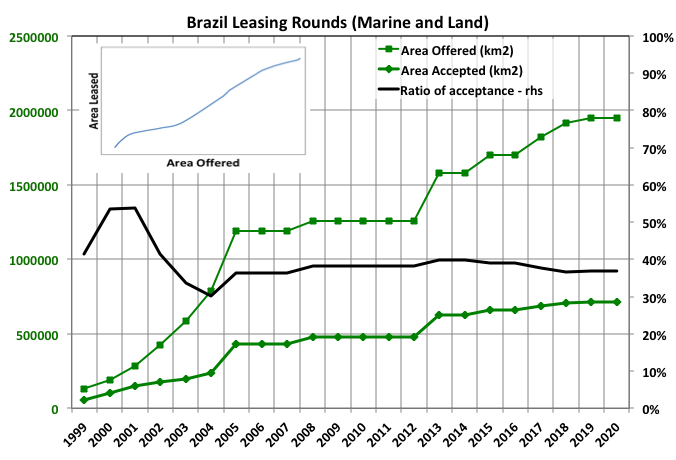
The creaming curve for lease sales in Brazil looks like it is turning towards the asymptote overall. Unfortunately there is insufficient data provided to allow land and marine leasing to be separated but I expect that the curve for land is close to the limit but that for marine areas is barely half way. The average take up of offers has remained high, which suggests APB, the Brazilian authority in charge, is discerning about what it offers.
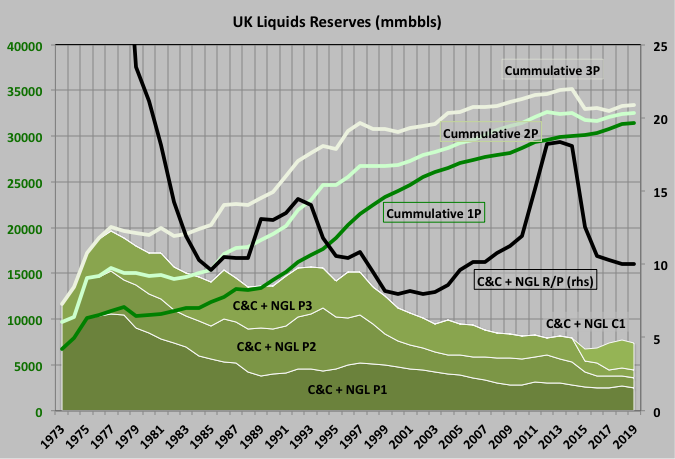
The OGA issues UK oil and gas reserve values each year, but only in total, not for individual fields as is done in Norway, Mexico, GoM and Brazil (which reports by basin rather than field). The reserves are not backdated to discovery date so it’s not possible to generate anything like a true creaming curve, but they are split into categories of proved, probable and possible, and, since 2015, contingencies. Operators in the UK North Sea have up to five years to announce estimated resources in discoveries so there may be uncertainties for recent years, unlike in the Norwegian section where estimate must be declared as soon as they are known.
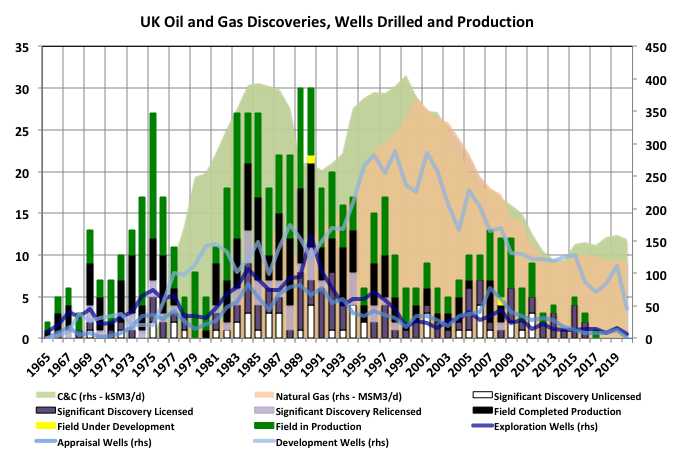
The global peak in oil and gas production for UK occurred in 1999 and 2000, probably delayed by four or five years by the Piper Alpha tragedy, and will not be approached, far less exceeded, again. There have been two other local peaks, each one preceded by about ten to twelve years by a local peak in the number of discoveries. The UK Oil and Gas Authority does not publish individual field resources, but it’s a fair bet that the large fields were discovered early on and most of the recent discoveries are small, near field tie-ins.
This analysis concerns C&C only. Natural gas production is low and steadily declining with few deep gas-condensate discoveries and the shallow dry gas fields at end of life. I don’t know if lack of gas may affect oil production – e.g. insufficient: flow to allow stable pipeline operation; income to be economic to warrant continuing maintenance; or fuel gas or lift gas supply to surface facilities. Any such issues could influence shutdown timing and hence the possible stranding of assets.
Top Down Production Projections
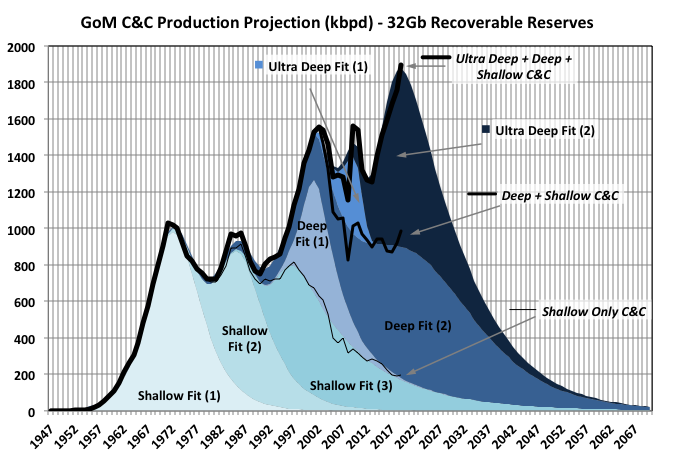
The chart above shows a Verhulst fit to GoM C&C production using seven curves, three describing shallow production and two each for deep and ultra-deep. A symmetric logistic curve is convenient for manual curve fitting as it allows a linear extrapolation to give the ultimate recovery, but most production curves are not symmetrical – usually the decline is less concave with a thicker tail, especially as the production volume and number of independent producing entities are reduced. With Excel, using least-squares optimisation fitting to any curve(s) is simple and has the benefit of allowing additional constraints to be imposed for sensitivity checks (e.g. total area, equivalent to the ultimate recovery, and position or height of peak), so more general Verhulst curves allow closer fitting.
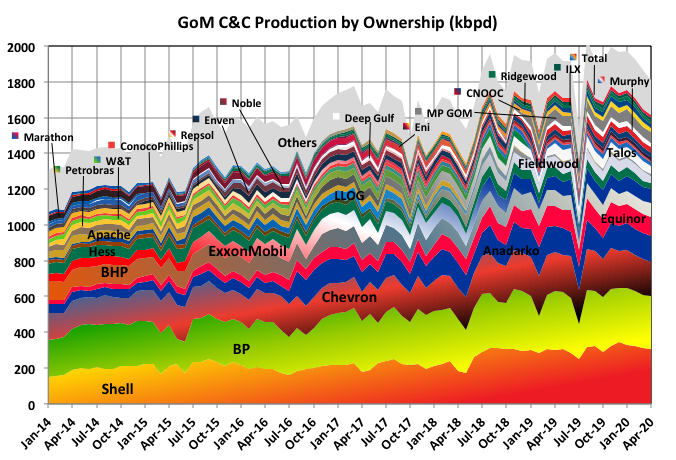
Production is dominated by major international companies particularly, and maybe surprisingly, European ones. Principally Shell and BP, but with Equinor, Eni, Total and Repsol also active and many are (or were) seemingly wanting to expand in the area. Maybe this is an example of reciprocal technology transfer: the North Sea was initially developed with a lot of American offshore know how and there it may now be the reverse is happening as deeper water fields using floating and subsea systems are developed.