EIA Quarterly Crude + Condensate Production Data

The EIA publishes all kinds of energy production data but I collect and chart only Crude + Condensate data. But that comes in three flavors, monthly, quarterly and yearly. I decided to chart the quarterly data and see if that looks any clearer than the monthly data.

Quarterly C+C production in kb/d. The last quarter, 3rd, ends September 2013.

World

World C+C production has increased 2 million barrels per day since the 2nd quarter of 05. Who were the big gainers that caused this 2 million barrel per day increase?

World Less USA

Turns out it was all USA.
Read More

US Crude Storage, Production and Other Peak Oil News

There has been a dearth of oil production data lately so I have been scratching to find something to post. So I have gathered this and that in hopes of making it interesting.

US stocks had the first uptick in nine weeks, gaining 990 kb. (See the slight uptick in the blue line.) But they still stand at their lowest point in 21 months.

Stocks

Incidentally the EIA’s Weekly Petroleum Status Report had US crude oil production down last week. Their estimate of production went from 8,159 kb/d to 8,052 kb/d. That was the first decline in nine weeks. Of course that is really just a guess by the EIA.

Based on the weekly US production data I have charted US production through Januay 2014. The data through November 2013 is from the EIA’s Monthly Energy Review. The data for December and January is from the Weekly Petroleum Status Report, link above. That data is through January 17th. I have estimated the rest of the month.

Read More

Update: OPEC January MOMR with December Production Data

The OPEC January Monthly Oil Market Report is out with crude only production data through December 2012. Total OPEC crude only was 29,223,000 barrels per day, down 20,000 barrels per day. But that was after November production was revised down by 170,000 bp/d. So December production was down 190,000 bp/d from what they originally reported last month.

OPEC 12


Big movers were Iraq and Libya. Iraqi November production was revised down by 132,000 bp/d and their December production was down another 55,000 bp/d meaning they were down 187,000 from what was originally reported last month.

Iraq

Read More

Update: North Dakota Bakken Data

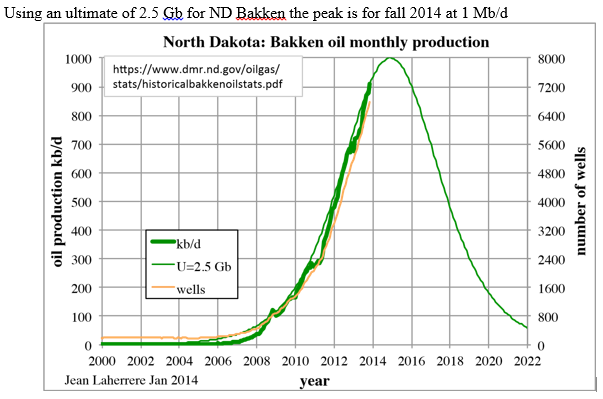
North Dakota published their monthly report on Bakken Production and All North Dakota Prouction. Nothing to get excited about. Bakken production was up 28,285 barrels per day while all north Dakota was up 27,864 barrels per day. This means that North Dakota production outside the Bakken was down 421 bp/d.

The Director’s Cut comments on the price they are getting for Bakken Oil:

Oct Sweet Crude Price = $85.16/barrel
Nov Sweet Crude Price = $71.42/barrel
Dec Sweet Crude Price = $73.47/barrel
Today Sweet Crude Price = $71.25/barrel (all-time high was $136.29 7/3/2008)

Interesting that they are selling their oil at about a $21 discount to WTI about a $35 discount to Brent. More of the Director’s comments:

The drilling rig count was unchanged from Oct to Nov, but the number of well
completions dropped from 166 to 138. Days from spud to initial production remained
steady at 114. Investors remain concerned about the uncertainty surrounding federal
policies on taxation and hydraulic fracturing regulation. 

We estimate that at the end of Nov there were about 510 wells waiting on completion
services, an increase of 50.

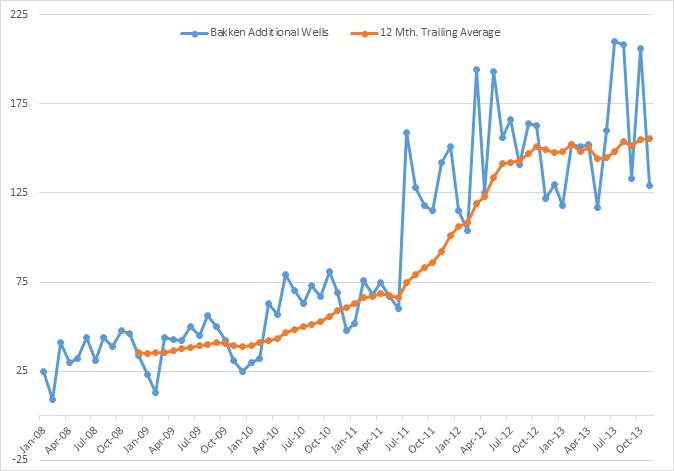
This plot is “Bakken Additional Wells” and the 12 month trailing average. As you can see the average for the last 15 months or so has been pretty flat, around 150 additional wells per month.

Bakken Additional Wells


Read More