By Ovi
All of the Crude plus Condensate (C + C) production data, oil, for the US state charts comes from the EIAʼs Petroleum Supply monthly PSM which provides updated information up to June 2024.
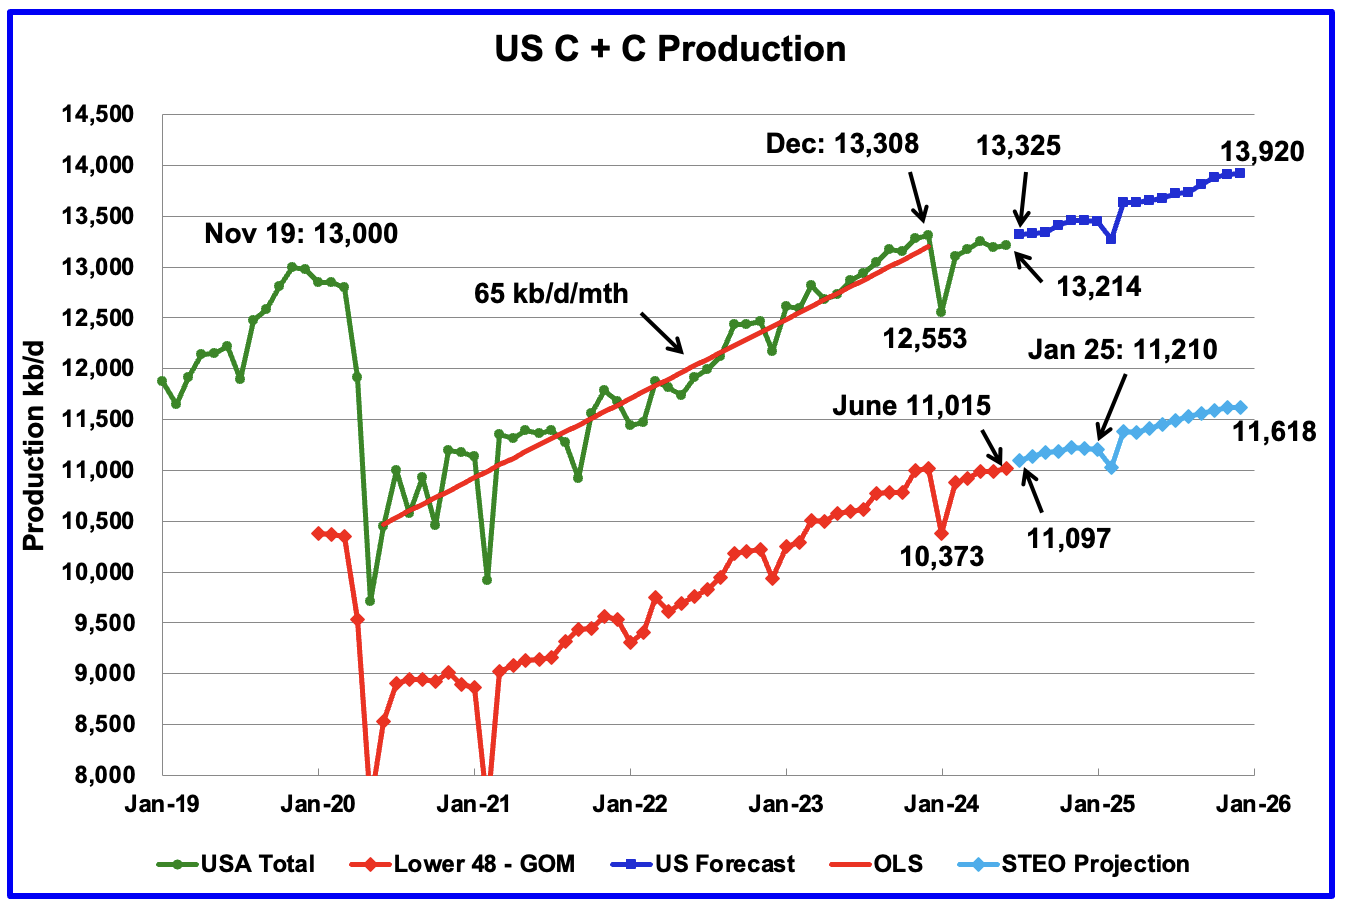
U.S. June oil production rose by 25 kb/d to 13,214 kb/d. The largest increase came from Texas, 58 kb/d while 7 states had production drops totalling 51 kb/d.
US oil production has been flat since November 2023 when it was 13,281 kb/d.
The dark blue graph, taken from the August 2023 STEO, is the forecast for U.S. oil production from July 2024 to December 2025. Output for December 2025 is expected to reach 13,920 kb/d which is a decrease of 89 kb/d from the previous STEO report.
From July 2024 to December 2025 production is expected to grow by 595 kb/d or at an average rate of 35 kb/d/mth.
The red OLS line from June 2020 to December 2023 indicates a monthly production growth rate of 65 kb/d/mth or 780 kb/d/yr. Production going forward is projected to increase at about 1/2 that rate.
The light blue graph is the STEO’s projection for output to December 2025 for the Onshore L48. From July 2024 to December 2025, production is expected to increase by 521 kb/d to 11,618 kb/d which is 108 kb/d kb/d lower than reported in the previous STEO.
US Oil Production Ranked by State
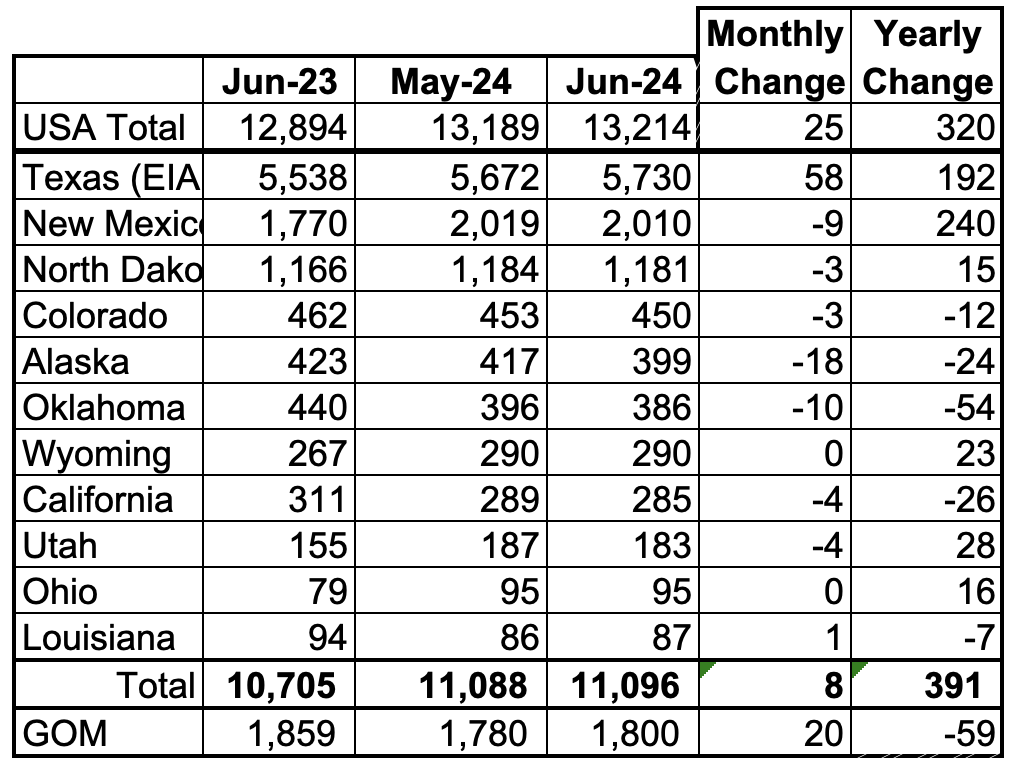
Listed above are the 11 US states with the largest oil production along with the Gulf of Mexico. Ohio has been added to this table since its production approached 100 kb/d in January and exceeded Louisiana’s production. These 11 states accounted for 84% of all U.S. oil production out of a total production of 13,214 kb/d in June 2024.
On a YoY basis, US production increased by 320 kb/d. GOM production decreased by 20 kb/d MoM while YoY it dropped by 59 kb/d.
State Oil Production Charts
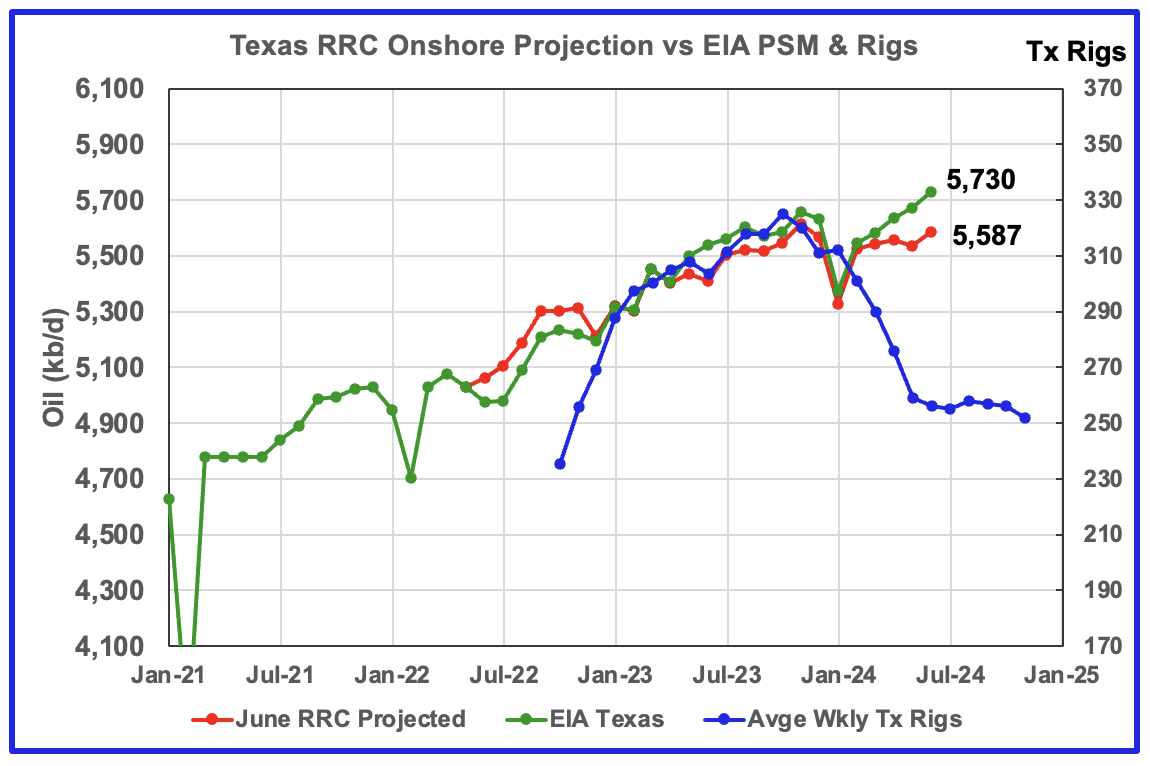
Texas production increased by 58 kb/d in May to 5,730 kb/d. YoY production is up by 192kb/d.
The red graph is a production projection for Texas using the Texas RRC reported May and June oil production. The projection uses the cumulative difference between the May and June preliminary production data provided by the Texas RRC. The projection does not provide a reasonable estimate for Texas’ June production vs the EIA’s official 5,730 kb/d.
In checking oil production from Texas counties, it was found that a number of them had a significant production drop in May, which could be due to either a delay in reporting or a processing delay by the Texas RRC. The late/low reporting of May causes the June upswing to 5,587 kb/d. It is not clear and surprising why the production projection after January 2024 is showing an ever widening gap with the EIA, considering the close results for February and the prior months.
The blue line is the average numbers of weekly rigs reported for each month, shifted forward by 9 months. So the 276 rigs operating in July 2023 have been shifted forward to April 2024. So if production should follow the rig count, Texas production should begin to decline shortly.
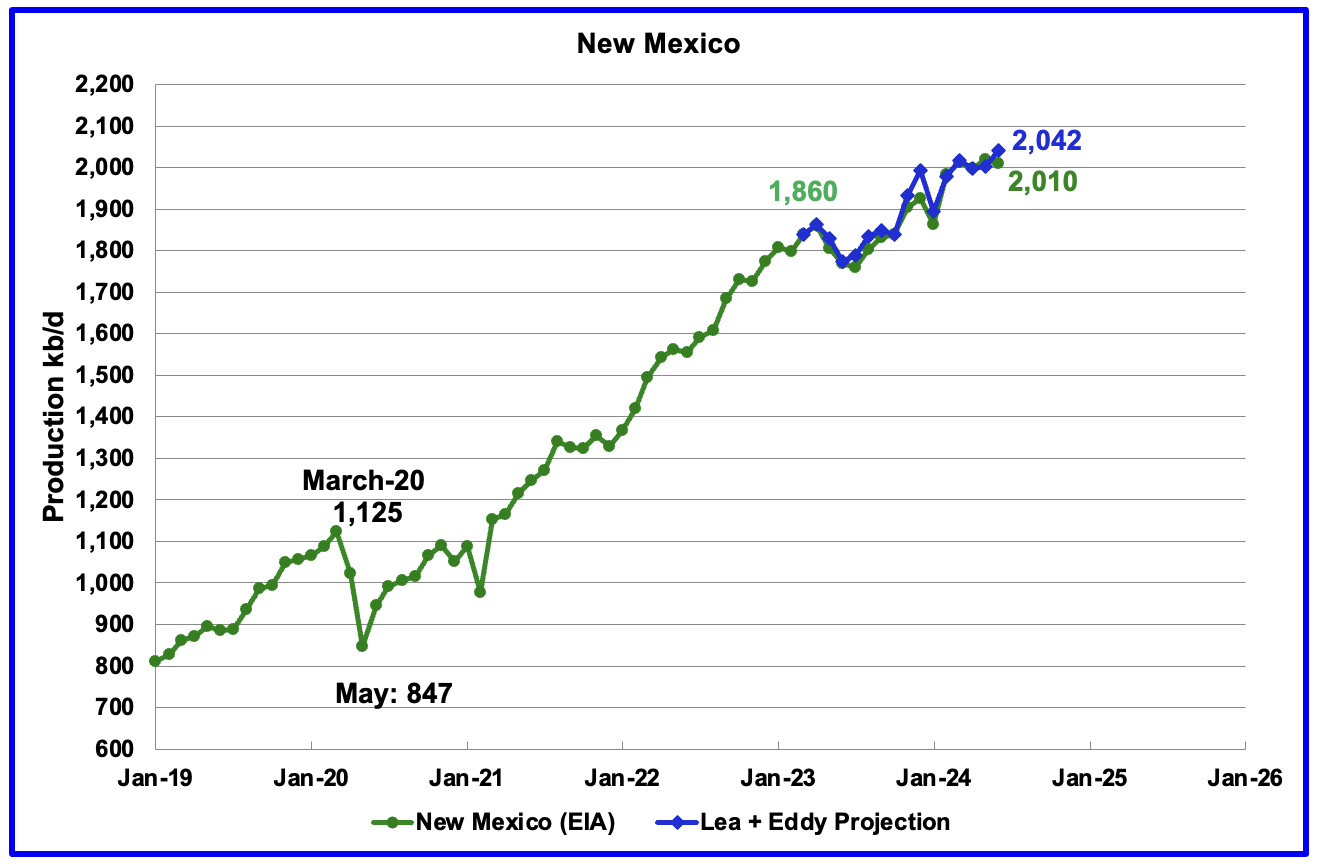
According to the EIA, New Mexico’s June production dropped by 9 kb/d to 2,010 kb/d.
The blue graph is a production projection for Lea plus Eddy counties. These two counties account for close to 99% of New Mexico’s oil production. The projection used the difference between the May and June preliminary production data provided by the New Mexico Oil Conservation Division. The projection provides a reasonable estimate for New Mexico’s January to June production. A 1% correction was added to the Lea plus Eddy projection to account for their fraction of New Mexico’s oil production.
Note the methodology used to project New Mexico’s production is the same as that used for Texas. This raises the question of why are the New Mexico results so much closer to the EIA’s data than Texas?
More oil production information for these two counties and Texas counties is reviewed in the special Permian section further down.
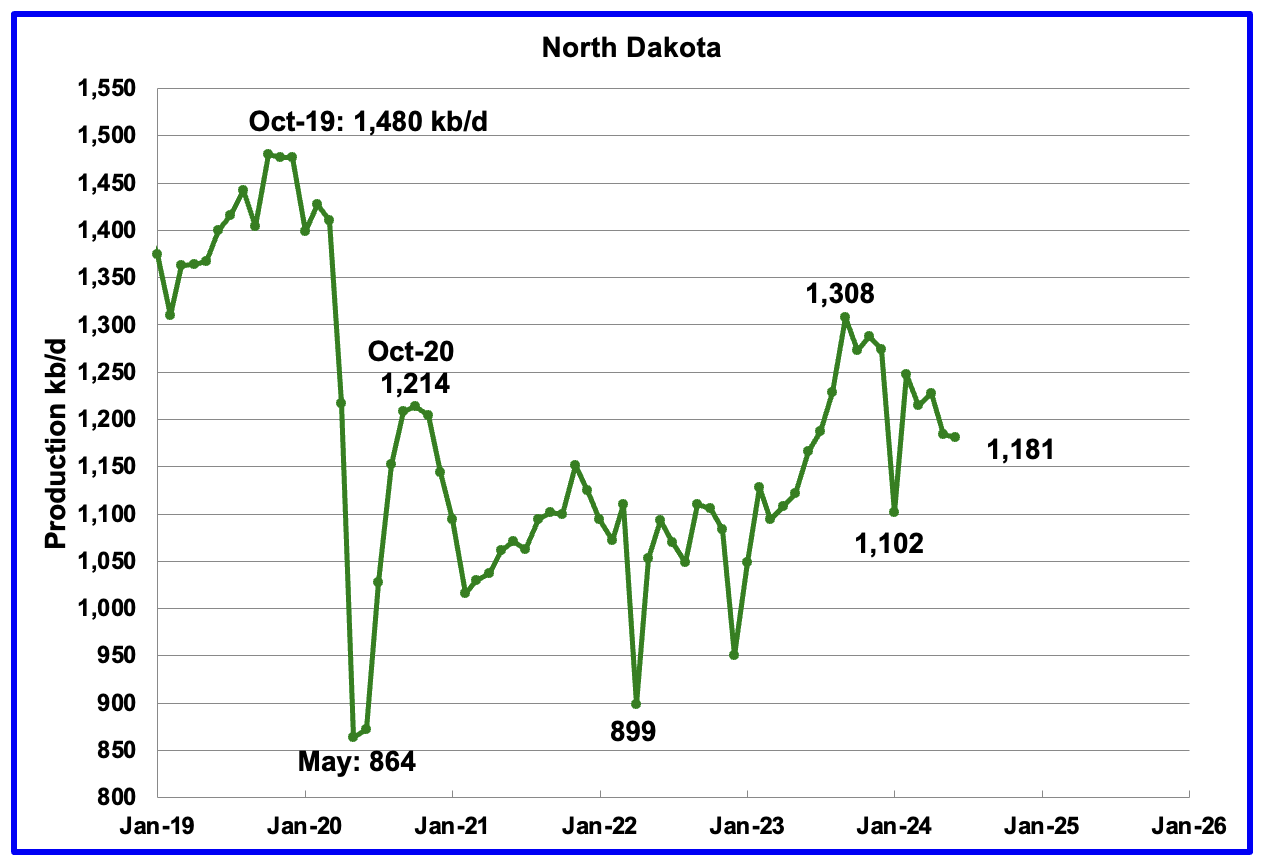
June’s output decreased by 3 kb/d to 1,181 kb/d. YoY production was up by 15 kb/d. The North Dakota DMR reported that oil production dropped by 22 kb/d in June to 1,176 kb/d.
According to this article, North Dakota’s oil production dropped in June.
“In the latest Director’s Cut report, Department of Mineral Resources Assistant Director Mark Bohrer said oil production fell 2% to about 1.17 million barrels per day. Gas production saw a 1% drop to about 3.47 billion cubic feet of gas a day.
He said it may be difficult to achieve the 1.3 million barrel mark by the end of the year, given the slow movement trends.”
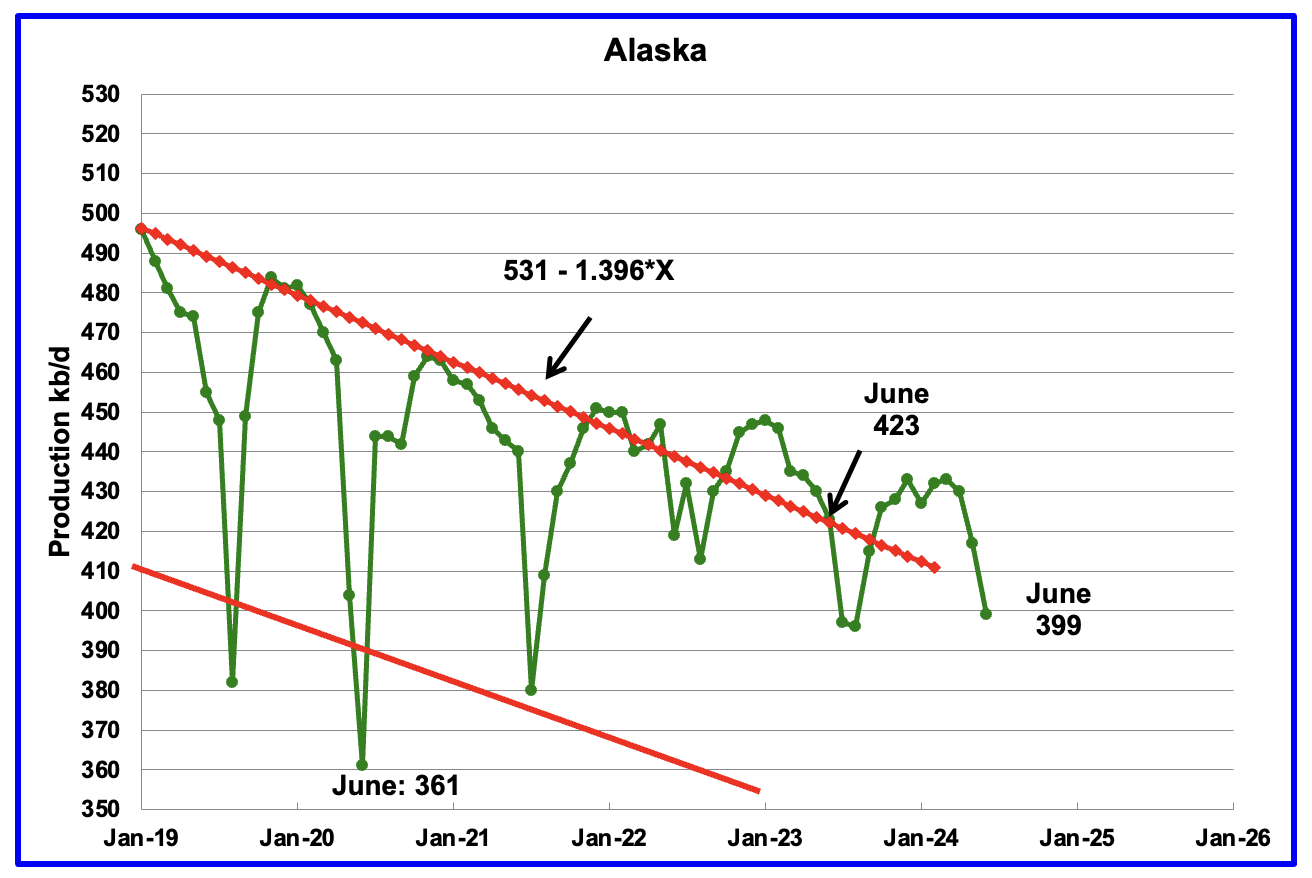
Alaskaʼs June output dropped by 18 kb/d to 399 kb/d. Production YoY is also down by 24 kb/d. The EIA’s weekly petroleum report continues to show Alaska’s July oil production also dropping below 400 kb/d. Typically Alaska’s production drops in the summer months due to maintenance.
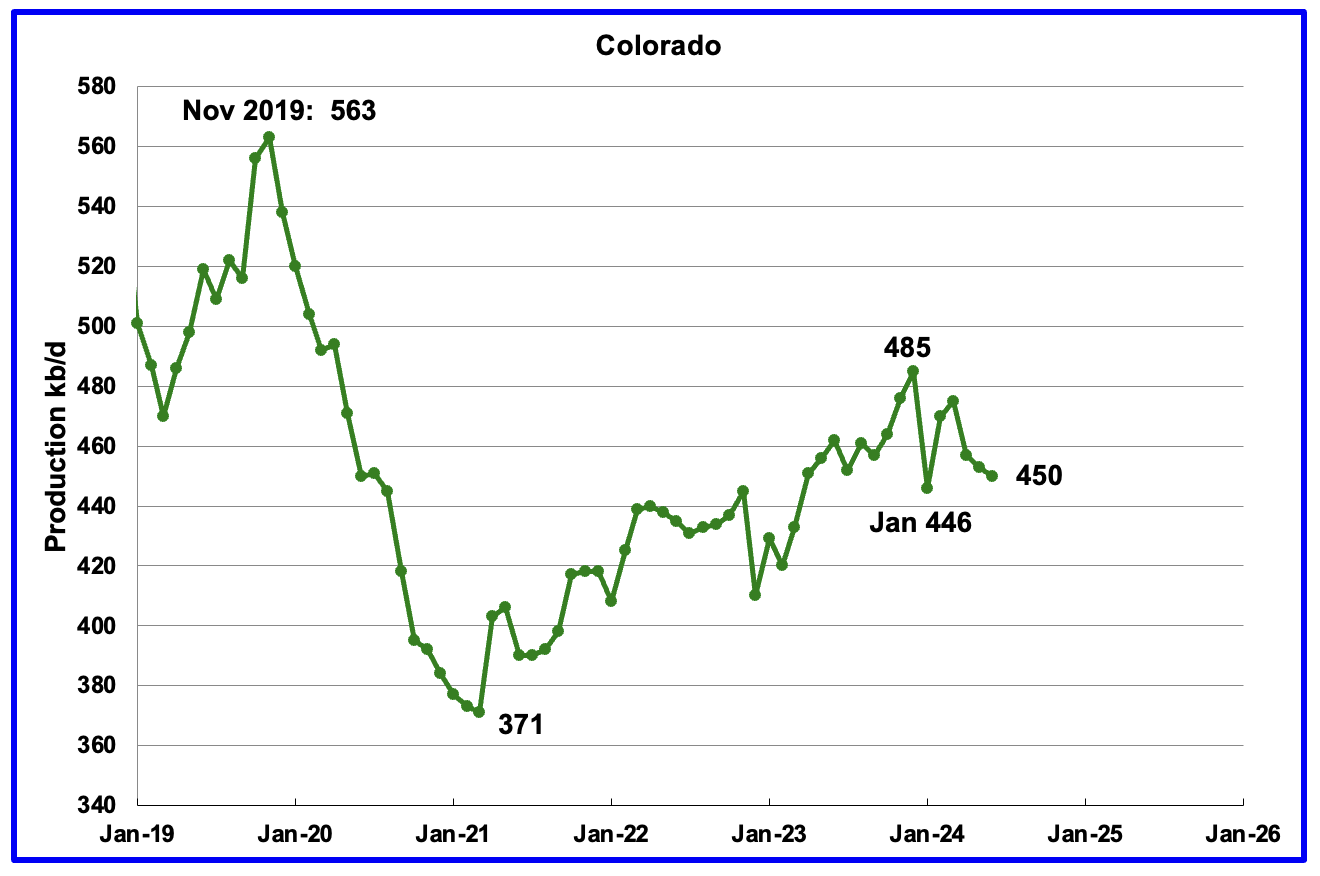
Coloradoʼs June oil production decreased by 3 kb/d to 450 kb/d. Colorado has moved ahead of Alaska to become the 4th largest US oil producing state. Colorado began the year with 12 rigs but has now dropped to 10 during June, July and August.
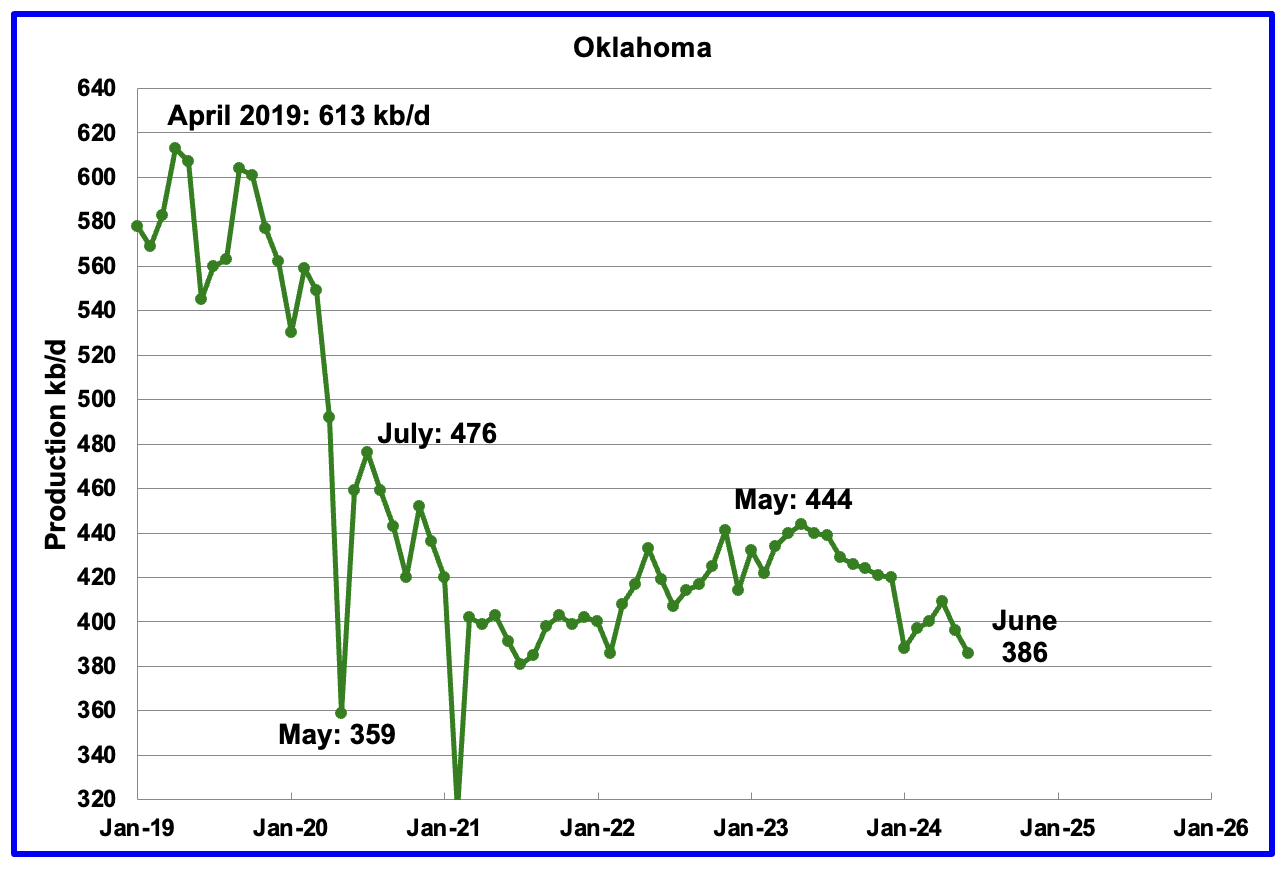
Oklahoma’s output in June dropped by 10 kb/d to 386 kb/d. Production remains below the post pandemic July 2020 high of 476 kb/d. Output appears to have entered a slow declining phase in June 2023. Oklahoma’s rig count dropped from 40 in May to 30 in July. By the end of August there was an uptick to 37 operational rigs. Will increase in the rig count reverse the current dropping production trend?
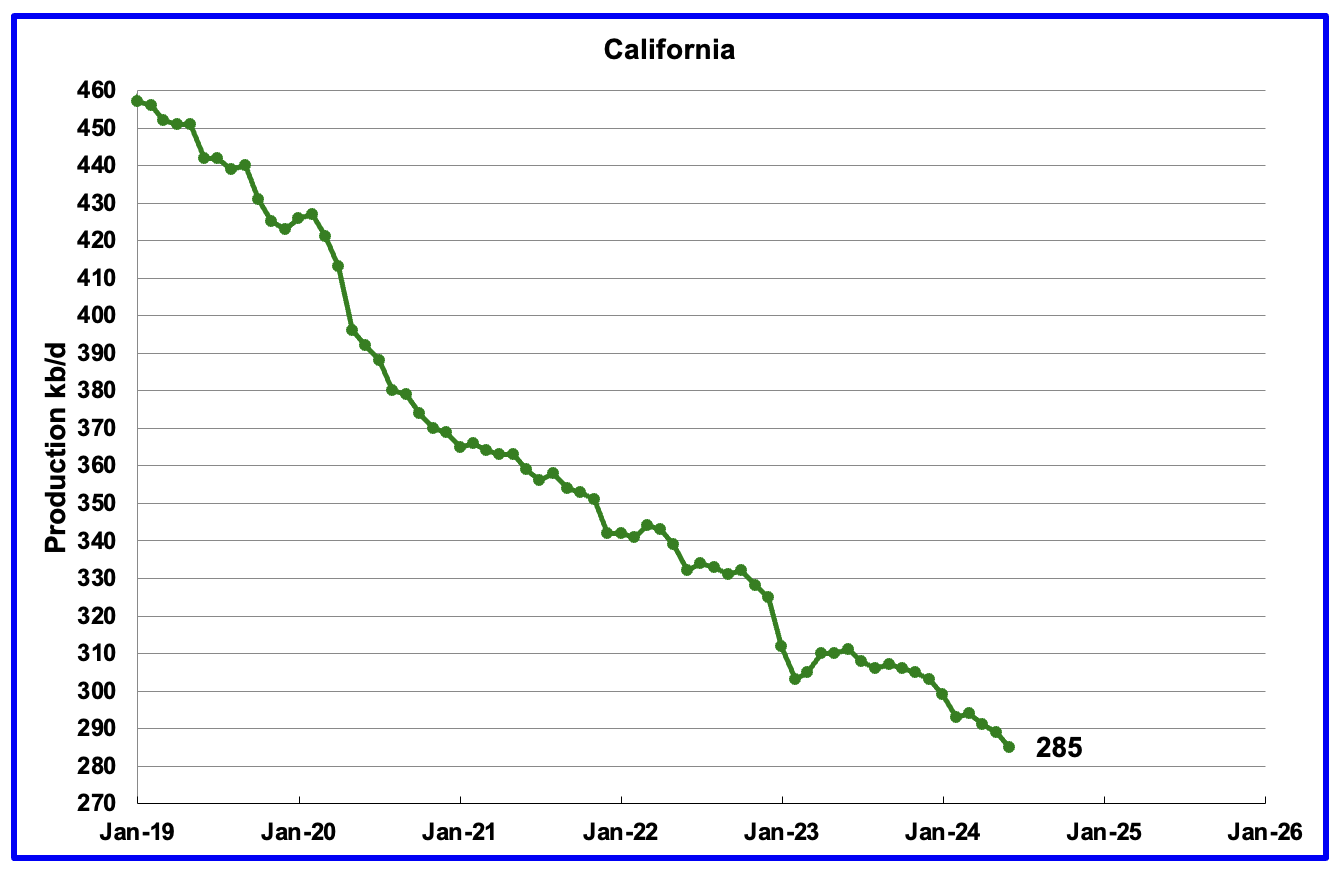
California’s declining production trend continues. Californiaʼs June production dropped by 4 kb/d to 285 kb/d.
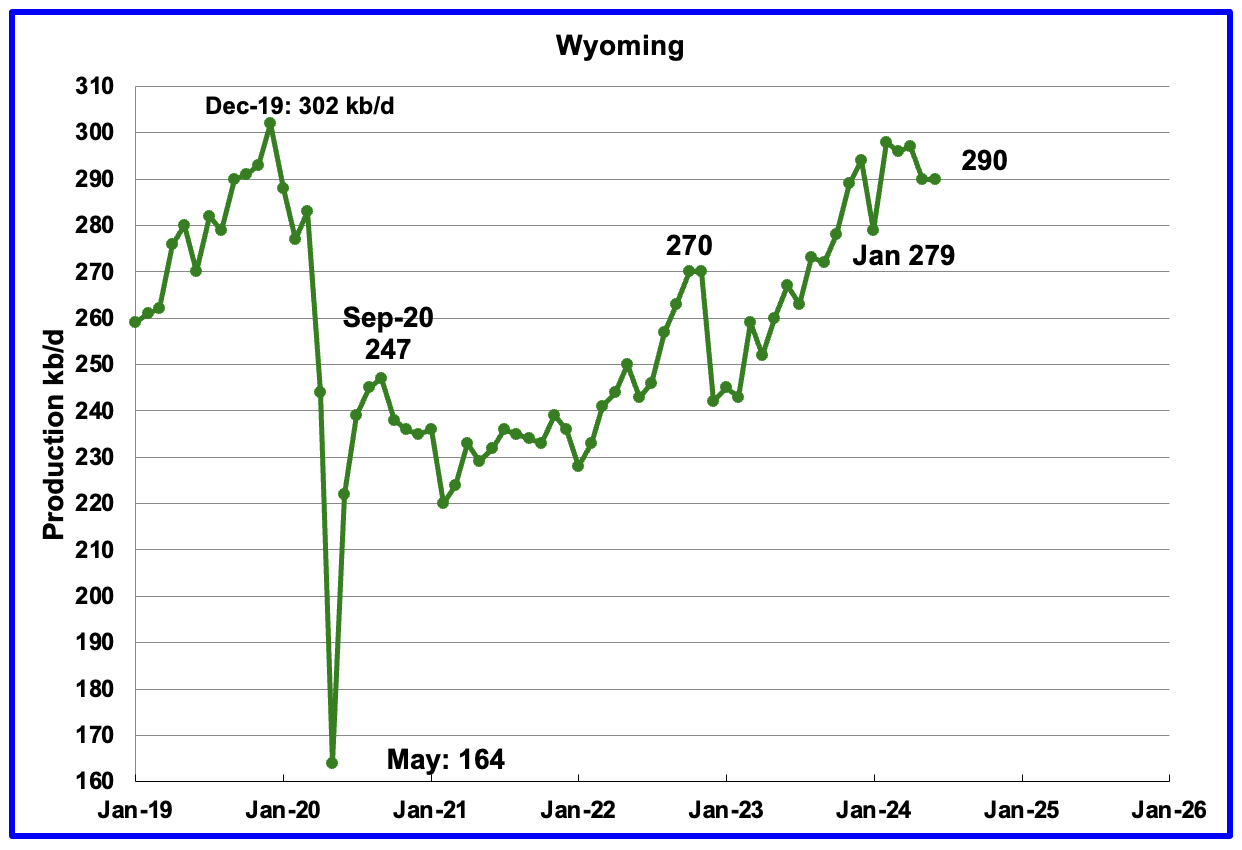
Wyoming’s oil production has been rebounding since March 2023. However the rebound was impacted by the January 2024 storm. June production was flat at 290 kb/d and may be entering a plateau phase. Note that production has almost recovered to the pre-Covid level.
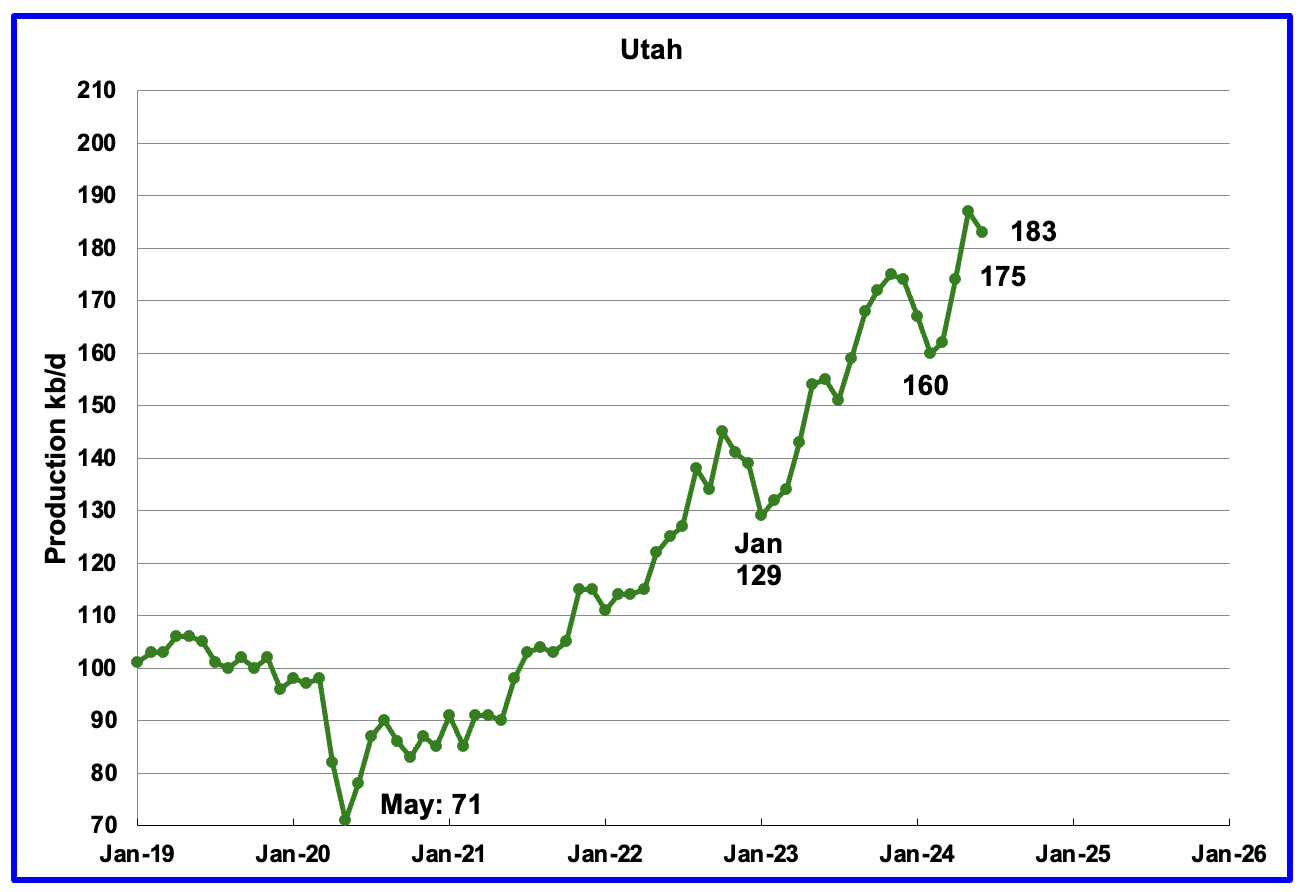
June’s production decreased by 4 kb/d to 183 kb/d. Utah has had 9 oil rigs in operation through out 2024.
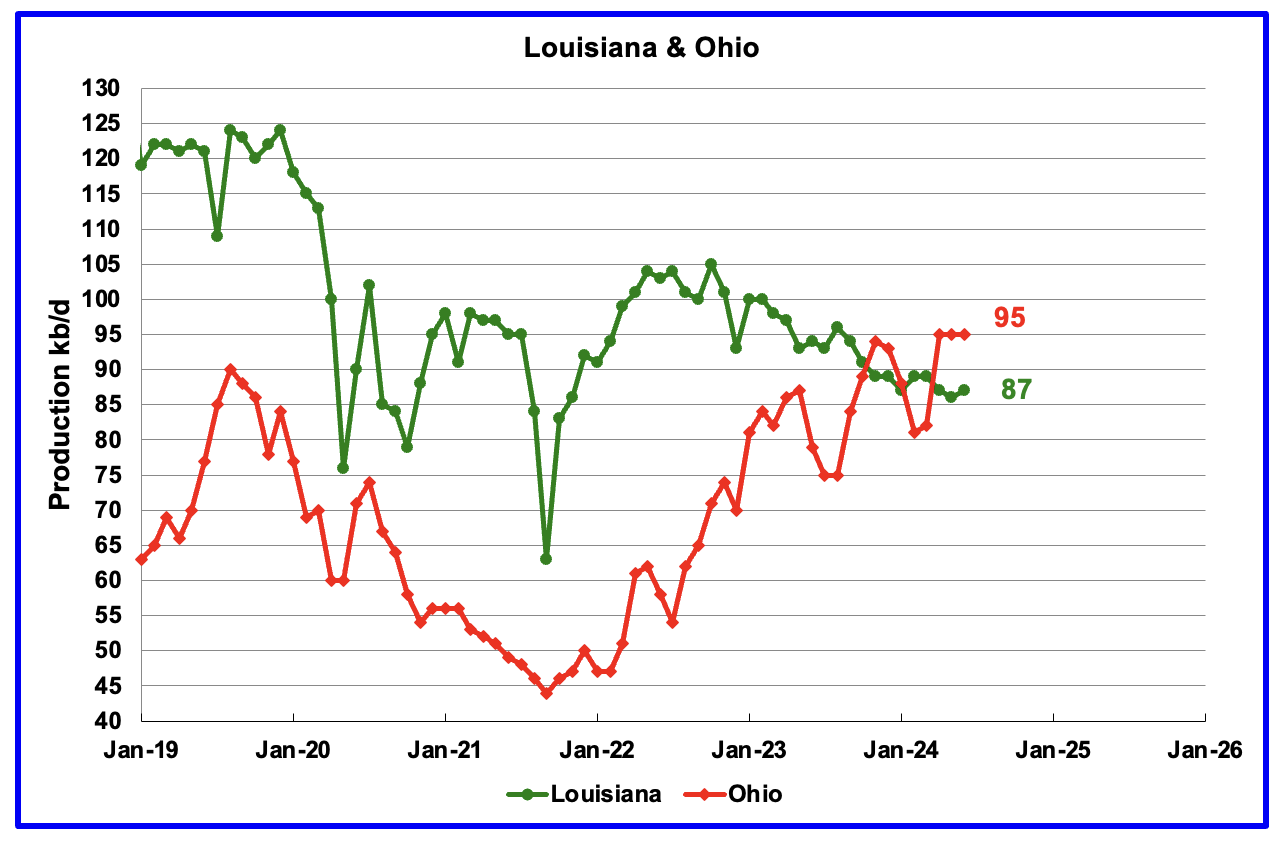
Ohio has been added to the Louisiana chart because Ohio’s production has been slowly increasing since October 2021 and passed Louisiana in November 2023.
Louisiana’s output entered a slow decline phase in October 2022. June’s production increased by 1 kb/d to 87 kb/d. Ohio’s oil production was flat at 95 kb/d, a new high. The most recent Baker Hughes rig report now shows two horizontal oil rigs operating in Ohio in July and August.
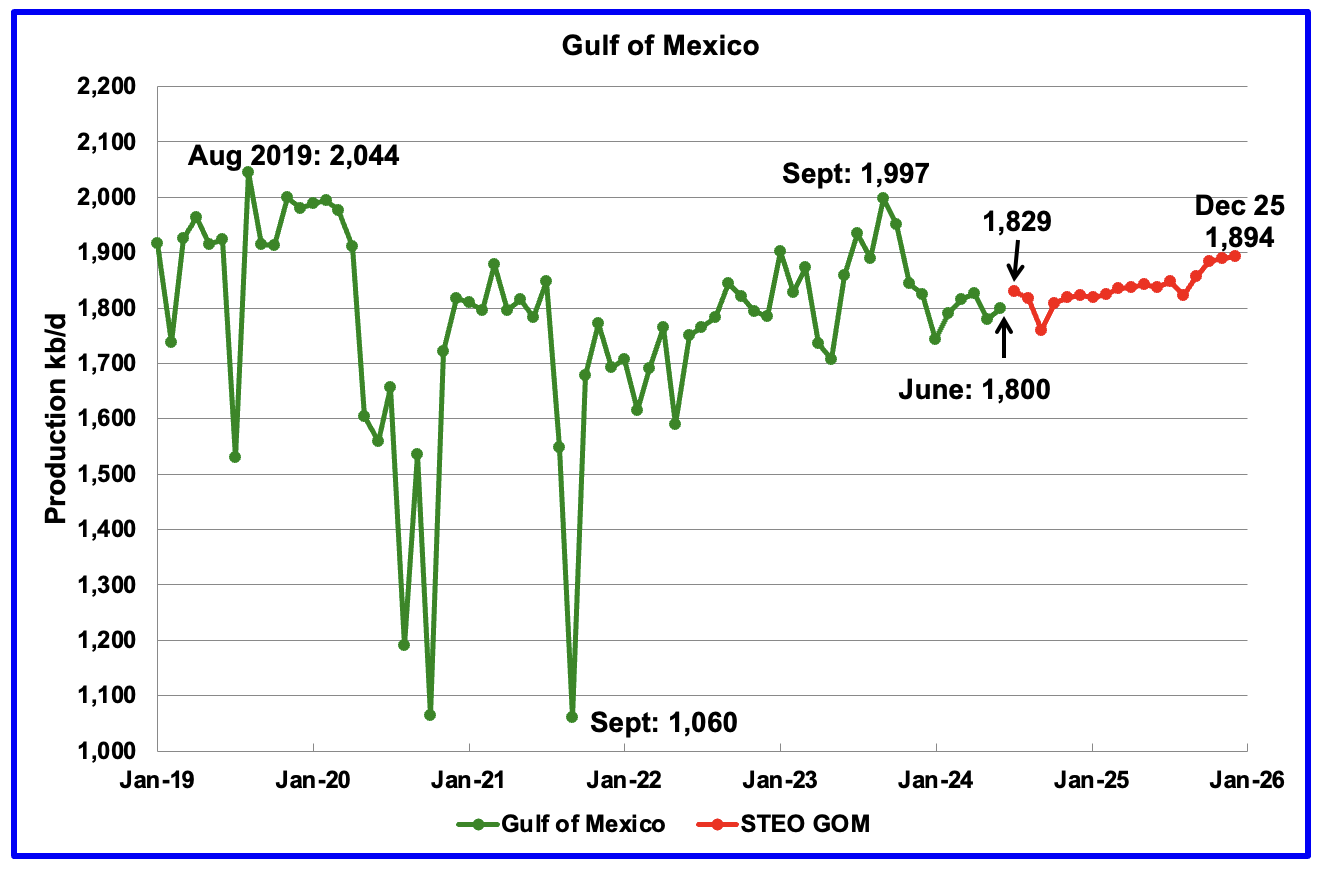
GOM production rose by 20 kb/d in June to 1,800 kb/d but is expected to rise by 29 kb/d in July to 1,829 kb/d.
The August 2024 STEO projection for the GOM output has been added to this chart. It projects production from July 2024 to December 2025 will rise by 65 kb/d to 1,894 kb/d which is 19 kb/d higher than in the previous STEO.
In the January 2024 EIA report, the STEO was forecasting December 2025 GOM oil production to be 1,954 kb/d, 125 kb/d higher than the latest forecast. What changed? It could change again according to the article below.
According to this article and this article, Chevron has made a significant breakthrough in the GOM.
Chevron breakthrough a boon for deepwater US Gulf
New York, 3 September (Argus) — The start-up of the first ultra-high pressure deepwater development in the US Gulf of Mexico paves the way for millions of barrels of previously hard-to-reach resources to be tapped in the offshore basin.
First oil from Chevron’s $5.7bn, 75,000 b/d Anchor project — designed to withstand pressures of up to 20,000 lb/inch² (1,400 kg/cm²) with reservoir depths reaching 34,000ft (10,400m) below sea level — opens up a new frontier in deepwater production. Not only will it increase output from a region where production has plateaued since peaking at 2mn b/d in 2019, but the expertise gleaned could also be deployed in prospects from Namibia to Brazil.
The so-called “20k” high-pressure technology could potentially unlock more than 2bn boe of resources in the US Gulf of Mexico, consultancy Wood Mackenzie says. Operators expect individual wells to recover at least 30mn boe, which could extend the operating life of the basin. Chevron, one of the largest leaseholders in the deepwater Gulf of Mexico, has three projects due to come on line in the area after Anchor. “However, if results fall short, it could mark the beginning of a production decline in the basin and a blow to a resurgence in exploration for additional barrels in the play,” Wood Mackenzie principal analyst Mfon Usoro says.
A Different Perspective on US Oil Production
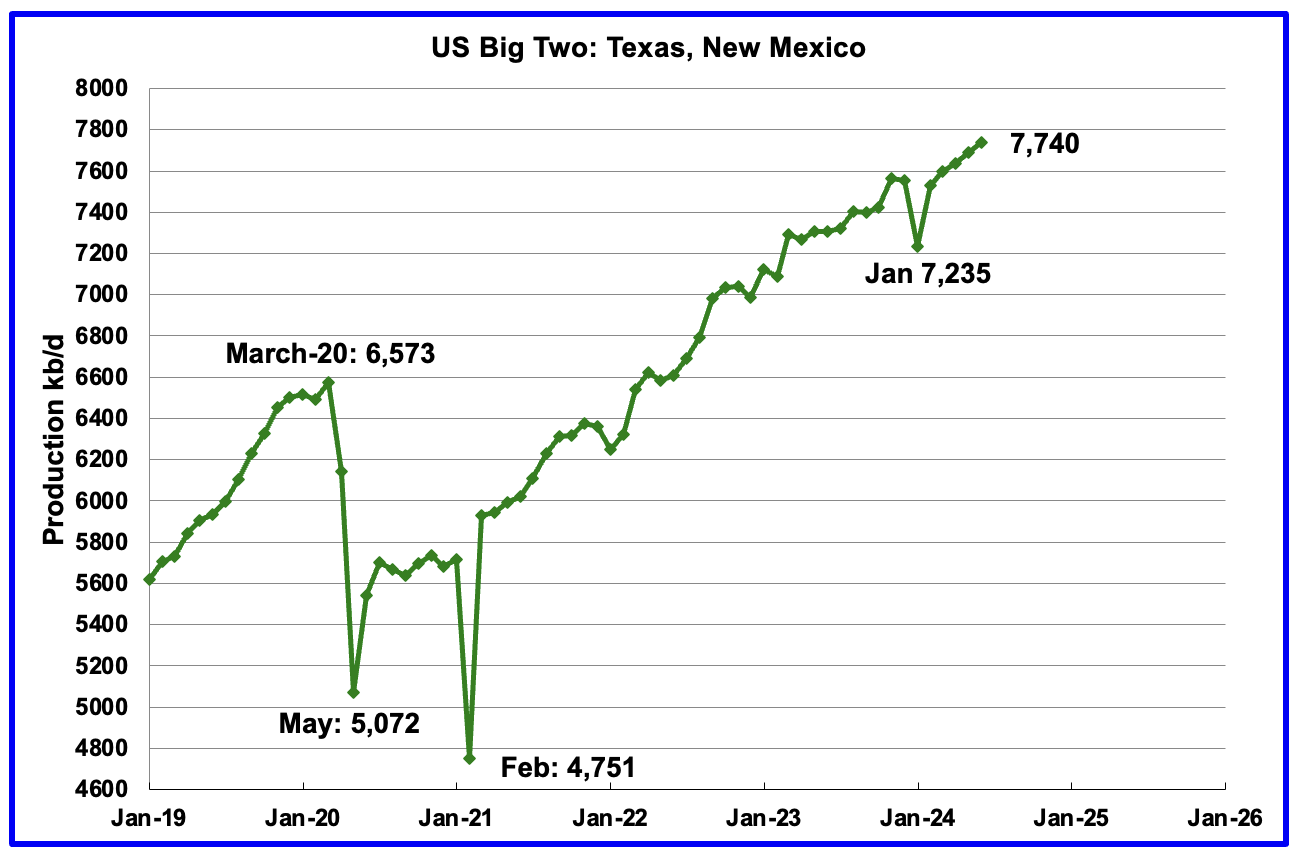
The Big Two states combined oil output for Texas and New Mexico.
June’s production in the Big Two states increased by a combined 49 kb/d to 7,740 kb/d with Texas adding 58 kb/d while New Mexico dropped 9 kb/d.
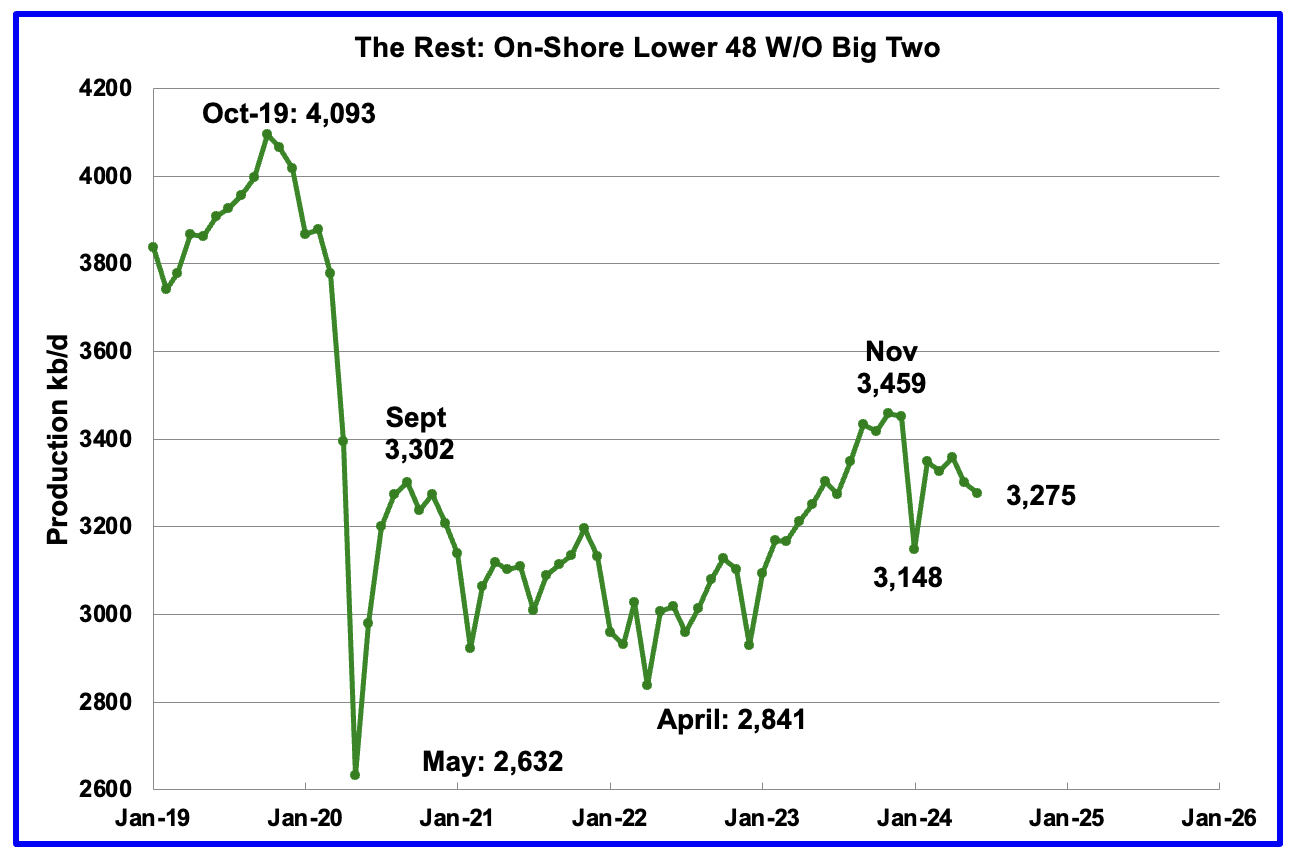
Oil production by The Rest
June’s oil production in The Rest dropped by 26 kb/d to 3,275 kb/d and is 184 kb/d lower than November 2023.
The main takeaway from The Rest chart is that current production is below the high of October 2019 and is a significant loss that occurred during the Covid shut down and will not be readily recovered. Note that production is now lower than Sept 2020 post covid rebound to 3,302 kb/d.
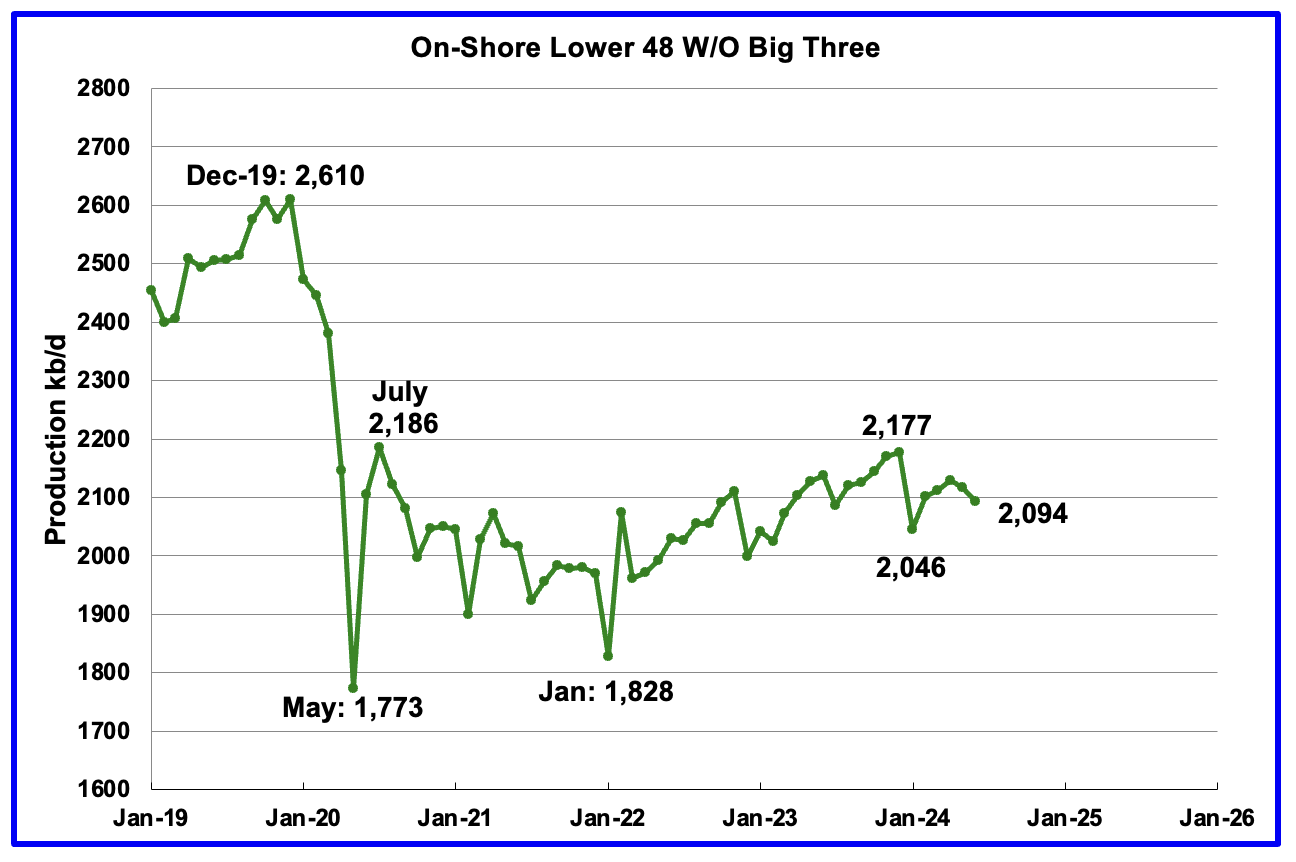
The On-Shore lower 48 W/O the big three, Texas, New Mexico and North Dakota, shows production is on a plateau in the range of 2,100 ±100 kb/d from January 2023.
June’s production decreased by 23 kb/d to 2,094 kb/d. Two of the bigger contributors with declines were Alaska 18 kb/d and Oklahoma 10 kb/d.
Permian Basin Report by Main Counties and Districts
This special monthly Permian section was recently added to the US report because of a range of views on whether Permian production will continue to grow or will peak over the next year or two. The issue was brought into focus recently by the Goehring and Rozencwajg Report which indicated that a few of the biggest Permian oil producing counties were close to peaking or past peak. Also comments by posters on this site have similar beliefs from hands on experience.
This section will focus on the four largest oil producing counties in the Permian, Lea, Eddy, Midland and Martin. It will track the oil and natural gas production and the associated Gas Oil Ratio (GOR) on a monthly basis. The data is taken from the state’s government agencies for Texas and New Mexico. Typically the data for the latest two or three months is not complete and is revised upward as companies submit their updated information. Note the natural gas production shown in the charts that is used to calculate the GOR is the gas coming from both the gas and oil wells.
Of particular interest will be the charts which plot oil production vs GOR for a county to see if a particular characteristic develops that indicates the field is close to entering or in the bubble point phase. While the GOR metric is best suited for characterizing individual wells, counties with closely spaced horizontal wells may display a behaviour similar to individual wells due to pressure cross talking . For further information on the bubble point and GOR, there are a few good thoughts on the intricacies of the GOR in an earlier POB comment. Also check this EIA topic on GOR.
New Mexico Permian
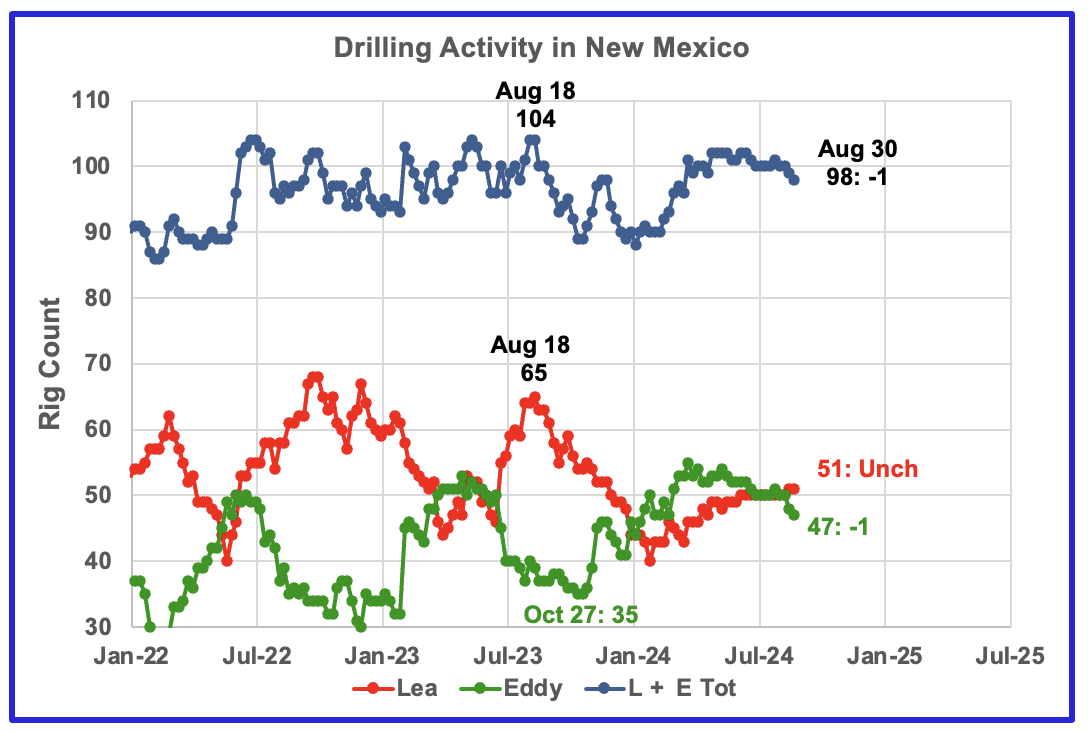
The rig count in late August 2024 is down 6 from the August 2023 high of 104 rigs.
Since the middle of August 2023, the Lea county rig count has dropped from 65 rigs to 40 rigs in late January 2024. Since then the rig count has slowly risen by 11 to 51 rigs at the end of August. At the same time production has increased to 1,250 kb/d over the period January 2023 to June 2024. However due to a time lag between rig count and production, Lea may be on the verge of entering a decline phase. See next chart.
From a low of 35 rigs in late October 2023, 20 rigs were transferred into Eddy county between October and March 2024. At its peak in late March 2024, Eddy county had 55 rigs operating and are now down to 47 rigs at the end of August.
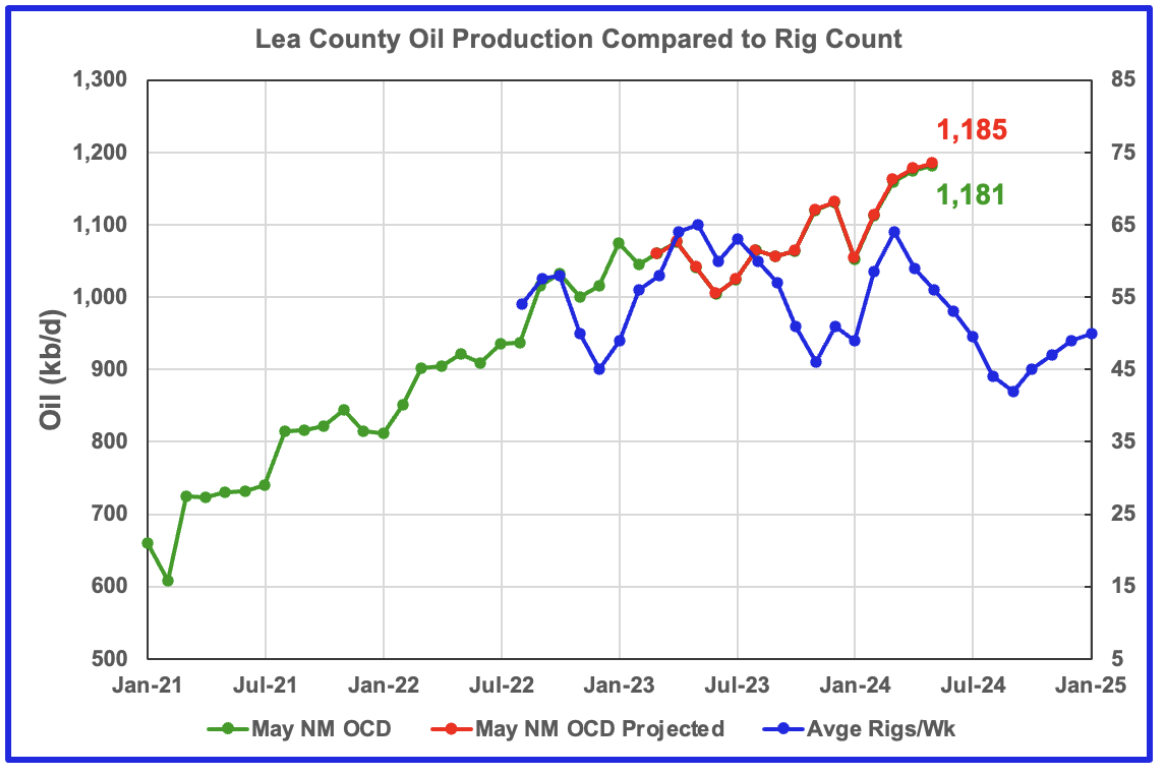
For comparison to the chart below, last month’s Lea oil production chart.
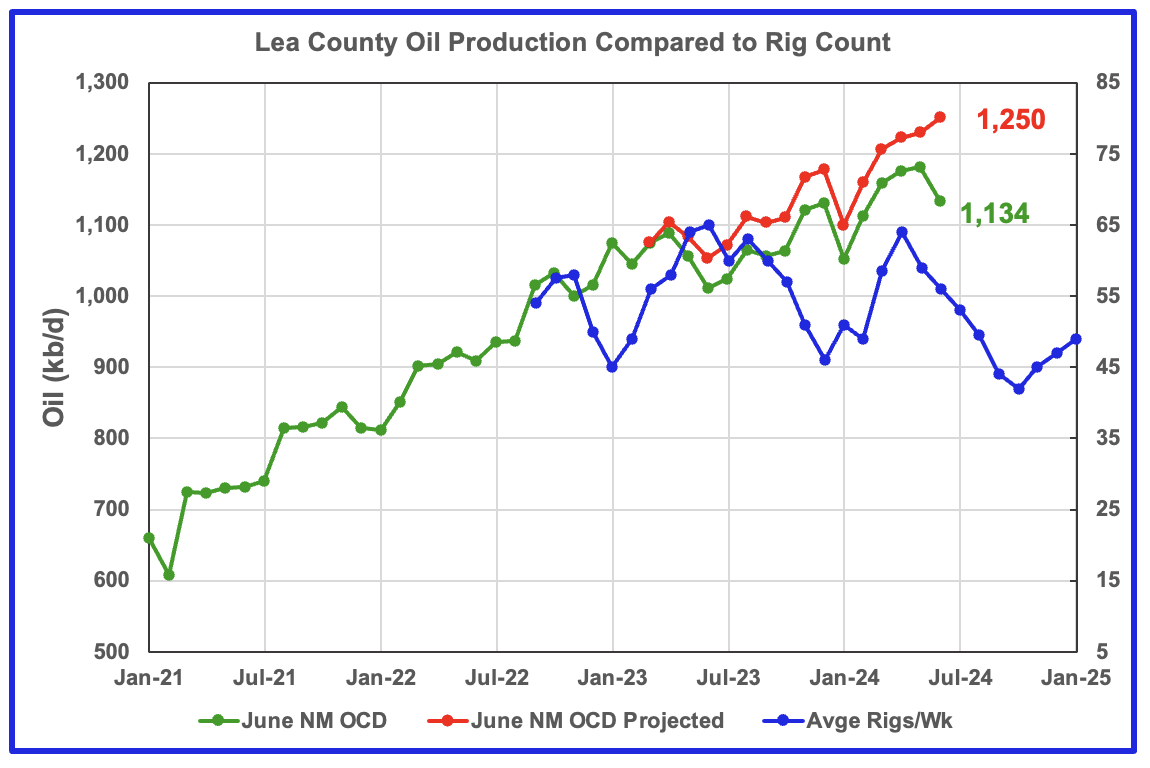
This chart is indicating that we will have to wait for another month or two to determine how close Lea county is to peaking.
The June update made a total upward revision of 48 kb/d to production between the months March 2023 to June 2023. This revision shifted both the original June OCD data and the projection upward and created a big gap between the June data and the projection. The previous posts showed almost no changes between the original data and the projection after one year, see comparison chart above.
While the latest June New Mexico OCD data shows a big drop in June production, the upward production revisions of 48 kb/d along with the typical previous month production drop results in a 20 kb/d increase in the projected June production. While this is what the model forecasts, I don’t think it is correct and it will be sorted out next month, provided the production revisions are more typical.
The blue graph shows the average number of weekly rigs operating during a given month as taken from the weekly rig chart. The rig graph has been shifted forward by 8 months. So the 64 Rigs/wk operating in August 2023 have been time shifted forward to April 2024 to show the possible correlation and time delay between rig count and oil production.
Note that rig counts are being used to project production as opposed to completions because very few extra DUCs are being completed at this time.
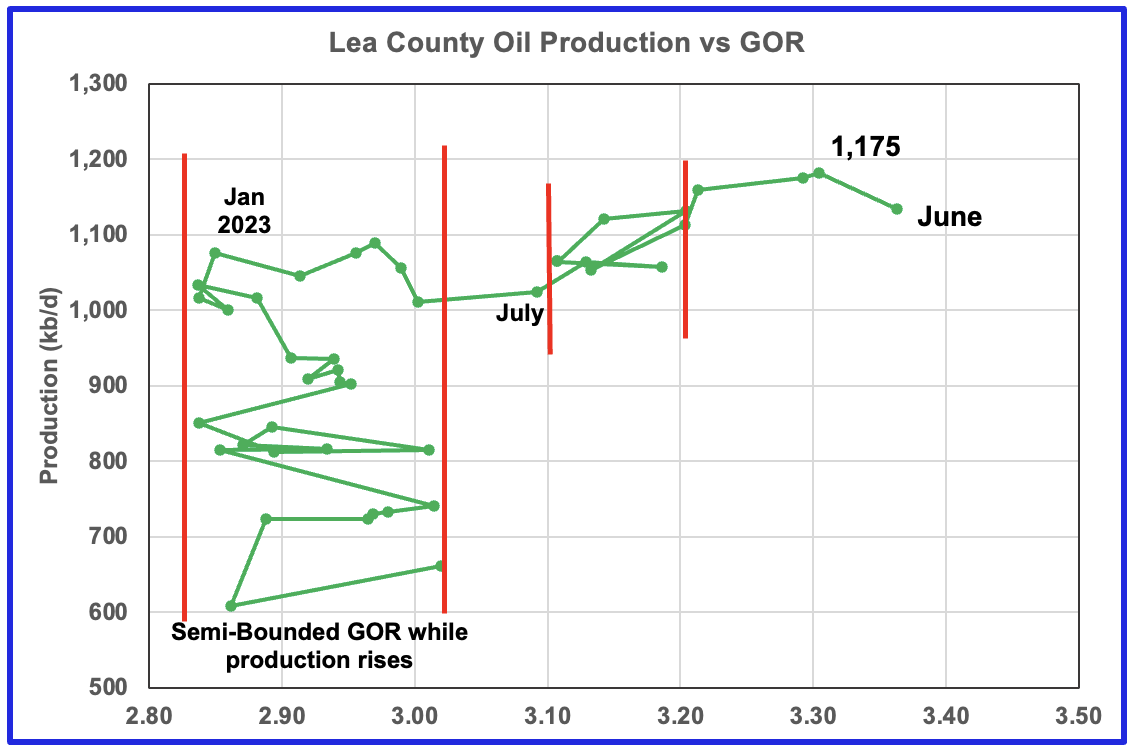
After much zigging and zagging, oil production in Lea county stabilized just above 1,000 kb/d in early 2023. Once production reached a new high in January 2023, production rose more slowly while the GOR started to increase rapidly to the right and entered the bubble point phase in July 2023.
Since July 2023 Lea county GOR has continued to increase as production increased. This may indicate that the current production increase is coming from a new bench/area since the GOR’s behaviour since August 2023 to March 2024 time frame appears once again to be in a semi bounded GOR phase accompanied with rising production. However in April, May and June 2024, the GOR moved out of the Second semi bounded GOR region and production reached a new high 1,175 kb/d in May along with an another increase in the GOR. The increase in the GOR for the last three months is another indicator that Lea county has entered the bubble point phase for a second time and that production is near its peak.
This zigging and zagging GOR pattern within a semi-bounded GOR while oil production increases to some stable level and then moves out to a higher GOR to the right has shown up in a number of counties. See an additional two cases below.
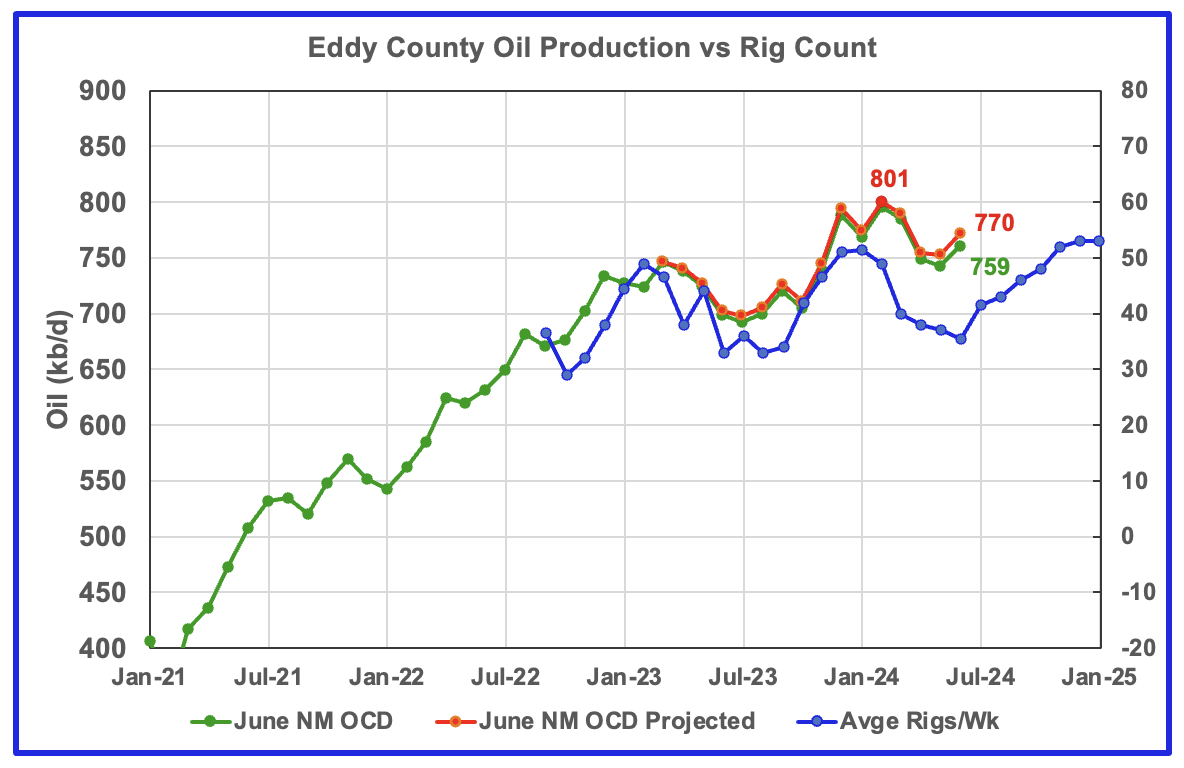
Eddy County oil production has peaked and appears to be tracking the rig graph.
Eddy county oil production hit a projected high of 801 kb/d in February 2024. The NM OCD projection estimates that the production forecast for June increased by 19 kb/d to 770 kb/d.
The blue graph shows the average number of weekly rigs operating during a given month as taken from the above weekly drilling chart. The rig graph has been shifted forward by 8 months to roughly coincide with the increase in the production graph starting in October 2023.
If production were to follow the rig count trend going forward, Eddy production should continue to drop till June before rising again starting in July. However production began to rise in June. The beginning of a new rising trend does not mean that production will exceed the February peak of 807 kb/d. It is the increasing legacy decline that will limit how much production can increase from the May low.
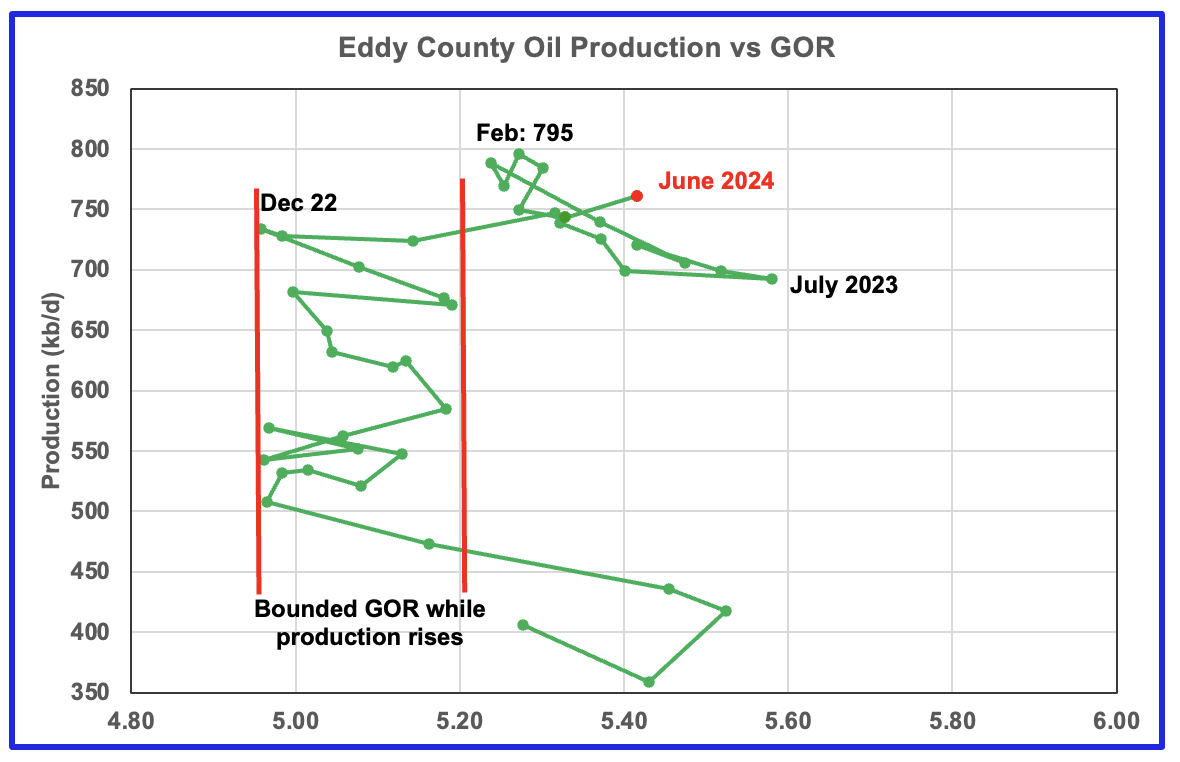
The Eddy county GOR pattern is similar to Lea county except that Eddy broke out from the semi bounded range earlier and for a longer time.
August 2023 saw a reversal in the increasing GOR trend which then was followed by the current oil production increase which reached a new high in February 2024 of 795 kb/d, an atypical pattern. This behaviour appears to be another bounded GOR phase while production rises.
Since February, production has fallen and the GOR has been essentially unchanged. For the last five months the GOR moved within a narrow range of 5.25 and 5.33. However June saw a jump in the GOR to 5.42 accompanied by a rise in production, red marker.
Texas Permian
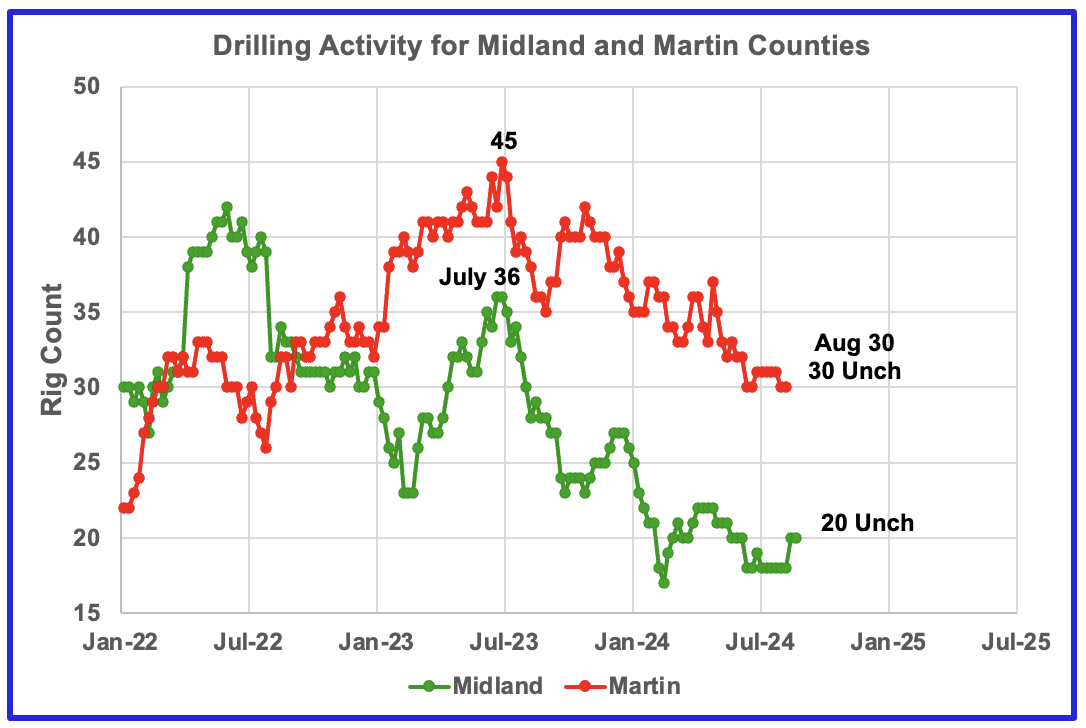
The rig count in Midland county has been dropping since July 2023. Midland county rigs have continued to drop and reached a low of 18 in July. They have rebounded to 20 at the end of August. Rigs are down close to 50% from where they were in July 2023.
Martin county rigs are also in a slow decline. At the end of August the rig count dropped another 2 to 30, down 33% from the high of 45 in July 2023.
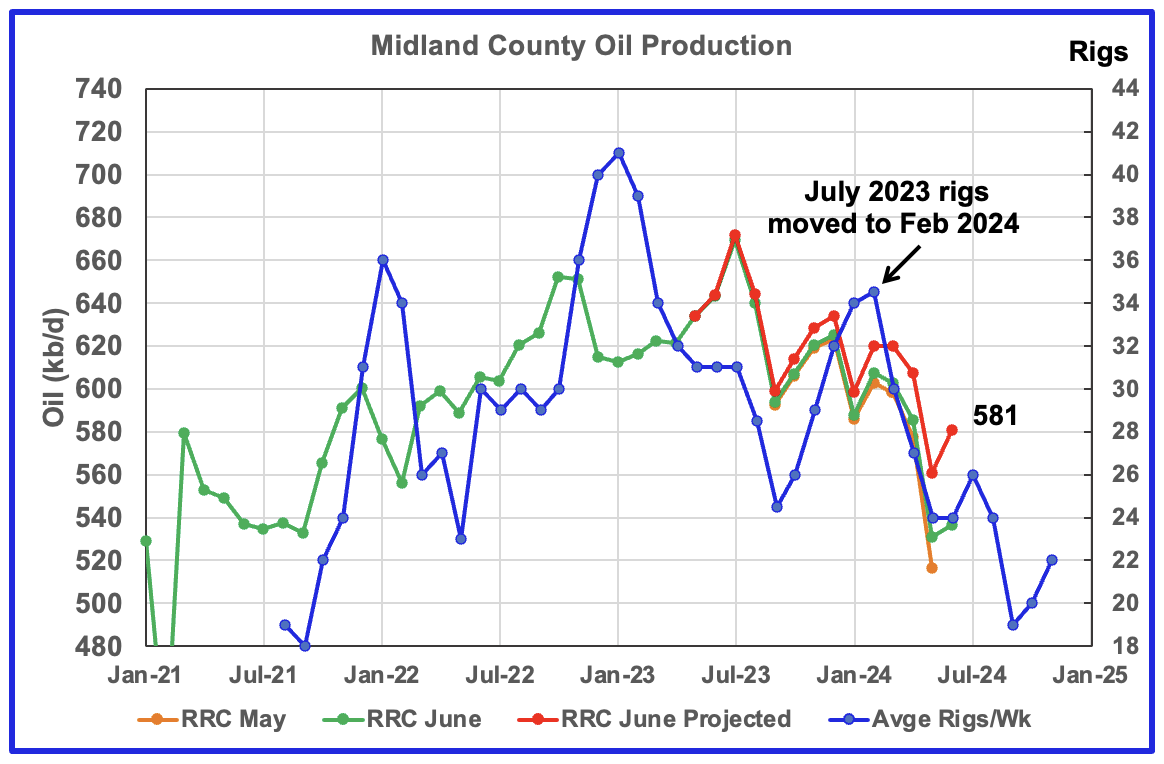
Midland County production has peaked.
Midland County’s slow and steady declining oil production phase started in August 2023. The green graph shows June’s preliminary production as reported by the Texas RRC. Midland county’s June preliminary production reversed the dropping trend and increased the projected production by 20 kb/d to 581 kb/d.
The orange and green graphs show the production reported by the Texas RRC for May and June. Note that the last month in the June production graph is higher than the last month in the May production graph. This is why the projection shows increased production for June.
The blue graph shows the average number of weekly rigs operating during a given month as taken from the weekly drilling chart. The rig graph has been shifted forward by eight months. So the average 34.5 Rigs/wk operating in July 2023 have been moved forward to February 2024 to show the possible correlation and time delay between rig count and oil production. If the eight month shift in the rig count is approximately correct in that oil production can be tied to the rig count, oil production in Midland county should increase for a month or two before resuming its decline
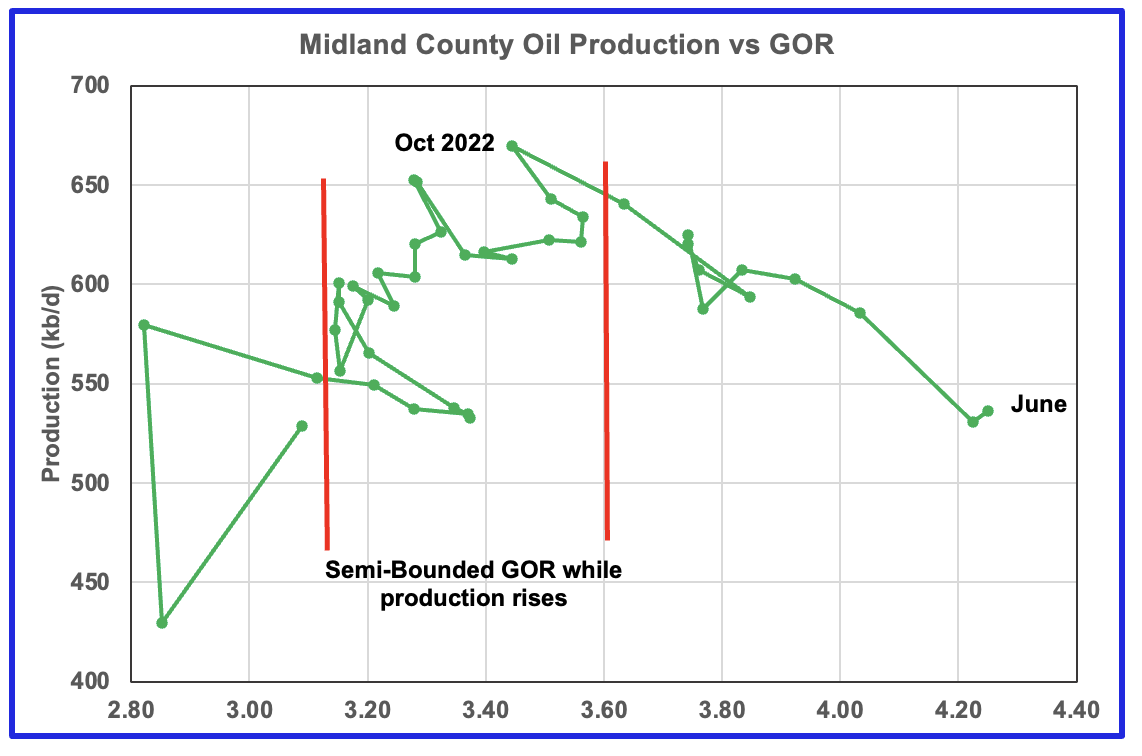
With Midland county deep into the bubble point phase, oil production has dropped significantly from October 2022 and the GOR continues to increase. Note that oil production and GOR in this chart is based on the RRC’s preliminary May production report.
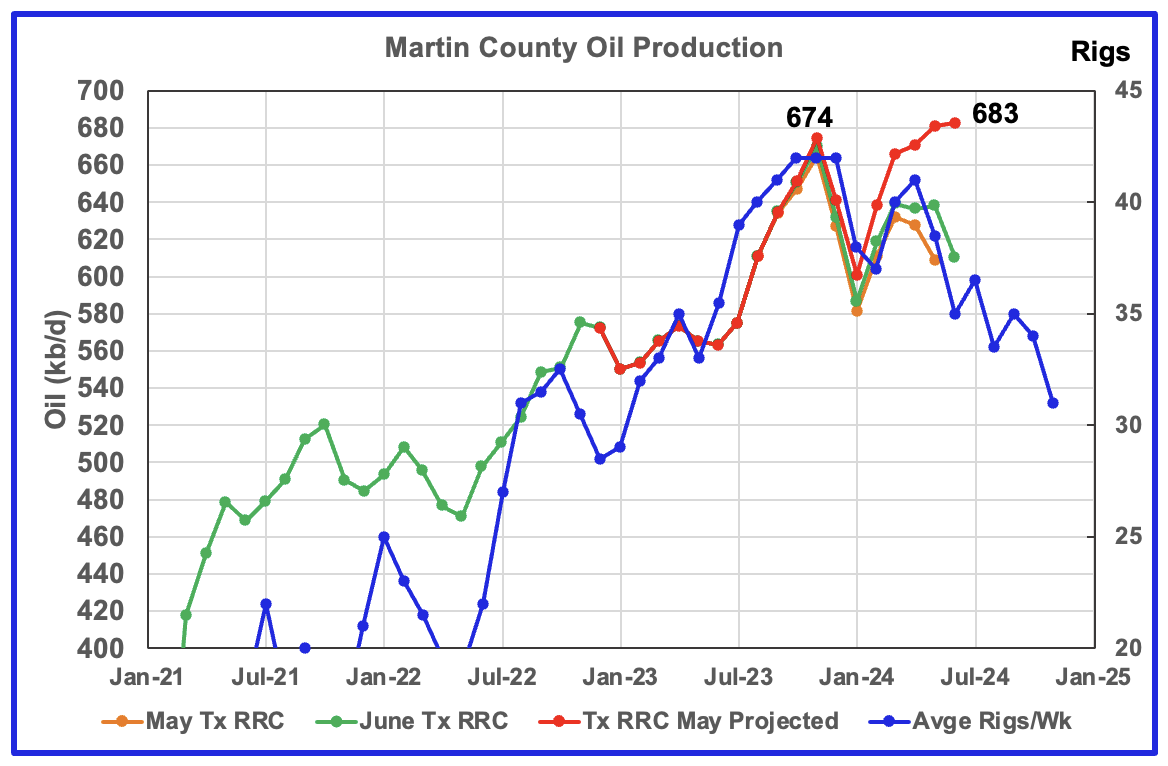
Martin County has peaked and is on a plateau and could be on the verge of entering its decline phase.
This chart shows Texas RRC oil production for Martin County. It was showing initial signs of peaking in November 2023 but was then followed by declining production to January 2024. Production has been tracking the increasing rig count according to the time shifted rig count and production began to increase in February. June production was essentially flat at 683 kb/d and is 9 kb/d higher than the November peak of 674 kb/d.
The red graph is a production forecast which the Texas RRC could be reporting for Martin county about one year from now as the Texas RRC reports additional updated production information. This projection is based on a methodology that used May and June production and will be re-estimated each month going forward. Production should fall in July if production follows the rig count.
The orange and green graphs show oil production reported by the Texas RRC for May and June.
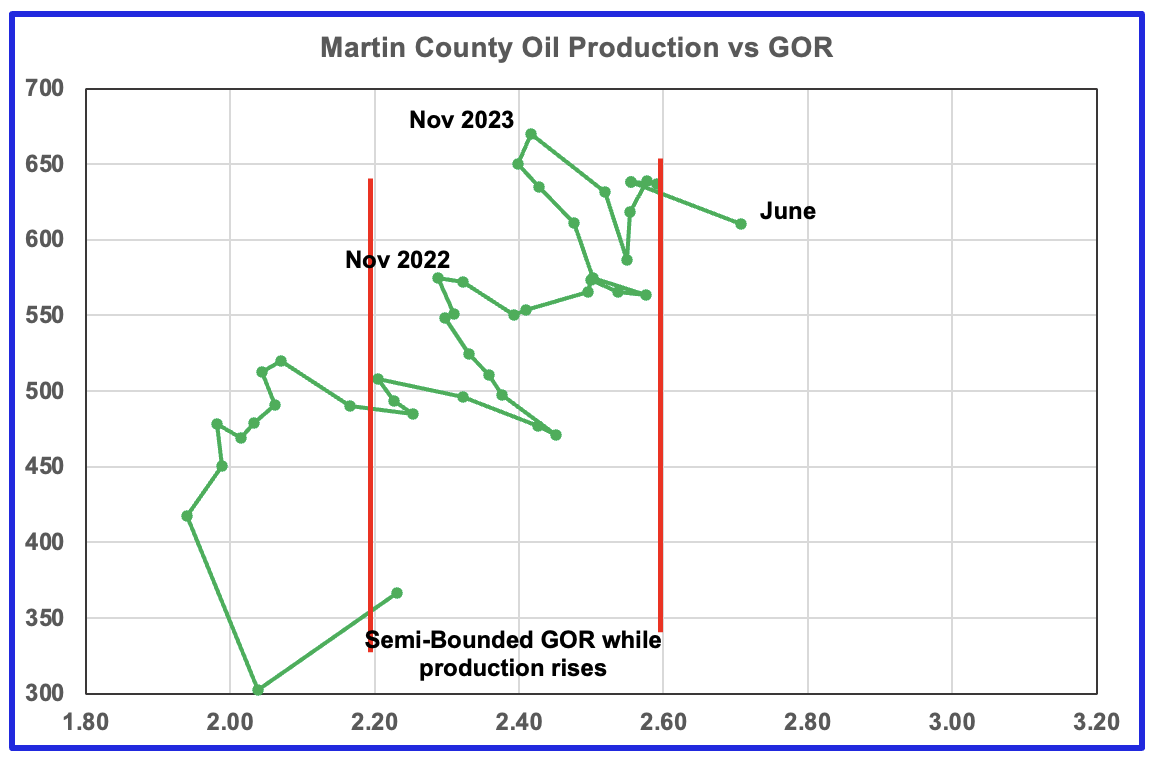
Martin county’s oil production after November 2022 increased and at the same time drifted to slightly higher GORs within the semi bounded range. However January, February and March 2024 saw production move higher while the GOR remained essentially unchanged at close to 2.56. June’s preliminary gas and oil production indicates that production was almost flat along with the GOR moving out of the semi-bounded area.
Martin county has the lowest GOR of the four counties at a GOR of close to 2.60 but for June jumped to 2.71, out of the semi-bounded region. Martin County may have entered the bubble point phase that should result in a dropping oil production trend.
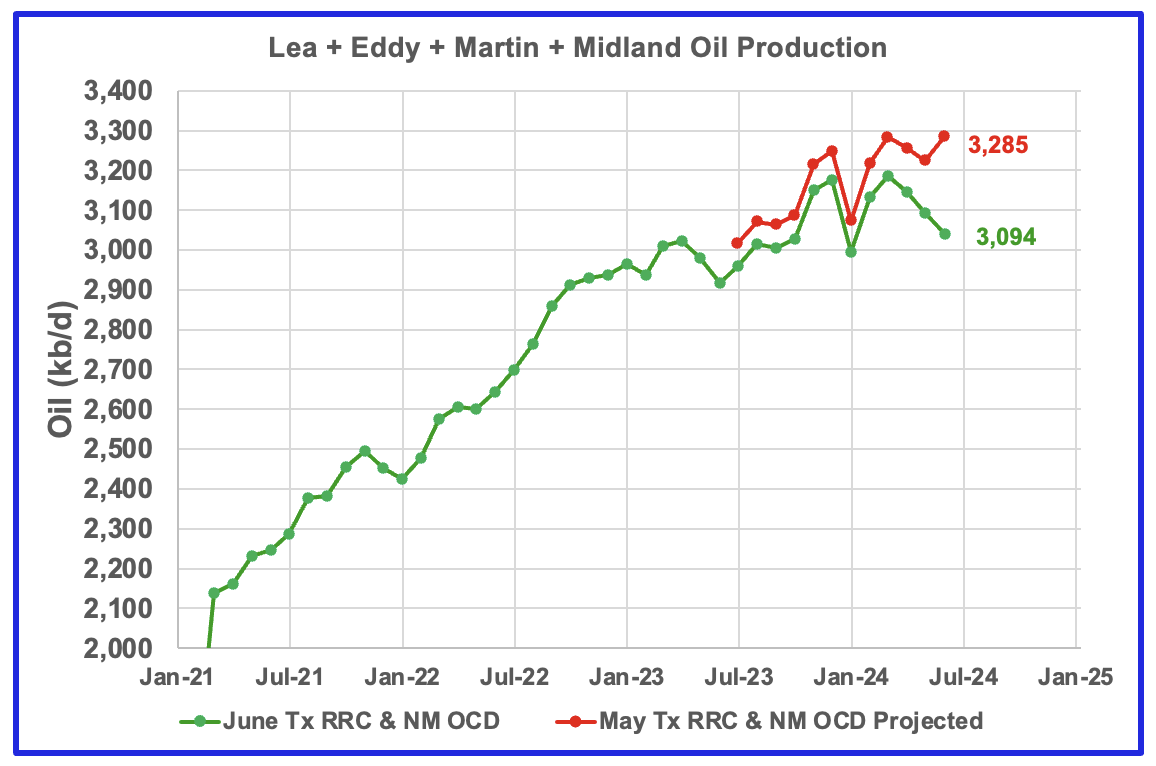
This chart shows the total oil production from the four largest Permian counties. Assuming that current June Permian production is close to 6,300 kb/d, these four counties account for 50% of the total. If their combined production has peaked, the Permian has peaked. A few more months of data is required to determine if the Permian has peaked.
June production rose by 60 kb/d to 3,285 kb/d. The May and June initial production data is shown in the orange and green graphs respectively. The red graph uses the May and June data to project an estimate for the final June production.
This chart is also affected by Lea update that made a total upward revision of 48 kb/d to production between March 2023 to June 2023. As such, we will have to wait for the July update to see whether the June increase in the projection is realistic.
Findings
– The Lea County oil production forecast was affected by revisions that will delay making a call on how close it is to peaking.
– Eddy County oil production peaked in February 2024 but has now started a new increasing phase as it follows the uptrend in the rig count.
– Midland county peaked in July 2023
– Martin County is on a plateau prior to heading into its decline phase.
A note on assumptions. In the above charts of production vs rig count, the rig count has been shifted forward by 7 to 8 months and the assumption is made that production follows rig count. The underlying assumption for doing that is that no more or very few DUCs are being used. Also implicit in making the above calls is that the drillers and frackers are using the latest technology, i.e. 3 mile laterals, max proppant and chemicals and some refracs. I have no basis for assuming this assumption is correct.
Texas District 8
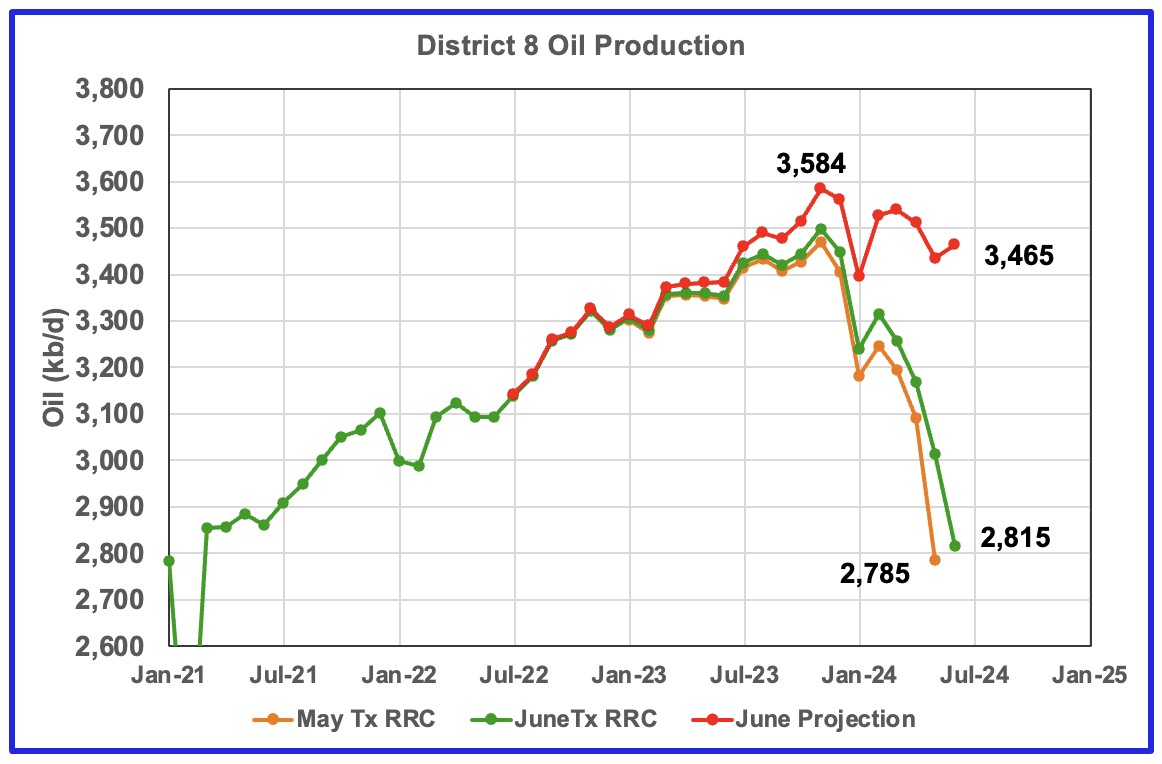
Texas District 8 has peaked.
Texas District 8 contains both the Midland and Martin counties. Combined these two counties produce close to 1,300 kb/d of oil. While these two counties are the two largest oil producers, there are many other counties with smaller production, Reeves #3 and Loving #4, that resulted in total production of 3,584 kb/d in November 2023. Essentially the Midland and Martin counties produce close to 1/3 of the District 8 oil.
This chart shows a projection for District 8 oil production. The red graph, derived from the May and June production data indicates that oil production in District 8 has peaked. For June production rose by 30 kb/d to 3,465 kb/d and is down 119 kb/d from the peak in November 2023.
The orange and green graphs show the production reported by the Texas RRC for May and June. Note that the last month in the June production graph is higher than the last month in the May production graph. This is why the projection shows June’s production is higher than May’s.
District 8 accounts for more than half of Texas production. With June’s preliminary production being lower than November’s 3,584 kb/d, it is difficult to understand how the EIA’s Texas production has continued to increase since March.
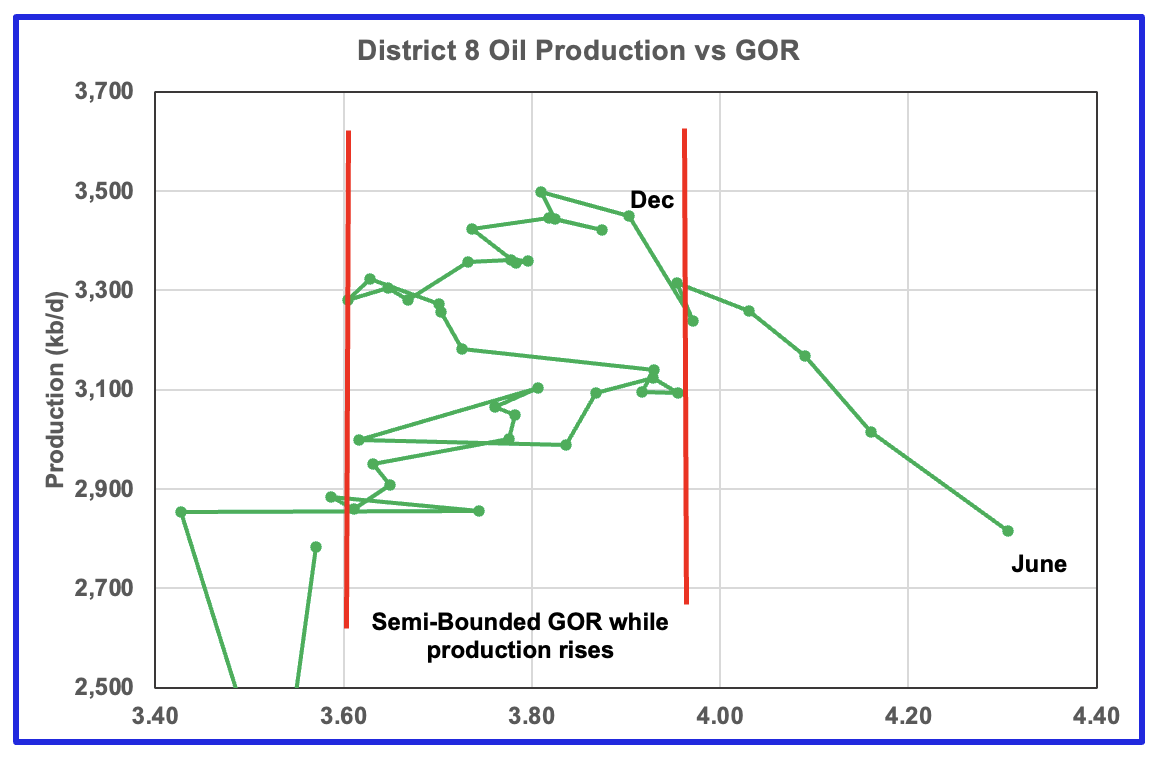
Plotting an oil production vs GOR graph for a district may be a bit of a stretch. Regardless here it is and it seems to indicate many District 8 counties may well be into the bubble point phase.
Drilling Productivity Report
The Drilling Productivity Report (DPR) uses recent data on the total number of drilling rigs in operation along with estimates of drilling productivity and estimated changes in production from existing oil wells to provide estimated changes in oil production for the principal tight oil regions. The new DPR report in the STEO provides production up to July 2024 and is the first report to update the DPR production data since the format was changed. The report also projects output to December 2025. The DUC charts and Drilled Wells charts are also updated to July 2024.
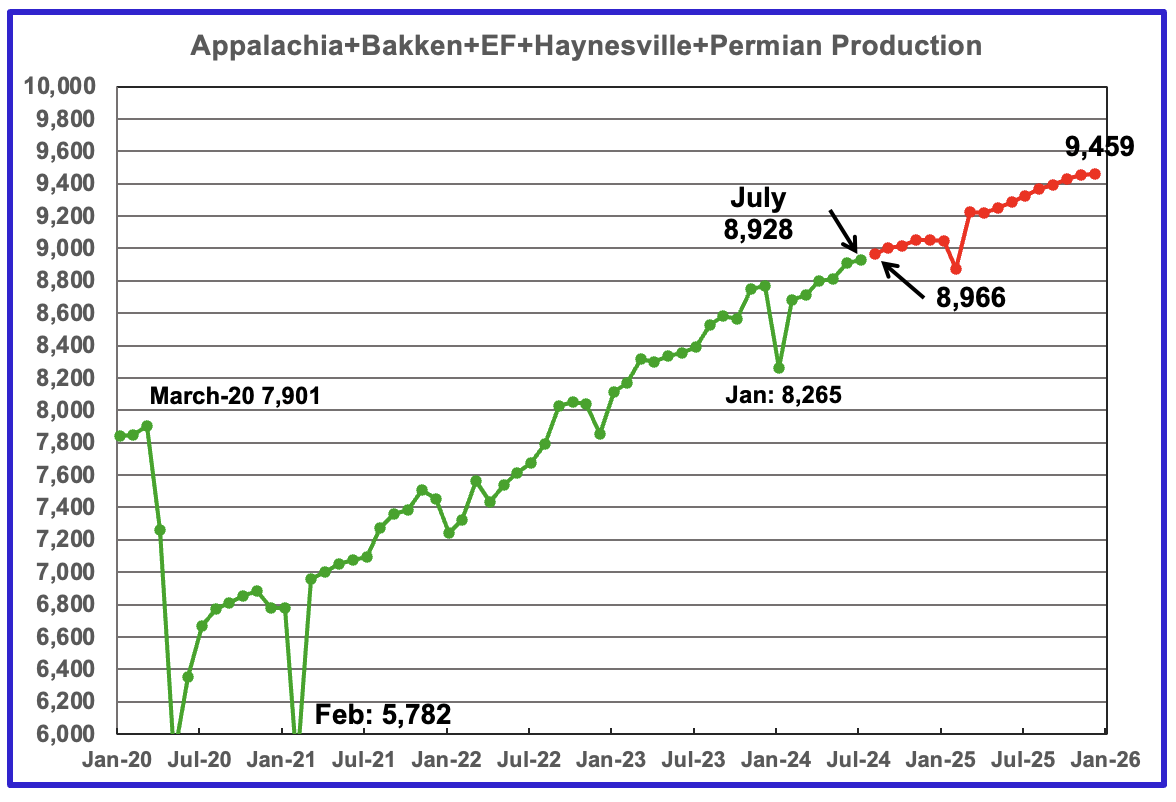
The July 2024 oil production for the 5 DPR regions tracked by the EIA is shown above. Also a projection by the STEO to December 2025 has been added, red markers. Note DPR production includes both LTO oil and oil from conventional wells. Production for the Anadarko and Niobrara regions is no longer available.
The DPR is projecting oil output in July 2024 for these five regions will increase by 16 kb/d to 8,928 kb/d. Production is projected to grow almost linearly to 9,459 kb/d in December 2025. This is 180 kb/d lower than forecast in the July report.
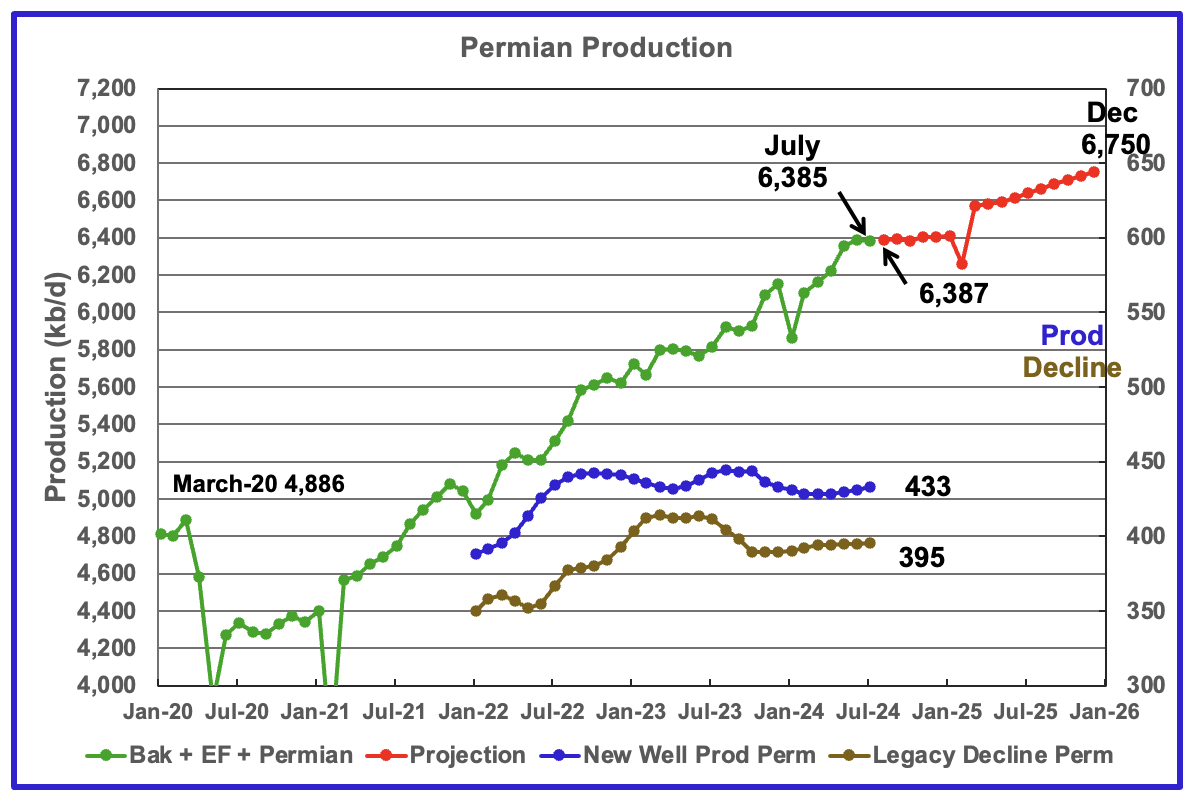
According to the EIA’s August DPR report, Permian output will be flat out to January 2025. It is expected to decrease by 5 kb/d to 6,385 kb/d in July. By December 2025 output is expected to be 6,750 kb/d, 144 kb/d lower than estimated in the previous report.
Production from new wells and legacy decline, right scale, have been added to this chart to show the difference between new production and legacy decline. For comparison, in the previous DPR report new well production was 443 kb/d, 10 kb/d higher than in the current report.
What is surprising is that production from new wells and legacy decline are different. They should be the same since production is flat? That has to make one question whether those numbers are correct?
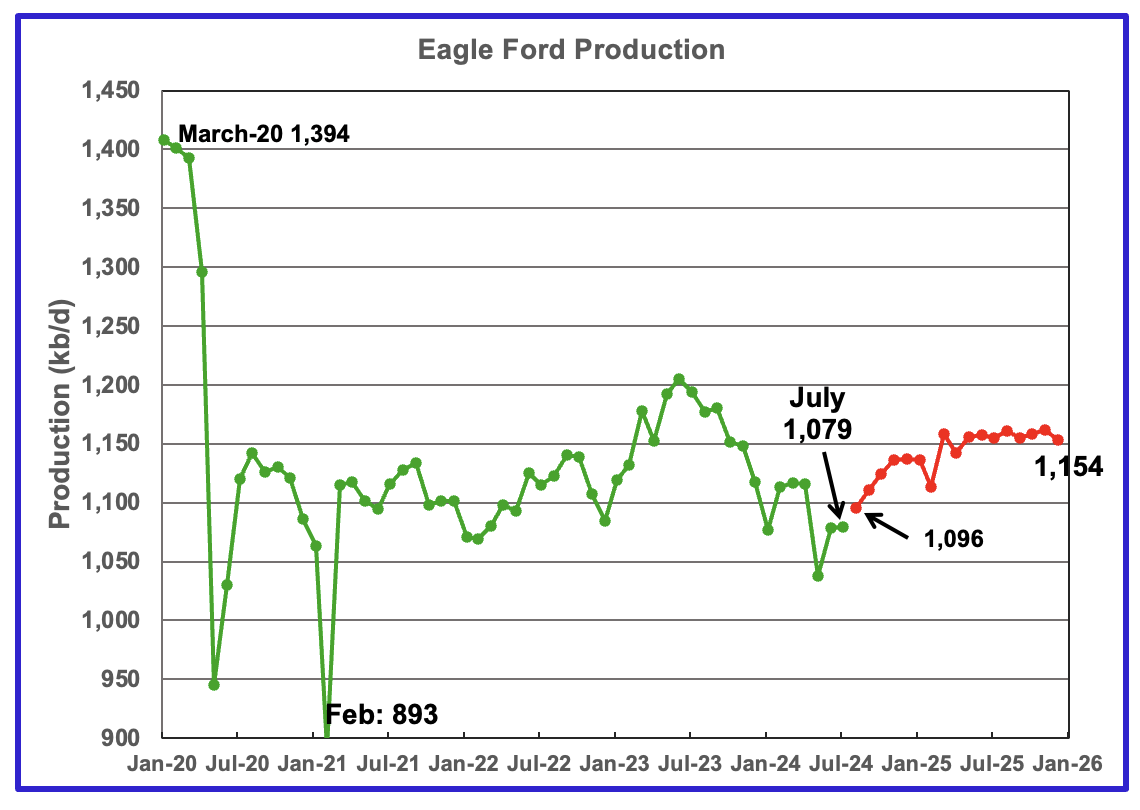
Output in the Eagle Ford basin has been declining since June 2023 but is expected to increase starting in August 2024. For July production is unchanged at 1,079 kb/d. However production is expected to reach close to 1,150 kb/d in March 2025 and remain there till December 2025. The red graph is a production projection by the STEO.
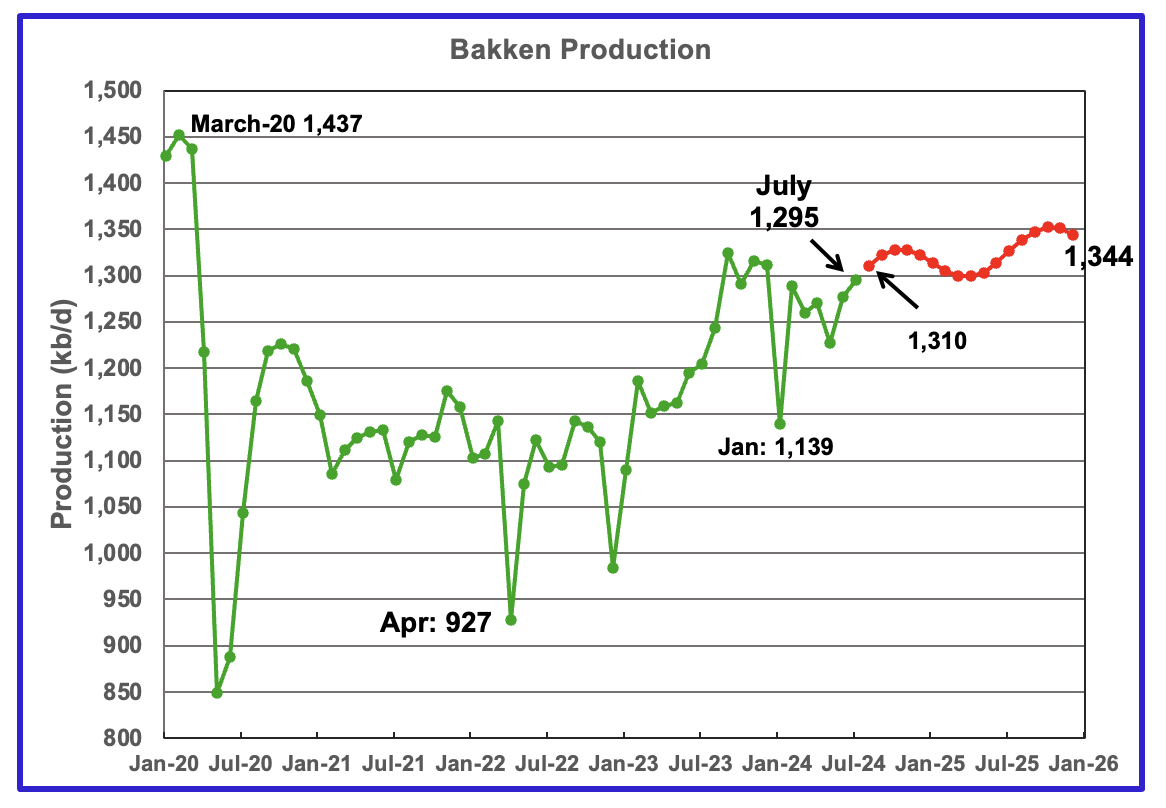
The DPR/STEO forecasts Bakken output in July will rise by 18 kb/d to 1,295 kb/d. The STEO projection out to December 2025 shows output varying between 1,300 kb/d and 1,350 kb/d over the next 18 months.
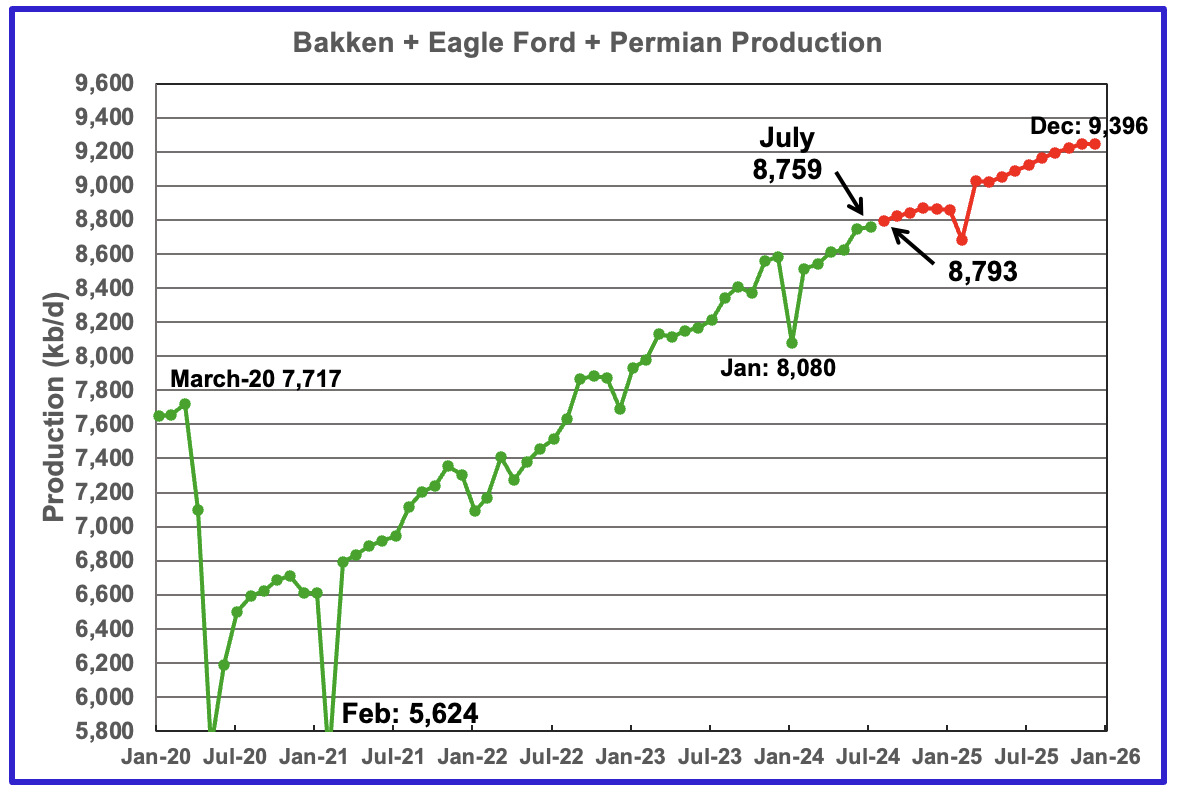
This chart plots the combined production from the three main LTO regions. For July output rose by 14 kb/d to 8,759 kb/d. Production in December 2025 is expected to reach 9,396 kb/d.
DUCs and Drilled Wells
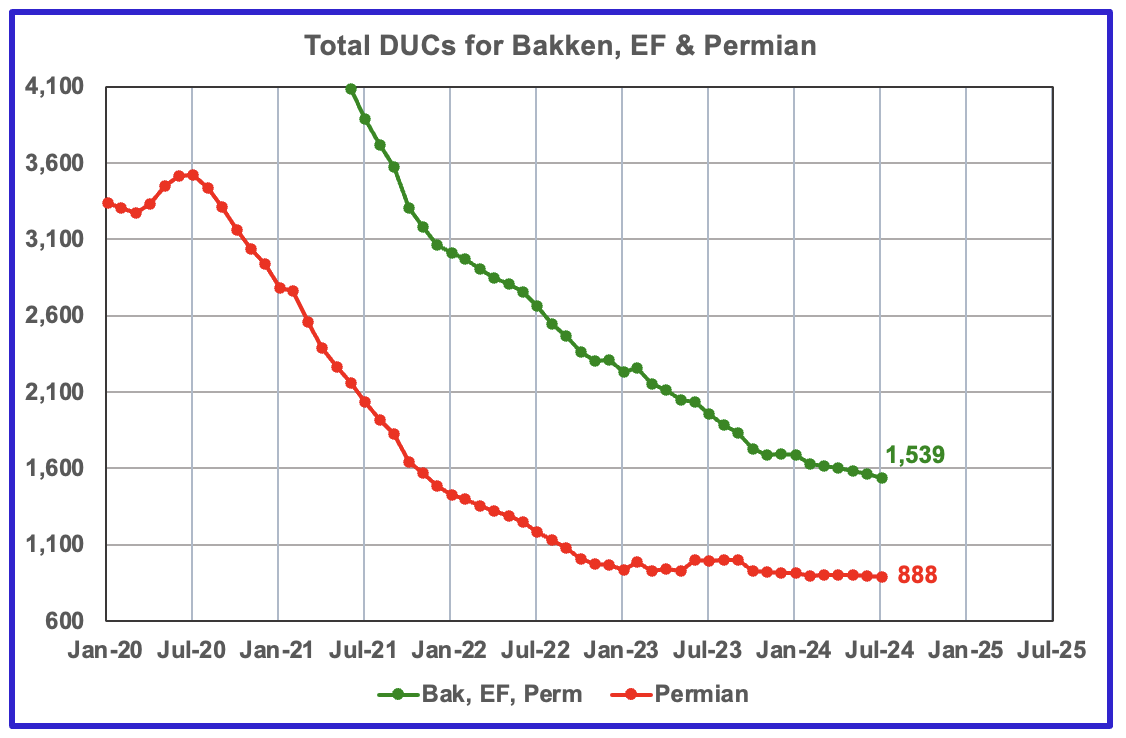
The number of DUCs available for completion in the Permian and the three major DPR regions has fallen every month since July 2020. July DUCs decreased by 22 to 1,539. In the Permian, the DUC count decreased by 7 to 888.
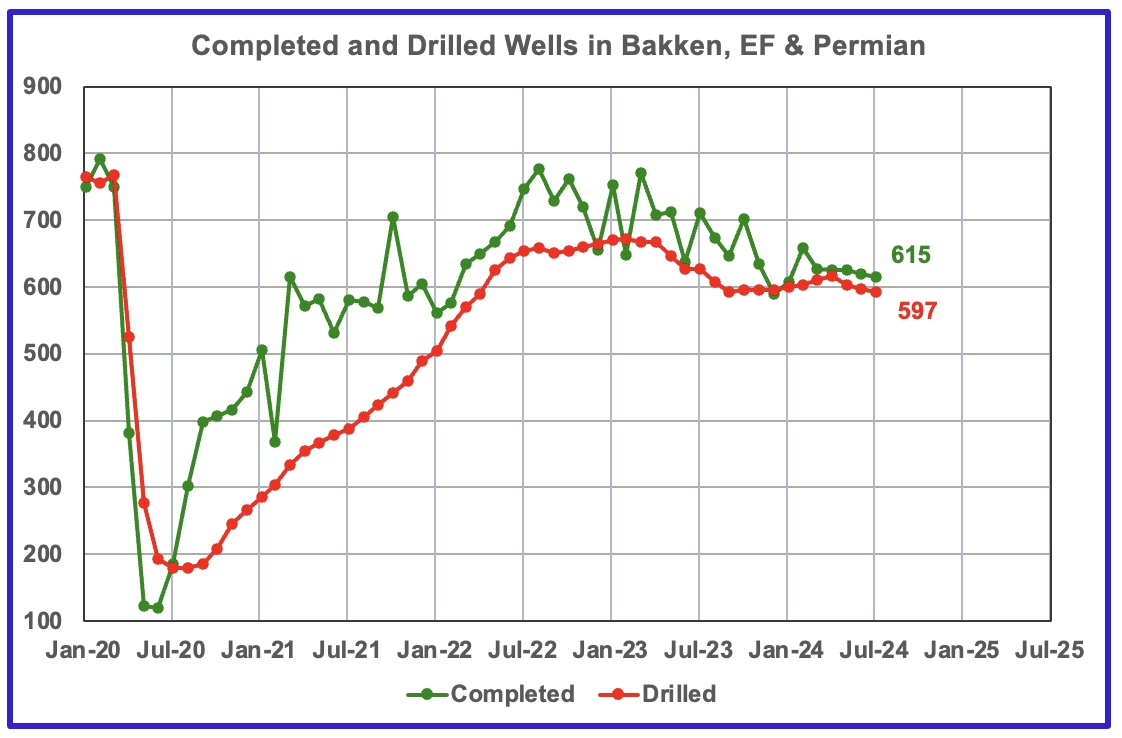
In the three primary LTO regions, 615 wells were completed and 597 were drilled. This indicates that there are still some profitable DUCs available.
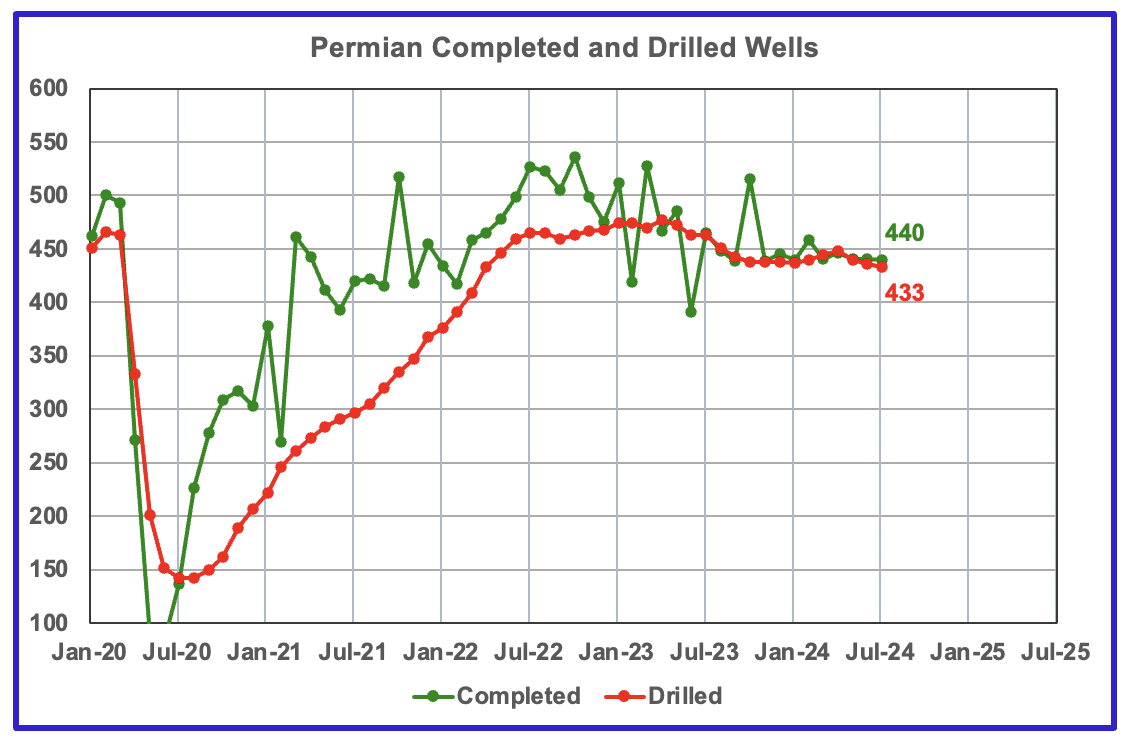
In the Permian, the monthly completion and drilling rates have been both stabilizing in the 430 to 450 range over the last eight months.
In July 2024, 440 wells were completed while 433 new wells were drilled. This is the third month in which the number of wells completed exceeded the drilled wells. Based on the DPR Permian chart above. it appears that these extra 7 completed wells are allowing production to stay on a plateau.
122 responses to “US June Oil Production Lower than November 2023.”
Harder to see the dark blue line forecast becoming a reality even with opec delay.
https://www.cnbc.com/2024/09/05/opec-members-delay-plans-to-hike-production-by-two-months-after-oil-price-slump.html
I guess time will tell…
It doesn’t materially change the trend, but I see differences in the numbers you are reporting for JUN2023, versus what is on the EIA 914:
https://www.eia.gov/petroleum/production/
Here is the 914 report and the first few lines of the table:
U.S. 13,214 13,189 0.2 12,866 2.7
Alabama 9 9 1.8 10 -7.9
Alaska 399 417 -4.2 423 -5.6
Arizona 0 0 0.0 0 29.6
Arkansas 11 11 1.5 12 -4.0
California 285 289 -1.5 342 -16.6
Colorado 450 453 -0.7 464 -3.1
The second to last tabbed column of numbers is the JUN2023 production, in the 914:
*US: You list 12,894 for the US. EIA lists 12,866. (Note this changes the YOY delta to 348, not 320 as in your text.)
*Alaska: 423 versus 423. (OK, matches, checks fine.)
*California: EIA says 342. You say 311.
*Colorado: EIA says 464. You say 462.
——-
I didn’t bother checking the rest of it. Probably there are more discrepancies. Either you are making a clerical error (maybe using an old data set) or EIA is misprinting. I suspect it’s you (no biggie), but either way, like to understand the difference.
Note: Also, I downloaded “Table 1” Excel file…it shows the same as on the EIA webpage. Not sure where you are getting the different JUN2023 numbers. (It’s not “Table 1”.)
Nony
I use the PSM listed at the top of the post. It only back corrects 6 months. For a few states, I download the back corrected data. So yes those year over year numbers could have errors.
I do back update the total US production numbers on a separate line. In checking I did reference the wrong line.
If you download the Excel spreadsheet on the PSM webpage (look in upper left corner of the page you linked), it has the current complete history, not just the last 6 months.
However, I highly recommend to use “Table 1” instead, as the organization is more convenient (alphabetized, etc.) and the numbers are the same as PSM spreadsheet and also have the complete, current history.
https://www.eia.gov/petroleum/production/ (click on upper right side Excel link).
Nony
I know where and how to access the data I need,
Nony,
Usually these numbers do not need to be updated each month, but at the annual update in August there is an update to older EIA data to match it up with state data. If you compare the 914 from July with the most recent 914, you will see the difference. Typically the numbers from a year ago won’t change significantly until the next Annual Update in August 2025.
https://www.oilystuff.com/forumstuff/forum-stuff/stick-a-fork-in-saudi-america
Stick a fork in Saudi America
Andre
Thanks for the link.
Big credit to OVI, Dennis and Ron P.
Mike Shellman is a legend and Amercian hero IMO!!!!
Ovi is killing it,
Dennis is doing great on a blog that wants to see him fail…but he has been right so far and an obviously smart and good guy.
Ron P (Darwinian) is a legend IMO. i Hope he is ok!
thanks mates!
Thx Andre
Thanks Andre. And I am okay for and old man. I have survived cancer… twice and hope to survive a while longer. But I must disagree with you. This blog does not want to see Dennis fail. I desperately want him to succeed. It is just that I have always seen him a tad over optimistic. But his projections have been getting a lot better as of late. He sees peak oil in the near future, and I see peak oil in the near past. One of us is correct and it really doesn’t matter which.
But that is not where Dennis and I really disagree. He sees renewables saving the world and we will just go on and on until …., well, just until. Renewables will never replace fossil fuel. We will eventually see a horrible collapse in about fifty years, or perhaps less. But this blog will be long dead if and when that happens. So, we will never know which of us is corret.
Hi Ron, I don’t think it’s that renewables will replace fossil fuel. I think it’s more like we will learn to live on renewables and a little fossil fuels. Fifty years from now, people won’t know what they missed. We will adapt. Fifty years, also probably a good number for what’s going to be forced on humans.
Take good care
“I don’t think it’s that renewables will replace fossil fuel. I think it’s more like we will learn to live on renewables and a little fossil fuels.”
As I see it this will be true yet I’ll add another big aspect to it- A big downsizing of humanity will occur during the remainder of century, one way or another. And 50 years to initiate this downsizing is decades behind the onset of this downsizing.
[I’d call them ‘non-fossil’ energy sources rather than renewables, since the collecting mechanisms are not renewable whether we are talking about nuclear power plants or photovoltaics, etc, even if the supply of the actual energy is in effect perpetual]
HB, of course we will adapt. Not willingly but we will have to adjust what is forced upon up. Our lifestyle will be totally different. There will be far fewer luxuries. There will be some oil left and that will be used for medicines and other absolute necessities.
Hickory wrote: A big downsizing of humanity will occur during the remainder of century, one way or another.
Yes, that will be the hardest part of all, living on a lot less food, food that was produced by fossil fuel. Less food automatically means fewer people. I don’t like to think about that. I try desperately to shove it out of my mind. I just got back from Denver Colorado and my grandson’s wedding. I hurt when I think about his and his children’s future.
Huntingtonbeach
I think it’s more like we will learn to live on renewables and a little fossil fuels.
These guys calculate that about 15% of fossil fuel consumption is for food production.
https://story.futureoffood.org/power-shift/
Of that 15%, only about 20% is for agricultural inputs and farm operations.
The other roughly 80% is for post harvest food processing, refrigeration, packaging and transport. This portion of the energy use could be reduced to considerable extent without loss of overall food production capacity.
Good stuff Ron
Mr Shellman is giving an honest professional opinion about America’s hydrocarbon future.
That is precisely what we need!!!!
I started following Ron on The Oil Drum, and the best compliment I can give is I follow him to this day.
Dennis is more optimistic than me, but I hope he is correct and he isn’t optimistic compared to the average earthling. I think it is always good to have someone challenge GROUP THINK if they are doing it authentically. And I think Dennis is!!
Ovi has converted me to a fan based on his consistent high quality work!! No more to be said.
Ron,
I think the World will be very different in 50 years, but I won’t be around to see it.
I don’t think renewable energy will save the world, but I think it may help, there are other problems besides energy which will require other solutions. Education will help with population and social progress. Fake meat will help reduce human environmental impact and allow more land for wildlife. Soil impact can be improved with better farming.
And I was so looking forward to theocracy!
“Come writers and critics who prophesize with your pen
And keep your eyes wide, the chance won’t come again
And don’t speak too soon for the wheel’s still in spin
And there’s no tellin’ who that it’s naming’
For the loser now will be later to win
‘Cause the times, they are a-changin’”
I had thought we would see Permian output start to plateau, but at least through June 2024 this does not seem to be the case. In the chart below I show Permian region output in two different ways, the simple way is the EIA’s STEO for the Permian basin region and the second subtracts Eagle Ford (EF) Region output from Texas(TX) and New Mexico(NM) combined C plus C output as most of Texas C plus C output comes from these two regions. The average difference in output over the past 2 years (July 2022 to June 2024) between the two Permian region estimates is 300 kb/d (this is output from the other regions in both Texas and New Mexico over this 2 year period. So far there is no sign of plateau, or maybe just a hint if you squint and focus on May and June 2024, but there are many periods for the past 24 months where there has been a 2 to 4 month plateau followed by increases.
Chart below considers US L48 excluding GOM minus Permian region output for past 24 months (July 2022 to June 2024). Since November 2023 output for this grouping has decreased by 320 kb/d.
Also took a look at STEO Permian projection and it seems quite conservative for Permian with a sharp break in July 2024 from the most recent annual trend(569 kb/d). The annual trend for the next 12 months for the Permian is 256 kb/d with nearly flat output through Jan 2025 as Ovi mentioned in the post.
For US L48 excluding GOM the 24 month trend from Jan 2022 to Dec 2023 was about 826 kb/d per year and the Jan 2024 to Dec 2025 estimate (with forecast after June 2024) has a trend of about 412 kb/d per year, so half the previous 24 month trend.
Seems fairly reasonable for L48 excluding GOM scenario.
The decrease in output from the non-Permian L48 exl GOM region has led to a plateau in L48 excluding GOM output since November 2023 (past 8 months).
More incorrect JUN2023 values:
1. NM: should be 1735
2. ND: should be 1160
3. OK: should be 435
4. WY: should be 266
5. UT: should be 157
6. OH: should be 82
7. LA: should be 93
8. FGOM: should be 1845
——
If you don’t want to download the Excel spreadsheets (fine with me, I just find that easier), then you can just look at the 914 report itself:
https://www.eia.gov/petroleum/production/
It is very similar to your report in terms of looking at monthly and yearly changes and the numbers you need are front and center.
Nony
I have found a very simple way to update the table.
Ovi, thank you, for your work.
Nony
Thanks. Much appreciated.
WTI below $70.00
There was a lot of comments on supply and demand being equal on the previous post but they’re not. Demand is a product of supply simply because you can’t demand what doesn’t exist.
Let me repeat you can not demand what doesn’t exist.
Our present energy mix is a function of opportunity. When Standard Oil was selling kerosene for lighting they had a lot of byproducts like gasoline that had no market. Henry Ford capitalized on the opportunity. The assembly line was a great innovation but it was built around an ICE engine that ran on a waste product.
As long as supply is growing demand will grow. If supply contracts demand will contract. A prime example was 2008 supply peaked in 2005 (conventional) prices shot to $140.00 and what happened to demand? This time we have a peak in all supply ( conventional unconventional) at 2018 our problem is the economy never recovered since 2008 so we’re unlikely to see another price spike. But what we are seeing is an overall contraction in business activity impacting demand and holding oil prices range bound around $70.00. And possibly falling.
Put simply the global economy is readjusting to smaller surplus energy. Commercial office space is a prime example. Disney World is another. Fast food is another. As the fat is getting cut away so is the employment they represent. So the general economy is shrinking as people work from home and vacation and eat at home. Larger problems are looming as critical mass is loss in infrastructure. Less energy consumption increases per unit cost. This principle holds true in every sector so that as economies shrink it drives prices higher. The brilliant economist read that as inflation not understanding it’s a supply side issue. Higher energy cost depresses economies that lose their operating margins which pushes unit prices higher which depresses the economy more and you end up in a depression with no way out.
This has happened before in 1927 when the world economy was primarily a coal economy and coal peaked. Had oil not been waiting in the wings to take over we never would’ve dug out of the depression. And it’s not going to happen this time because there is no next great energy source.
JT,
The problem with your overall argument in that World real GDP is rising. Low prices can arrive from excess supply or a lack of demand. The World economy is using less fossil fuel energy per unit of GDP and the trend continues lower. Demand and supply are not single numbers they are curves with quantity on one axis and price on the other, price adjusts when demand and supply are not equal at any given price. When there are imbalances between the quantity supplied and the quantity demanded at the current price level, the stock level of the good will change, increasing when there is an excess of supply and decreasing when there is excess demand.
Quantity consumed and quantity produced will both adjust depending on the price.
JT,
Do a quick thought experiment. Assume Oil supply is 100 Mb/d and demand is also 100 Mb/d in year X.
Now assume in some future year Y Oil supply is 100 Mb/d, but demand for oil has fallen to 80 Mb/d due to either an economic crisis, some new technology, it doesn’t really matter. The only thing that is important about supply in this scenario is that there is more than is needed, from the perspective of producers of oil demand for their product is very important.
Am I claiming that demand is more important than supply? No I am not. Both supply and demand for a good are important and one cannot measure the relative importance any more than one can determine which blade of the scissors is more important in the cutting process.
This argument has been around for 130 years at least. See Alfred Marshall.
Dennis
And for 130years economists have persistently got it wrong.That why it’s a dismal science.
GDP is not a measure of economic activity it’s a measure of transactions that actually masks real economic activity.
Imagine that the entire global economy was one big fat McDonalds and they decided to double the price of a Big Mac. Suddenly they have increased GDP by 100% with no increase in energy or product inputs. Yahoo the economy has decoupled from the energy supply. But let’s face it not everyone would or could accept that kind of price increase so sales suddenly decline 45% but who cares because GDP growth is still 5% . Now I’m really saving the world GDP is growing at 5% and my demand for beef has declined 45% saving the planet from catastrophic climate change by all the reduction in cow flatulence.
That’s what’s happening Dennis GDP will continue to grow as the real economy shrinks until it snaps completely from lack of affordability.
Add to it the economy is increasing debt at $3.00 for every $1.00 of GDP Ask yourself if you were a business how long would a bank let you borrow $3.00 and only grow your business $1.00 . No bank could or would but the general public seems to think everything is ok with that even though it’s being guaranteed through taxation. Right now everyone in the US has a $100,000.00 note attached to them. The same people who have less than $400.00 in savings and will be saving the planet buying $100,000.00 EVs. Of course subsidized to $30,000.00.
And add the fact that inflation grows GDP as I demonstrated above shows a complete lack of understanding what the worthless GDP matrix means.
JT,
Real GDP adjust for inflation, so in your example if prices doubled and output was unchanged (same number of burgers sold) then real GDP does not change.
It is the servicing of debt that matters, GDP is the same as income, a bank will grant a mortgage up to about 3 times gross income, this is a level that the debt can be serviced. So a debt to GDP ration of up to 300% is fine, for the World it is about 250% Debt to GDP.
“debt can be serviced. So a debt to GDP ration of up to 300% is fine”
Dennis is it really fine or ok to use this kind of thinking when critical pieces of economy are based on finite resources, and when considering other sources of under performance such as natural disasters, civil/geopolitical instability, or poor management?
An analogous scenario for a mortgage payer who is well qualified for the loan would be things such as illness/work disability, loss of job or decrease wage in their sector, divorce, etc. These things threaten ones ability to service the loan.
Is the bigger system really immune to being indebted to this degree? Is there some big insurer who backstops the whole carnival with unlimited real world collateral?
I have the sense that we have gone far out on the limb on this, which has enabled massive growth which far overshoots earths inherent capabilities to support.
I could imagine being wrong on this in a very well-managed system that had vast untapped resources out to the far horizon (centuries minimum).
Dennis
As you say a bank will lend 3 times income, they use that level because people have other expenses such as food and heating etc.
When people pay back the mortgage they do not just pay the interest but the debt also.
Many countries are struggling just to pay back the interest on their debt, the idea that The United States could pay back the debt is laughable. Why?
Because GDP is not the same as income, it is the same as gross turnover of a company and very different to net profit.
The percentage of debt to tax’s raised is far a better indicator of where nations actually are. The tax’s raised by a government is a much closer analogy to income.
When you look at those figures you start to realise how bad the debt is and why countries like the U.S. is getting further into uncontrolled debt levels. The U S can only repay the trillion in interest by borrowing it all and more. Total taxation for the bottom half of society is already high any increase will probably lead to mass riots.
This will not end well. Only a thoughtless optimist would think otherwise.
Loads of oil,
GDP is pretty much income. See
https://en.wikipedia.org/wiki/Gross_domestic_product
Excerpt for Income Appoach section:
The second way of estimating GDP is to use “the sum of primary incomes distributed by resident producer units”.[7]
If GDP is calculated this way it is sometimes called gross domestic income (GDI), or GDP (I). GDI should provide the same amount as the expenditure method described later. By definition, GDI is equal to GDP. In practice, however, measurement errors will make the two figures slightly off when reported by national statistical agencies.
This method measures GDP by adding incomes that firms pay households for factors of production they hire – wages for labour, interest for capital, rent for land and profits for entrepreneurship.
Hickory,
World real GDP per capita has grown at about 1.5% per year from 1980 to 2023, population growth is likely to slow over time, peaking in 2055 or so. At that point real GDP growth may slow to 1.5% (from current rate of about 3%) as population declines (after 2055) the rate of real GDP growth may slow, by 2150 or so it may fall to zero (depends on how fast population delines).
The fact is that debt by itself is not a problem, I agree there are environmental problems, debt could be used to solve some of those problems, much of that is a matter of education and political will.
Loadsofoil,
The Debt to GDP of 250% is total non-financial sector debt in the economy for government, households, non-profits, and corporations. The amount of government debt is just a choice by citizens on government spending and taxation.
If people want lower government debt they either want higher taxes or lower government spending (or some of both), they simply need to elect officials that share their views.
Note that I agree tax levels for lower income people is too high, I propose progressive tax rates like those in the US from 1950 to 1970, just adjust tax brackets for inflation. Maybe close some tax loopholes for the wealthy and tax capital gains and dividends like ordinary wage income.
I noticed that I misspoke and said the World is using less fossil fuel energy per unit of GDP, when in fact it is less per unit of real GDP in constant 2010 US$. This takes inflation out of the picture, World real GDP has been growing at about 3% per year on average long term.
Real GDP is an imperfect measure, but may be the best we have.
Fossil fuel intensity 1970 to 2023
I am going to put my neck on the line and make two prediction regarding oil prices which is sure to be wrong so take it with a huge grain of salt.
1) WTI will drop to around $67.5 and rebound back to ~ $90 in a few weeks.
2) It will continue to drop until some shale companies go bust again and or OPEC significantly drop production. Or we enter a global recession.
Iron Mike,
Sounds pretty reasonable. Impossible to know exactly how it will play out, my guess for oil prices right now is $80/b plus or minus $20/b, so similar ballpark/pitch to your guess.
My guess is certain to be wrong.
Dennis,
Looking at a few hints. It seems like investors think option 2 (recession) is more likely.
1) Weakness of USD vs Yen & Swiss franc implying investors looking for safety because of a recession or war.
2) Gasoline below $2. Implying demand weakness due to a downturn.
If the Fed cuts by 50 basis points the sharemarket will rocket back and hit all time highs, but it will make the USD plummet which might cause inflation to jump back up. Also it will put support behind oil prices and by extension gasoline. It is all conjecture but thats how i see it.
Iron Mike,
In the US the average price of gasoline is $3.39 per gallon (nominal price).
In the US at least inflation is likely to be well controlled and a recession does not seem imminent, lower interest rates are likely to help if the economy slows.
That is the way I see things at present. Sentiment of investors can shift very quickly, my guess is the Fed only cuts 25 basis points, though I personally think the smarter move would be a 50 basis point cut. The US labor market is cooling and inflation is close to target, 25 basis points may be too little too late, but I think Fed officials are very cautious and will opt for 25 basis points.
You seem to have given this much thought. I gave up long ago trying to predict the path forward for the economy.
Perhaps you will be correct.
Dennis,
You seem to have given this much thought. I gave up long ago trying to predict the path forward for the economy.
Hence you are wiser than me 🙂
Iron Mike,
I am only wise enough to know that I lack wisdom. You seem wise from my perspective.
Weakness of USD vs Yen and CHF is more of unwinding of bets of higher asset prices in the US.
Not really flight to safety. Money is being taken off the table because of the fear of assets prices peaking and not making new highs. People are locking in some gains. They are exiting some long positions.
It’s a sign that things aren’t good and are deteriorating. Just like falling oil prices are. Just like falling bond yields are.
I think a 25bp interest rate cut is already priced in and would actually let down the market. An a 50 would be seen as the FED panicking. Think it will be sell the news regardless of what they do.
Oil prices will head lower on what would basically be a no confidence in the economy vote by the FED doing a 50bp cut.
HHH,
Not long ago, a strong U.S dollar = weaker asset prices. Now USD and asset prices are correlating each other. Two of the only things that gained in last nights session (Friday) was Yen and CHF. Even precious metals sold off which are priced in USD so you’d expect them to rise.
This mixed with lower oil prices is a signal for an upcoming global recession. But it is all speculation on my part.
Dollar has been strong against other currencies. When you buy stocks, gold and even WTI futures contracts you are effectively shorting the dollar against said items.
So you can have rising asset prices. While the dollar is strong against other currencies.
The largest shareholder of each of the mag 7 stocks is Vanguard. Each and every pay period when money hits retirement accounts. Vanguard’s algorithm buys. It doesn’t care about what is going on around the world or in the economy. It doesn’t care about elections or technical analysis. Money is there it buys.
In order to get a sustained stock market sell off or crash. We’d need higher unemployment. Where people are having to liquidate their retirement savings in order to survive.
The dollar is a different matter however. Latest estimates are global debt levels of $315-$320 trillion. About $150 is denominated in USD. Most of it is short term debt that has to be rolled over within a year. So commercial banks have to be willing to create new money to roll these debts. Otherwise everything will crash.
We’ve seen oil prices and the dollar correlate. Because fewer dollars being created in the Eurodollar market lead to a stronger dollar. Lack of energy equals lack credit creation. Stronger dollar and higher energy prices.
Yield curve is un-inverting. As the economy continues to cool oil prices will fall.
I don’t see rate cuts doing much of anything. They are more or less just an acknowledgement that the Fed sees things aren’t so good.
Rate hikes took over 2 years to cool the economy because they didn’t really do much. And we are suppose to believe rate cuts will immediately stop any slowdown. I don’t buy it.
The economy is slowing and will continue slowing right into an official recession. Oil prices will grind lower and some days or weeks we might have big drops until this slowdown or recession is over.
HHH,
Higher interest rates did indeed cool the US economy and lower interest rates may keep the US economy from entering a recession, or keeping it mild if it occurs.
You have been calling a recession in the near future for a while, at some point you may be correct, can you give us your current estimate for when the recession will begin?
Dennis, I don’t need a recession to be officially called. It’s here.
Whoever you you vote for will have to oversee one of he worst recessions on record.
HHH,
According to BEA statistics Q2 real GDP grew at 3%. That is what we have so far. We will see if you are correct in Q3.
HHH,
According to BEA statistics 2024Q2 real GDP grew at an annual rate of 3%. That is what we have so far.
https://www.bea.gov/news/2024/gross-domestic-product-second-estimate-corporate-profits-preliminary-estimate-second
Excerpt:
Real gross domestic product (GDP) increased at an annual rate of 3.0 percent in the second quarter of 2024 (table 1), according to the “second” estimate released by the U.S. Bureau of Economic Analysis. In the first quarter, real GDP increased 1.4 percent.
The GDP estimate released today is based on more complete source data than were available for the “advance” estimate issued last month. In the advance estimate, the increase in real GDP was 2.8 percent. The update primarily reflected an upward revision to consumer spending (refer to “Updates to GDP”).
We will see if you are correct in 2024Q3. Current Nowcast for 2024Q3 is 2.1% annual growth.
https://www.atlantafed.org/cqer/research/gdpnow
Dennis,
Chinese GDP numbers still show positive growth too. I’m sure all is well in China.
HHH,
Thought you were talking about US as you were talking about Fed policy which mostly affects US.
IMF expects real GDP for the World to grow by 2.7% in 2024 and 2025( for market exchange rates). If we use PPP for exchange rates (as most international economists think this is the better measure) the annual growth rates are 3.2% in 2024 and 2025 for World real GDP.
As I said time will tell if you or the IMF prove correct. You have been calling for a recession for a long time, some time you will be right, kind of like the broken clock that is correct two times a day.
Oil price is now around key support level, give it a $ + or -.
Things are getting interesting here, perhaps with a new swing of the pork cycle. When the price falls now, investment will follow down. At 50$, which is in when the chart plays out like it looks, all the state oil companies that enabled the production growth of the last years will have a hard time with their finance minister to keep investments growing.
Recession and low oil prices will stall the energy transition anyway – no money to buy new toys, be it cars, trucks or new planes for airlines, everything will be postponed and the old stuff used longer.
It’s the economy. OPEC needs revenue. They’ll likely at some point open up the oil spigots as prices go lower leading to an even bigger move down in price.
WTI currently sitting at $65.70 It’s down 4.3% today.
Can gold then be a safe haven?
Excellent presentation OVI! Thanks for sharing!
I think the biig mystery is what is causing the EIA estimate 5730 KBPOPD for June 24 Texas oil production. The Texas RRC projected of 5587 is enough lower to make Texas’s growth near flat. Texas’s growth prospects should become more evident over the next quarter or two.
North Dakota Production has set some production milestones.
North Dakota’s first interim peak was Sept 2014 when Bakken produced 1182K BOPD.
With declining capex in 2014 production did not break 1200K BOPD until May 2018 at 1211K BOPD.
Alltime high was 1480K BOPD in Nov. 2019. As of June 2024 we are down to 1176K BOPD.
Nine years and 9 months later.
Link to novi analysis
https://novilabs.com/blog/north-dakota-update-through-jan-2024/
The EIA FAQ explains how they get their estimates:
https://www.eia.gov/petroleum/production/faqs.ph
The differences with RRC have been discussed/analyzed many times before, over the years. Both here…and elsewhere. It’s very well established that RRC’s estimate is bottoms-up, and (thus) systematically biased low (from late filings), which means over time, the RRC values are always revised up.
Texas has had a long time to fix the RRC reporting. If their system was half as reliable as North Dakota’s we would know a lot more about what kind of production to expect in the future. The flip side of that is it seems the correct information is probably out there from Enverus or someone who aggregates it and sells it.
Does anyone have a better idea of what Texas oil production will be for June 2024 after revision?
I think the 914 is pretty good. It’s an actual survey, so likely to catch turning points. Much better than the extrapolation methods of rrc info that the Russian Italian uses.
The paid services like ihs or drilling info or even enno are not so much in the state prediction business. They get paid for data or analysis related to more granular questions. Also their sources are mostly just rrc or eia anyhow. Although in a few cases they but data or form co ops with customers. Or even fly planes to gather intel. They are pretty good analysts though.
All that said, I still find eia good. And they update their series with corrections to more than a year old. So it is well curated. Very easy to download their excel. Rather than looking at psm for curated 6 months and ignoring older curating. Hint hint.
DCLonghorn,
EIA estimates tend to be quite good.
Texas has something like 400k wells for the RRC to track. North Dakota maybe 25k wells total, this makes the task easier in North Dakota.
Also they are very patient in Texas, no rush.
DC
Thanks. Much appreciated.
This month’s post regarding Texas and the four Permian counties required a lot of checking. The projection methodology used requires consistent incremental data from month to month. It turns out that the May Texas data from a number of counties and District 8 was under reported. The June data appears to be back to normal. The net result is that the June increments for the June RRC projection are higher than normal. The projection good up to March and then begins to diverge after March. Why?
I still think that Texas production for February to May is flat and that the company data collected by Enverus is optimistic. Considering how good the projection matches New Mexico’s production, it is difficult to explain why the methodology works so well with one state and not the other.
Hopefully next month’s data will be back to normal and provide additional insight to what is happening in Texas.
Ovi,
Not nearly as many wells to track in New Mexico as Texas so the job is much less difficult. At the end of 2022 New Mexico had about 18,827 oil wells, at the end of 2022 Texas had about 162,356 oil wells (over 8 times more wells).
See https://www.eia.gov/petroleum/wells/xls/appendix_c_2023.xlsx
The higher number of wells are more difficult to track.
Also note that the 914 survey has data reported directly to the EIA from the largest producers in the state which produce roughly 90% of Texas production.
Dennis
I just wonder how accurate the reporting is.
Ovi,
I was assuming you meant the 914 survey data and/or the EIA 914 estimate, if you mean the RRC data, that is not complete for many months (12 to 18 months), but the 914 estimates by the EIA have been very good for Texas and New Mexico from Jan 2015 to December 2022. See
https://www.eia.gov/petroleum/production/xls/comp-stat-oil.xlsx
and compare to RRC and OCD data from Jan 2015 to December 2022, use 914 estimate column rather than the EIA final estimate column which annually adjusts for changes in state level data, the 914 estimate column remains fixed two months after initial release (occasionally there are revisions for a couple of months as 914 survey data gets revised/corrected.) Since May 2023 the 914 estimates from Jan 2015 to December 2022 have not been revised (I have many older comp-stat-oil files saved on my computer).
Ovi,
The data from Jan 2015 to December 2022 was pretty accurate, (note that the 914 estimate used here is the 914 estimate and not the final estimate which just uses State data), this is compared with data from the RRC for TX and OCD for NM.
Also note that the EIA estimate is lower than the State data in 2023, so if it is inaccurate it may be a bit too low,
Texas 914 Survey data July 2022 to June 2024.
New Mexico 914 Survey Data, this looks like flat output from Feb 2024 to June 2024, unlike Texas.
Dennis
Attached is a chart that shows the four comparison sources that the EIA 914 report references for Texas.
Comparing the 914 survey with the 914 Estimate shows they are almost parallel. The latest months add close to 590 kb/d, roughly 10% to 11%. The Enverus data is very similar to what is posted above for the projected Texas chart for February to April.
Not sure how to interpret this data except to say that we will need to wait for the revisions.
Ovi,
If you look at the historical 914 estimate column and compare with the data directly from the RRC and OCD, you will find that the 914 estimate has been very accurate.
In my view it will continue to be very accurate.
Ovi,
Enverus combines data from RRC PDQ and pending lease report from the RRC, it remains incomplete. The 914 survey is data that comes directly from the largest producers constituting about 89% of Texas C plus C output, the remaining 11% of Texas output is estimated by the EIA.
Ovi,
Enverus combines data from RRC PDQ and pending lease report from the RRC, it remains incomplete. The 914 survey is data that comes directly from the largest producers constituting about 89% of Texas C plus C output, the remaining 11% of Texas output is estimated by the EIA. The non-914 survey output in Texas was up to 12% in early 2023, for recent 914 survey vs 914 estimate it is about 10%, so the recent EIA estimates may be on the low side rather the high side.
I agree with OVI. The last few months of Texas’s production increase (as per EIA) seem to contradict expectations. We have declining rig counts, declining fracs, productivity issues, negative gas prices at Waha, and June crude production volumes are up 93,000 bopd from April.
It will be interesting to see how Texas production rates change over the rest of 2024.
DCLonghorn,
We will see, the EIA has been very accurate in the past, the most recent 6 months of Enverus data for Texas tends to be incomplete.
Try downloading the compstatoil file from the EIA 914 report for a few months as I have been doing for several years and you will be convinced that the EIA data for the most recent 6 months reported for Texas (statewide) is far superior to that reported by Enverus.
Link is below for comp-stat-oil spreadsheet (this is updated each month)
https://www.eia.gov/petroleum/production/xls/comp-stat-oil.xlsx
Possible explanations for increased output are higher rig efficiency (more feet drilled per rig), longer lateral lengths, depletion of DUC inventory (more wells completed than spud per month), higher frac spread efficiency, more widely spaced wells, change in proppant per foot, change in number of stages per thousand feet. I do not have data on any of these variables (and no doubt there are a thousand other things I am unaware of).
In general expectations of the future are often incorrect, as we often assume variables will be unchanged in the future and usually this assumption is incorrect.
Here is a comparison of Enverus Data with the 914 estimate for Texas from 6 months ago, also note that on Ovi’s chart the January data point looks like December as the Horizontal Axis is not set up quite right, each data point in the spreadsheet is set up at the first day of the month rather than the middle of the month as it should be (I have correct this in my chart below).
914 for Texas from Aug 31, 2024 Compstat spreadsheet compareing 914 estimate with Enverus Data (data set up for mid month).
We are down to $64 at the well head here. Inflation has caused this to be equivalent to about $50-55 in pre-COVID $$.
Inflation has subsided in our field. But there is still a labor shortage.
It seems the economy is finally slowing due to higher interest rates, so I assume those will be cut soon.
Shallow Sand
If we had not had the relatively high oil prices compensating for inflation the last few years, this slack in prices would be a difficult proposition to envision imo. Bear in mind that both oil prices and the USD exchange rate went up substantially from 2022 for many oil producing countries not tagged to the USD. It would not affect very long term projects already in process most likely, but steam activity overall and give the green light to more projects starting in 2023-24 period.
If this situation is good or bad in the overall picture – circular argument. It is what it is.
The Rig Report for the Week Ending September 6
– US Hz oil rigs added 2 to 437 and are down 22 rigs from April 19. It is up 10 from 7 weeks ago and may be the beginning of an increasing trend. However WTI at $67.67/b may put a damper on more drilling.
– The Texas rig count was up 4 to 239 rigs.
– Texas Permian rigs rose by 4 to 194 while the New Mexico Permian was unchanged at 99.
– In New Mexico, Lea added 1 to 52 rigs while Eddy dropped by 1 to 46.
– In Texas, Midland added 3 to 23 and Martin added 1 at 31.
– Eagle Ford was unchanged at 41.
– NG Hz rigs dropped by 3 to 82, down 18 from 100 in March. (Not shown).
Frac Spread Report for the Week Ending September 6
The frac spread count dropped by 2 to 220 and is at its lowest level in 2024. It is also down by 32 from one year ago and down by 52 spreads since March 8.
For the less math inclined, how much would the yield per spread need to rise to cover the lover amount of them working? Eg from 2022 to 2024?
A tall order to solve with several moving parts but an executive summary would be interesting, alas no position for me.
Thanks for the great work!
Laplander
A tall order indeed made more difficult because we don’t which spreads are for oil and which are for gas.
Which Organization’s Prediction is Better
Opec+ members delay output increases to December
OPEC + was supposed to increase production by 180 kb/d in October but has now delayed it to December. The original plan was to start increasing production in October because OPEC was betting on increased demand in H2 from China and India. The IEA said demand will be a lot less than OPEC was forecasting. Since the balance between supply and demand in the oil market shows up in the price of WTI and Brent, it is now pretty clear that there is an over supply of crude in the market. The price action says it all.
“The delay to the output increase came as Atlantic basin benchmark North Sea Dated fell close to $75/bl on 5 September, its lowest since December, on concerns over oil demand in China and the US. Beijing imported 1.3mn b/d less crude in July than June, taking its monthly tally of receipts down to 10mn b/d, the lowest in nearly two years. The oil price drop has not taken place in isolation, JP Morgan says. “Alongside commodities, US 10-year treasury yields have tumbled (-70bp) and the US dollar index came down by almost 2pc, signalling a shift in the assessment of macroeconomic risk in the US and globally.”
Note that the article shows August OPEC production at the end.
https://www.argusmedia.com/pages/NewsBody.aspx?frame=yes&id=2605947&menu=yes
Ovi,
The delay in OPEC increasing output (if correct) seems to suggest that OPEC does not believe their demand forecast for 2024. To me the IEA or EIA demand forecast seems more realistic (IEA is lowest, OPEC is highest, and EIA is in between and the closest to reality in my view).
The Whole Story
I wonder if the deep high pressure Chevron work in the gulf that Ovi highlighted
will help develop increased capability of the Deep Geothermal Industry to harvest the perpetual energy of the hot interior?
Fervo Energy and Sage Energy are two domestic players to watch on this.
Hickory
The Chevron well is into sandstone. I wonder how many places on earth one can drill down to 10,000 feet and not encounter rock.
I am scratching my head about that one OVI. I really don’t understand your question.
It is rock, nothing but rock, all the way down. Just different kinds of rock.
Ron
Maybe I should have said sedimentary rock or soft rock. Since it is porous to contain the oil, I assumed it was softer than other types of rocks and readily drillable, I.e the 15,000 ft wells are drilled 15 to 20 days.
I used to work in a Gold mine and on occasion I would see the men drilling blast holes following the gold vein using diamond tip rods. That looked like very hard rock. Maybe I got the wrong impression.
Oil and gas is produced from sedimantary rocks which were formed by weathering of igneous rocks. Sedimentary rocks are relaticely soft. and are layered, and can consist of weathered (sandstone) and precipitated rock ( gypsum and salt). Under the sedimantary rock is hard ingeous rock, often referred to by oil and gas prospectors as suitcase rock (basement rock). Igneos rock is very hard (granite and similar types) and are much harder and more challenging to penetrate.
Abioitic oil is claimed to be formed in igheos rock but has never been proven.
Geothermal energy will need to be produced from deep basement rock. The cost of drilling the injector and producer wells will determine if it is viable- I have my doubts because what is required is high pressure superheated steam.
“Geothermal energy will need to be produced from deep basement rock. The cost of drilling the injector and producer wells will determine if it is viable”
Yes, cost will be thing to watch and it will probably take close to a decade to see how the companies pioneering the next stage of this industry do with production and cost of energy produced. Will the energy produced be cost competitive with other baseload energy production in the 2030’s and beyond, and will production be viable at much wider geography than prior geothermal installations?
Unlike Carnot I am more optimistic on the outlook for this.
If economic viability pans out this industry will be able to ramp up much faster than nuclear power production.
Example of some the recent news in this sector
https://jpt.spe.org/fervo-energy-inks-worlds-largest-geothermal-power-purchase-agreements-with-southern-california-edison
https://www.canarymedia.com/articles/geothermal/sage-geosystems-and-meta-sign-150mw-geothermal-power-agreement
Just out of interest, I pulled the year old and two year old PSM and looked at TX production and how it was revised later. That is, was the initial estimate too high and revised down? Or the reverse. Or stable.
JUN2023 got revised up 0.4%. That is the current value for JUN2023 TX production is 0.4% higher than what EIA said when the data first came out (end of AUG2023, PSM). So, it was the opposite of EIA being too optimistic. They were too pessimistic.
JUN2022 got revised up 2.0%. That is the current value for JUN2022 TX production is 2.0% higher than what EIA said when the data first came out (end of AUG2022, PSM). So, it was the opposite of EIA being too optimistic. They were too pessimistic.
Of course this is just two data points, so I certainly don’t claim any consistent EIA bias (or even EIA accuracy). And certainly it’s absolutely possible that the latest TX datum might get revised down in the future. But…it also might get revised up. 😉
Nony,
On average the EIA is a bit pessimistic, on average about 0.17% too low from Jan 2015 to Feb 2023 for Texas C plus C. Mostly they do pretty well on their 914 estimate. I long ago decided the EIA estimate is pretty darn good and there is no need to try to find a better estimate.
For Ovi and DCLonghorn:
An old but good explanation of why RRC time series tend to make EIA look suspiciously high. This has always been the case. It happens when TX production is increasing. Or decreasing. Or flat. RRC will always give the appearance of a “peaked production that EIA is missing”.
https://www.eia.gov/todayinenergy/detail.php?id=35492
Also, for Ovi and DCLonghorn:
There’s been a long history of people looking at RRC data and thinking TX had peaked. When it hadn’t. Instead it’s just an artifact of the RRC data revision method.
This is a 2014 (!) article on this site,
https://peakoilbarrel.com/texas-rrc-monthly-update/
Note the incorrect Ron Patterson assertion:
“Now I know most will say that the RRC data will be revised upward. Yes it will but I think most revisions after the first month will be negligible.”
Note also, in thread commentary, two commenters “Dennis” and “Nony” trying to persuade Ron the error of his ways. Whoever those two guys were, looks like they knew what they were talking about. 😉 To his credit, I think Ron eventually learned the issues with RRC data. But we still get new people drawn moth-to-flame to the peak-y appearance of the RRC time series and thus questioning recent EIA TX data.
Note also that the 2014 POB article refers to an even earlier 2013 article by Roger Blanchard making a similar assertion to what Ron Patterson made (i.e. playing up the RRC to EIA difference).
https://www.resilience.org/stories/2013-03-19/commentary-texas-and-eagle-ford-where-the-action-is/
But even at the time of the 2014 POB article, enough revision had occurred so you could see the problem with the 2013 Blanchard article. I.e. The Blanchard article was already a cautionary tale, that should have informed the 2014 article. Rather than being GMTA, it was a good case example of why you can’t trust recent RRC data. (As the 2014 POB article is a cautionary tale to inform recent Ovi/DCLonghorn comments.)
FWIW, the conclusion of the Blanchard article is very strong:
“To place current Texas oil production in perspective, peak production for Texas occurred in 1972 at 3.57 mb/d. Texas will never again reach a production level remotely close to that value.”
Hmm. 😉 Hmm! 🙂
Now…what’s really interesting to me about the Blanchard piece is that I have scanned the web and never seen a retrospective by him, showing that he was wrong about TX. And that he now understands why RRC data looks different than EIA. It’s OK to be wrong. But you should learn from it. Blanchard is even a physical scientist (teaches chemistry). But I can’t find any evidence of him learning from his old hypotheses failing.
———-
Also, FWIW, the problems with the RRC, in particular, was one of the major drivers to EIA implementing the “expanded 914” process in AUG2015. This process involves a substantial amount of work by both the industry and by EIA and involves a direct survey (not a model) for 90% of production volume. So, people kerfuffling about EIA and RRC now, are kind of ignoring a very big and laborious process that EIA installed to improve data quality. I guess sometimes you just can’t win. 🙁
Anonymous, your link quoted Nomy quoting me. I was unable to find the quote where I actually said that. If you wish to quote me, then please quote me, not someone else quoting me.
Hey Ron,
The quote is the seventh overall paragraph of your headpost article. It is directly under your third chart.
ANY
Thanks for the links. Mr. Blanchard had no idea he was looking at the front end of a shale oil production boom of at least 6 million bopd and comparable amounts of condensate and gas. We have much better information about all that now. I agree the EIA seems to be the most reliable information source available. It still doesn’t look right to me. I’m looking forward to see what the second half of the year brings.
Yes and no.
Blanchard wasn’t writing in 2004. The Bakken was already a major splash and had eclipsed the naysayer articles by peak oilers. E.g.
http://theoildrum.com/node/3868
And then the Eagle Ford was already a big deal by 2013.
FWIW, Blanchard seemed to be from the old trend of peak oilers who criticized EIA for being too optimistic. When actually, they were too pessimistic!
But of course (OF COURSE!) the worst is that he didn’t examine his old predictions, comments and write a retrospective. I don’t need him to wear a sackcloth and beat himself. Really. I don’t. But no curiosity? No learning? Just shifting the goal posts and not discussing his old predictions? I have a problem with that. A major problem. Especially when it is someone smart enough to teach community college kids about limiting reagents and two unknowns stoichiometry problems!
Nony,
Does the EIA do retrospectives on why their forecasts have been wrong in the past?
Generally predictions of the future are wrong, reasonable people realize this.
When Blanchard wrote his piece in March 2013 this was the EIA’s forecast for tight oil From AEO 2012 published in the summer of 2012(reference case and High TRR case). I missed the retrospective from the EIA on how they got this so wrong.
Perhaps Mr Blanchard was looking at the EIA’s Annual Energy Outlook 2012 and guessed that they were roughly correct (they weren’t).
Chart from
https://www.eia.gov/outlooks/aeo/data/browser/#/?id=14-AEO2012®ion=0-0&cases=ref2012~htrr12&start=2009&end=2035&f=A&linechart=~~ref2012-d020112c.10-14-AEO2012~htrr12-d050412a.10-14-AEO2012&ctype=linechart&sourcekey=0
Also in 2012 The EIA’s High TRR case was focused on mostely the Bakken/Three Forks, so by March 2013 most people wer not focused on the Eagle Ford, Permian, or Niobrara, all eyes were on North Dakota and Montana for tight oil in those days.
There may have been an early release version of the AEO 2013 released in December 2012 with higher tight oil is I have the chart below from a blog post in December 2012
https://oilpeakclimate.blogspot.com/2012/
At this point the EIA was forecasting a tight oil peak in 2020 at 2810 kb/d and forecasting average annual tight oil output of 2000 kb/d in 2012. That is about 6700 kb/d less than 2023 US tight oil output, so DCLonghorn’s comment about the front end of a boom of over 6000 kb/d seems spot on and the EIA for 2023 was forecasting 2690 kb/d for tight oil in 2023 almost exactly 6000 kb/d too low.
Also note that nobody was talking about the Permian Basin in 2013, it was all about the Bakken and Eagle Ford. See
https://oilpeakclimate.blogspot.com/2012/12/quick-update-to-tight-oil-models.html
Excellent points Dennis. Your annoying reasonableness has always made you my hero.
DCLonghorn:
(Responding here to the “why did TX go up 93M in two months”. Upstream reply chain no longer allows new branch replies.)
Dennis had some great points to consider, but I would add on (sorry if there’s some duplication, but my thoughts):
1. DCL, you can’t make “too much soup off of one onion”. You’re picking an individual, short, change and saying it’s unrealistic. Now, in a sense, you have a point. I don’t expect to see a 558,000/year change for TX (6 times two months delta). So, if someone were running around extrapolating that, you’d be right to caution him. But that also doesn’t mean the JUN24 datum was flawed. It could just be the normal jitter/noise that the time series has.
Basically, you are just zooming in too close, to make a rate of change determination. A cornucopian extrapolating that change would be wrong. But also, you are wrong to look at it and then think the JUN24 datum is EIA fishiness. It’s just some noise!
Consider also, that TX production had a big drop in the winter (look at the NOV23-JAN24 change). That doesn’t extrapolate either! And some of the growth we’ve had since then is probably just natural recovery from a winter upset. I mean NOV23-JUN24 is only up 72,000, and taking seven months to do so. So is the JUN24 datum really so fishy, or reasonable?
Now, OK…I cherrypicked NOV23. To make a point. But if we just look at the YOY change, JUN23-JUN24, we have 192,000 increase in twelve months. Again, a longer trend, makes the JUN24 datum look much less fishy.
2. Don’t overplay the rig story.
a. Production doesn’t drop just because rigs went down. Nor does it go up because rigs went up. What matters is if the rigs are above or below the amount required to compensate for decline. The EIA DPR shows this well.
For a thought experiment, imagine you had a country, “Austinia”, that needed 100 rigs to compensate for its base decline. With 100 rigs, there is zero change in production rate. Anything over 100 and production grows. Anything under and it drops. [For the sake of this experiment, ignore differences in rigs/locations or changes over the years, or lags between drilling and POPing (placing on production).]
Now, say, we started with 150 rigs and dropped 10, going down to 140. Does production drop in Austinia?
No. Rate of growth drops in Austinia. But NOT production itself. It will still grow. Just not as fast. Because you are still above equilibrium.
The same thought experiment applies if you were at 50 rigs and went to 60. Production would still drop in Austinia…just not as fast. Because what matters is rigs versus the threshold requirement, of 100.
b. In the real world, not Austinia, rigs are NOT all identical. So if we drop 10% of the rigs, the efficiency will increase from high grading. They are going to get rid of the crappier rigs. And even more importantly, they are going to stop drilling the crappier locations! Now, true efficiency gains take years (learning to drill better, changing the fleet to higher horsepower, etc.). (And efficiency losses, for example “running out of sweet spot” also take time.) But high (or low!) grading is almost immediate. We have seen it with every single price crash/recovery. So, yes the rigs do get “more efficient” when we drop rigs…because we high grade.
Of course, overall, it’s still worse for production growth to drop rigs. Even crappy rigs/locations have some positive benefit. But if you drop 10% of rigs/locations, it’s not really like a 10% reduction in the “effective” rig count. It’s maybe a (I donno) 7% reduction in effective rig count.
So…just be aware when you look at rigs and they are half of what they were during a boom, it’s really not like losing half of the rigs. Imagine you had 10 POB commenters digging a ditch for you. And you dropped five of them. Sure, less work would get done. But it’s very different if you drop the worst ditchdiggers, from if you drop five at random. Maybe the work goes down to 70% of what it was before. Not 50%. (This is called the Pareto effect.)
c. DUC drawdown or buildup can also confound the rig story. We see this frequently on the EIA DPR for example. This is on top of high/low grading in terms of locations/rigs.
d. You can’t look at recent rig changes or even APR-JUN24 rig changes to understand the APR-JUN24 production story. You probably need to go back 6 months, from APR-JUN24, to see how rigs changed then. (Now this may still support your point. But just cautioning you, to check.)
Nony
“What matters is if the rigs are above or below the amount required to compensate for decline. The EIA DPR shows this well.”
Did you see my comments in the DPR section of the post regarding decline and production. I think their numbers are wrong.
No. Honest, no. I will go look now!
🙂
1. OK…I looked at it. Yes, I think new production should equal decline, if production is flat. (I assume this is what you were asking me about?)
2. I really don’t understand the “new DPR”. I didn’t even know they had changed it, until just now. So, not sure if I can help you.
3. What exact spreadsheet or webpage are you going to, to get the green/blue/brown Permian DPR numbers from? And what line/part of it? Not accusing, but would just let me check if there’s a transcription error. Again, I don’t know the “new DPR”.
4. Looking at the STEO, table 10a, they talk about “one year trend”. Not sure what that means. But it could be the source of the discrepancy if inputs are trended and an output is not.
——-
Edit:
I think it’s essentially point 4. If you look at the STEO spreadsheet, tab “10atab”, cell B94, they have the following text:
‘(c) The sum of “Production from Newly Completed Wells” and “Existing Production Change” may not equal the month-over-month crude oil or natural gas production changes reported in tables 4a and 5a, respectively. This discrepancy arises from the statistical smoothing techniques applied to aggregated basin level data, variations in data imputation methodologies, and utilizing different data sources.
Addendum. Also, you can see previous months where there’s a big drop and it does not correspond to decline greater than new oil (lines crossing). Like around JAN24 (maybe that’s NOV23-DEC23), there’s a big drop in production. But the lines don’t cross. So clearly something is going on with the “year trend” smoothing or maybe revisions or something. It’s not the “new oil minu base decline = production growth” simple story of the old DPR.
FWIW, I actually don’t really care for the DPR as a predictive instrument, so much. What I like is the explanatory concept, highlighting the fight of base decline versus new oil. But the actual numbers, time series? Meh. Rather just look at the 914 state results.
Dennis and ANY
Thanks for the links and discussion. Perhaps in my rabbit hole sleuthing I have lost sight of the forest while examining the trees, won’t be the first time.
I do have a few more things to consider though. In the state of Midlandia, there were about 350 rigs running from May 22 to May 23. From June 23 to November 23 they cut back to around 300. From Dec 23 to now we have lost 25 more. We are now at 274.
My guess is we need around 300 to just maintain.
We have been through a round of acquisitions where many smaller operators have been taken over by larger companies. For example Exxon bought Pioneer. Pioneer was known for being ahead of the pack in many ways, Exxon represents more of the middle. Pioneer ( now Exxon) has laid off much of their E&P group. Will newco do better than Pioneer? I doubt it, even with Pioneer’s acreage. There are many factors which effect which rigs keep turning and which ones get stacked. Who the operator is and what they are drilling is in my opinion more important than which rig. Many of those recent drops have been takeover related. The last 25 rigs may have been some of the highest producers, we really don’t know. As far as the rigs themselves if you look at the drillers they seem to have high spec rigs and crews to spare so at this point the remaining rigs should all be pretty effective.
Where are those rigs drilling? In Texas they have slowed down in Midland and Martin which are generally considered the basin core because those counties are increasingly crowded. Ovi has an excellent graph above showing the move.
So here we are with declining target quality, less wells and more production.
I admit that I am waiting and watching for the turn, but I harbor no grudge towards the industry, It provided a living for me when I was younger and introduced me to wonderful oil towns like Austinia, Midland and Artesia.
Curtailments due to negative natural gas prices at WAHA should be keeping volumes down in both Midlandia and Artesiania. The Matterhorn pipe is in the process of being put in service which will allow another 2.5 bcf/d out of the basin. I expect us to pick up some associated oil or condensate on both sides of the line when Matterhorn starts regular flow.
Excepting a lucky guess, all models will be off, because of the unpredictable. Right now the associated gas in shale oil is rising more than expected, faster than expected. The 3-mile laterals are creating a new bubble, as IP24 is off the charts crazy but decline is sharp and severe. It is harder to find and more expensive to produce black oil, which is what the United States desperately needs–only a few rigs are drilling for API 30 and geologists who know anything about oil-rich sandstone seismics, patterns of migration, comparisons to established wells, and a downthrown from an upthrown fault block are all about seventy. This old world of black oil is a prelude: we are in for an equally disturbing deterioration in LTO dynamics when the 3-mile laterals are galloped across. At some point everything becomes a stripper well. The Petroleum Club gets smaller. Mojo goes down the Moho.
And then what? It’ll be time to guess about the refracking boom. That is the absolute last hurrah, right? Drop a steel ball in the toe, carefully line up packers over the previous fracture sites, then pressurize the wellbore to expand the packers and hit the areas in between with a lot of sand and water and whatnot. That’s going to work great in some wells, poorly in others (at the same cost of $3-4 MM, I might add). Right now we haven’t a clue if it’s going to be a boom or a bust. My personal model says it’s a bust, except where the reservoir pressure has been preserved and the shale is laminated enough for transverse fractures to extend far into the rock (~10%).
And then what? Well, at the end, I’d guess that lots of CO2 will be injected down the old wellbores as part of a massive government subsidy for carbon sequestration. That CO2 will be a stimulant in some wells and they’ll crank back to life for a while. But most won’t–just a guess. And then it’s plug and abandon time. By then, the way it’s going, that’ll cost a half million to a million a hole, and there will be a lot of them.
Unfortunately, this is happening domestically in America when decline is also apparent in Russia and the KSA. In fact, OPEC is having trouble as a unit. At some point, despite all efforts at obscuration, it will come out that the whale owned by the House of Saud is in dire straits, and that the infrastructure in the Siberian Traps is sinking into the mush.
Then there will be twilight in the desert. Global repricing. Shortages. Panic. Or is this prediction wrong too?
Gerry,
Could be right, unless demand for oil drops faster than supply, in that case there is either no panic or perhaps less panic, depends on demand relative to supply. Difficult to predict either supply or demand for oil in the future accurately in my opinion.
New pipeline capacity is expected soon in the Permian with more to arrive in 2026 to 2028.
https://www.eia.gov/todayinenergy/detail.php?id=63044
Coyne: Difficult to predict either supply or demand for oil in the future accurately in my opinion.
Precisely my point regarding the models. I admire the models, but I have no idea how to interpret them in any way to a) make money, or b) prepare for the future. I’m a big fan of natural gas, and relieving the pressure on the WaHa Hub will help. But did I mention the gigantic produced water cut in some of those wells? The biggest thing on Zoom these days are meetings on where to put the next covey of SWD wells so they won’t get shut down when the earthquakes begin. To state the obvious, this is a massive industry with a whole lot of variables.
Gerry,
Maybe the water can be cleaned up and used for fracking and then recycled again? Probably expensive, but so trucking and then disposing of water. It may be that it becomes so expensive that tight oil is no longer profitable to produce.
Oil tanks 4% to lowest level since 2021 on weak demand
WTI: $65.66/b, -$2.83/b
Oil resumed its downward trend on Tuesday, tanking more than 3% after oil alliance OPEC lowered its demand growth forecast in 2024 and 2025.
On Tuesday, West Texas Intermediate (CL=F) slid more than 4% to hover near $66 per barrel, while Brent also fell nearly 4% to trade below $79 per barrel, its lowest level since December 2021.
https://uk.finance.yahoo.com/news/oil-tanks-4-to-lowest-level-since-2021-on-weak-demand-151335705.html
Ovi,
I have Brent futures at $69.64/bo as of 4:20 PM US Eastern Time Zone, down about 3%.
Dennis
I think there is a typo in the original Yahoo article, which has now been corrected.
First time Brent has been below seventy in a long time. Difficult to believe demand is collapsing that fast or is it OPEC cheating?
Ovi,
I believe this is due to the expectation that OPEC will start increasing output and that Chinese demand is not very strong.
An update to May World and Non-OPEC oil production has been posted.
https://peakoilbarrel.com/may-non-opec-world-oil-production-drops/
A new open thread Non-Petroleum has been posted.
https://peakoilbarrel.com/open-thread-non-petroleum-september-12-2024/
July 24 info from EIA is out today, 9/30/24. Texas oil is down 34 to a preliminary 5706kbopd for July 24.