The EIA’s Short-Term Energy Outlook gives the USA data as C+C as well as all liquids, OPEC as crude only, but the rest of the world is Total Liquids only. All STEO charts below are million barrels per day. Other charts, not part of the STEO, are in thousand barrels per day. Also note that the EIA post known data in bold and future predictions in a lighter font. They post known data through November 2022.

Obviously all production is not known through November, but I have not tried to guess what they do know but posted the data as they posted it, known through November. But understand the November data, as well as October data, will almost certainly be revised later.
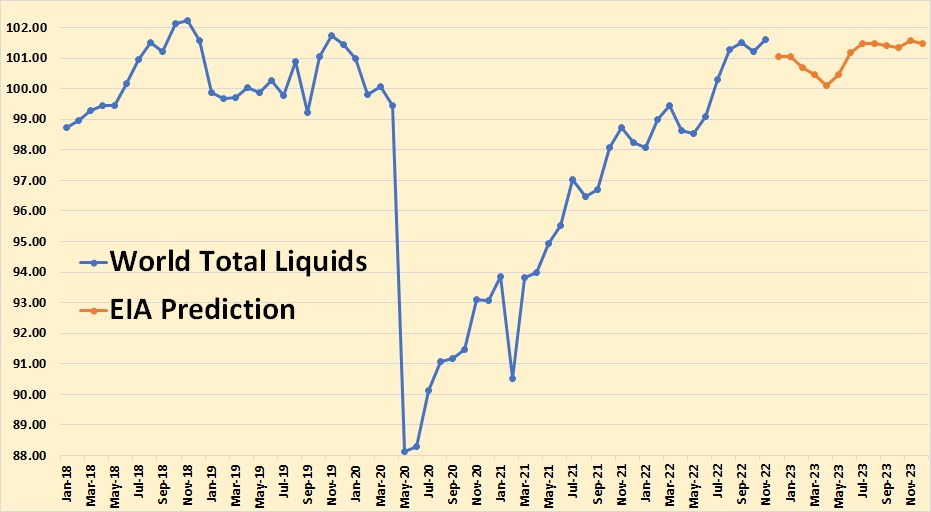
The EIA sees World Total Liquids declining early in 2023 with no gain for the total year.
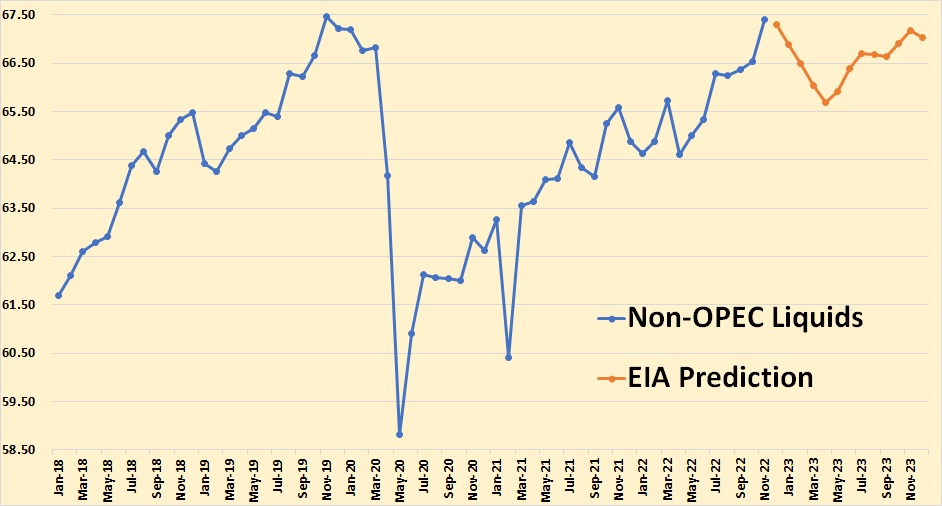
The EIA says Non-OPEC Liquids had a big jump in November, mostly from the USA and Kazakhstan, then a big decline, Russia, until April, then recovering for the rest of the year.
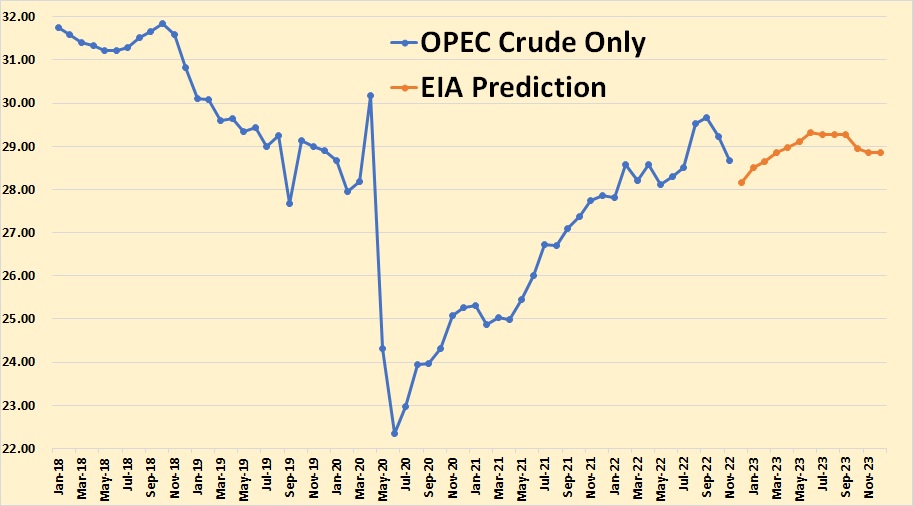
They think OPEC will keep cutting through December, then start to increase production gradually until they are back to their October 2022 level.
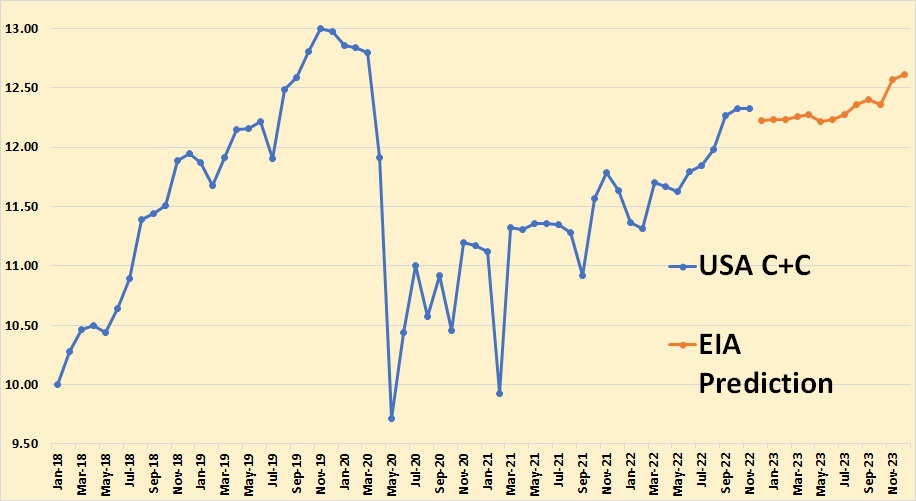
It appears the EIA thinks the USA’s growth spurt is just about over.
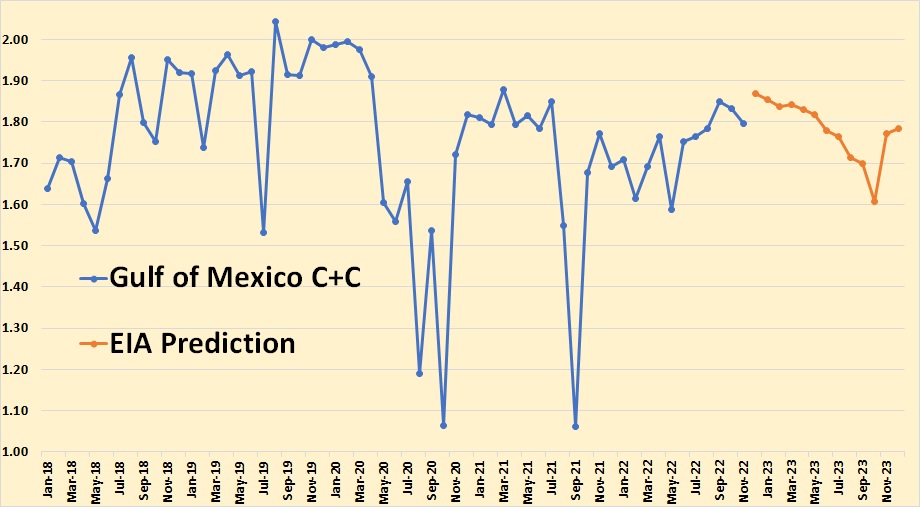
The GOM is expected to have a slight jump in December, then a gradual decline.
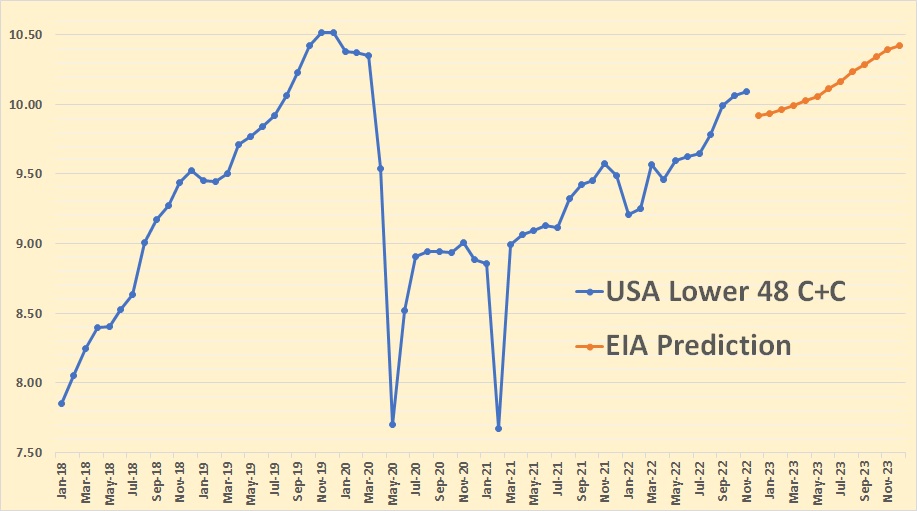
This is a strange one. The EIA sees USA Lower 48, less the GOM, growing by only 330,000 barrels per day from November 2022 to December 2033.
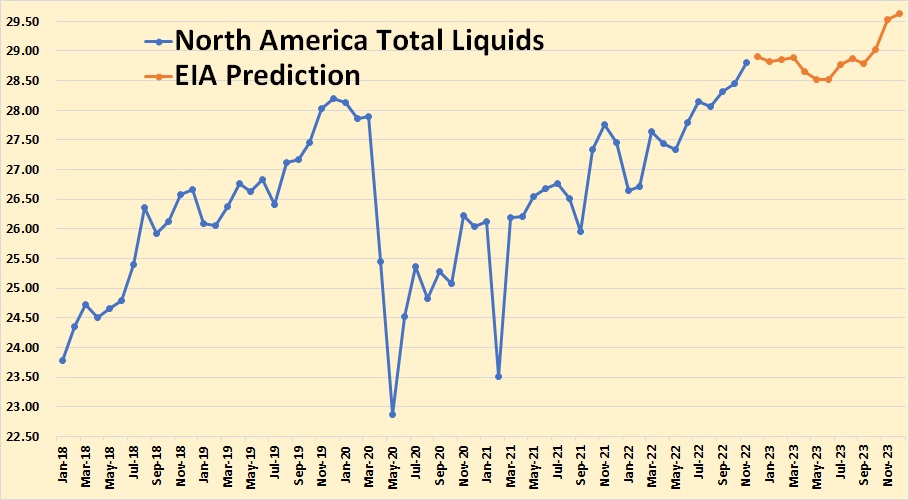
North American producers are the USA, Canada, and Mexico. This and all other STEO charts are Total Liquids.

The EIA is optimistic about Canada.
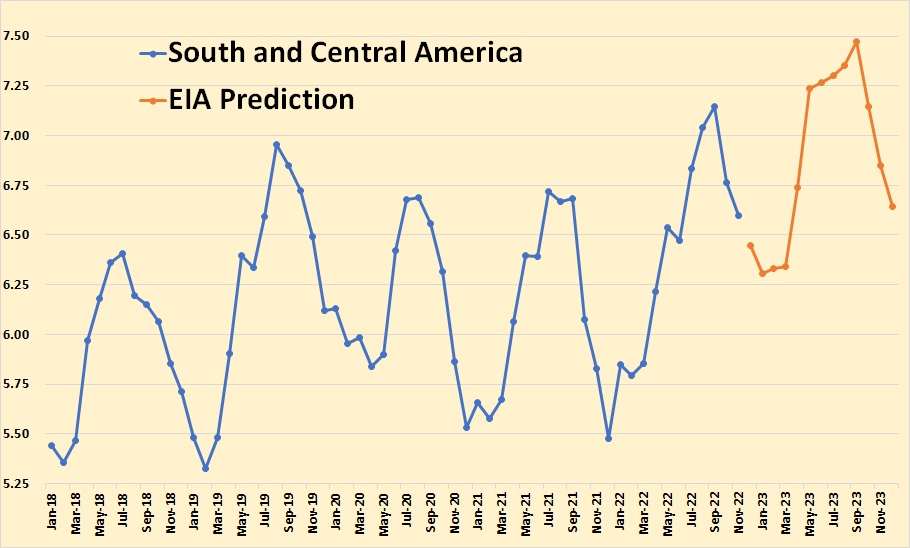
South and Central America consist of Argentina, Brazil, Colombia, and Ecuador. It does not include Venezuela, which is covered by OPEC data. The annual gyrations are caused by Brazil’s ethanol production.

Most of Brazil’s liquid petroleum comes from offshore but during their winter months, they produce about a million barrels per day of ethanol.
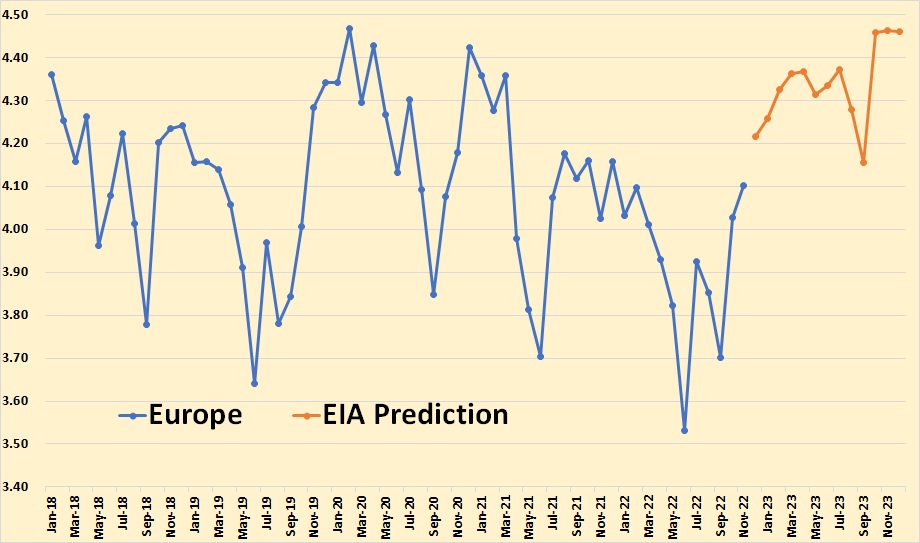
Europe consists primarily of Norway and the UK. Denmark and a few other other countries contribute a small amount.
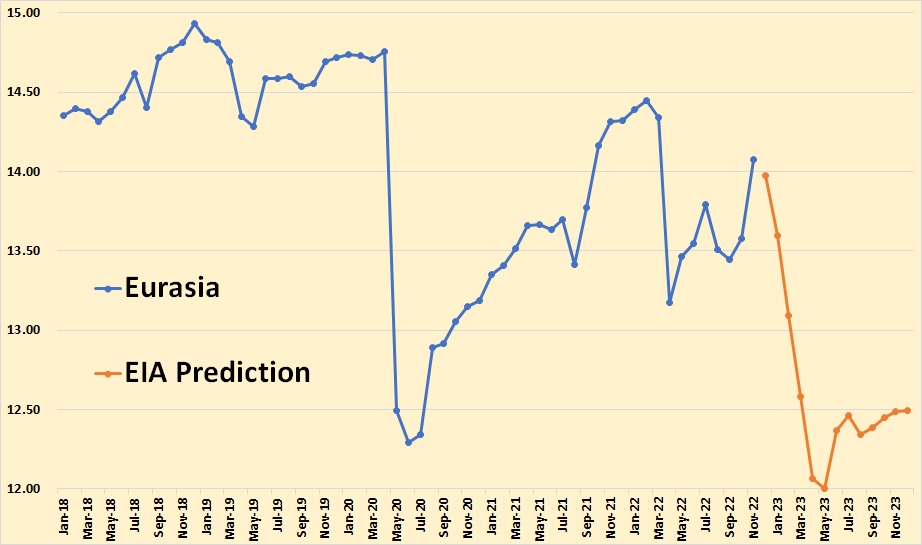
Eurasia consists of Azerbaijan, Kazakhstan, Russia, Turkmenistan, and a few smaller producers. Russian production seems to overwhelm all other Eurasian producers though Kazakhstan is also a strong producer.
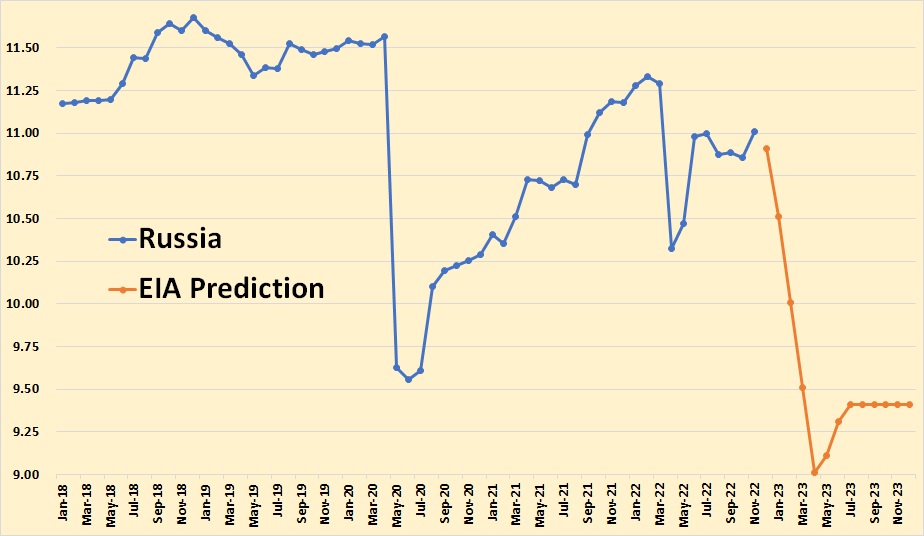
Russia surprisingly had an increase in November. But they start down in December and are down by about 2 million barrels per day by April 2022 to 9 million barrels per day. This is total liquids. C+C, if they are correct, will be somewhere between 8 and 8.5 million barrels per day by then.
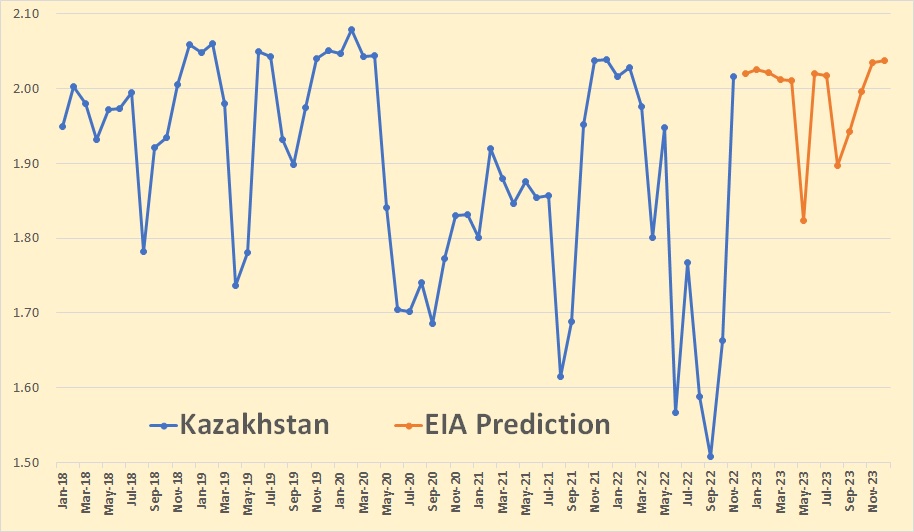
Kazakhstan finally got its pipeline leaks fixed and is back in full production. But they are pretty well at peak production now.
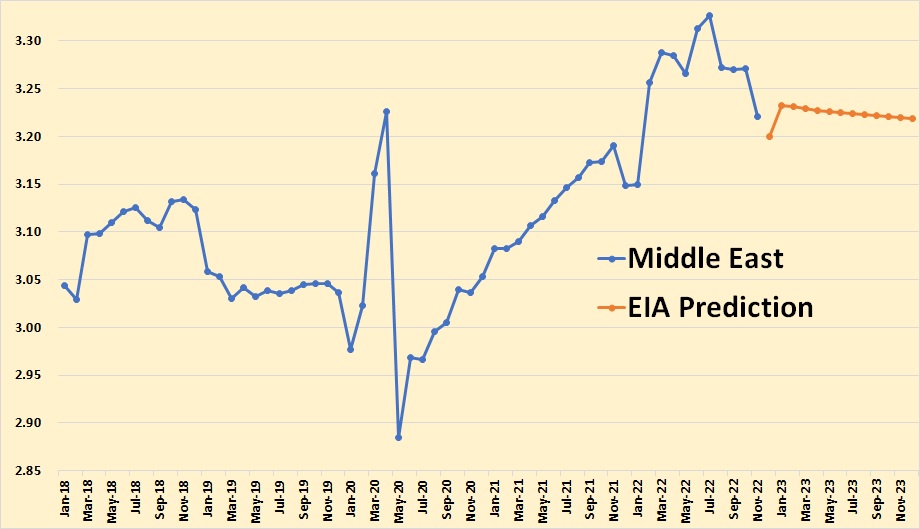
The Middle East non-OPEC nations consist of only Oman and Qatar.
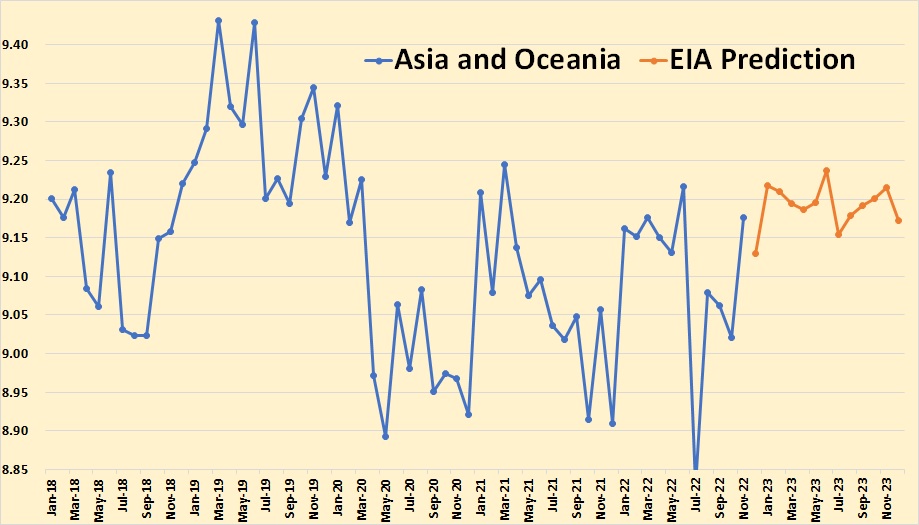
Asia and Oceania consist of Australia, China, India, Indonesia, Malaysia, and Vietnam.

The EIA has China increasing only slightly over the next year.
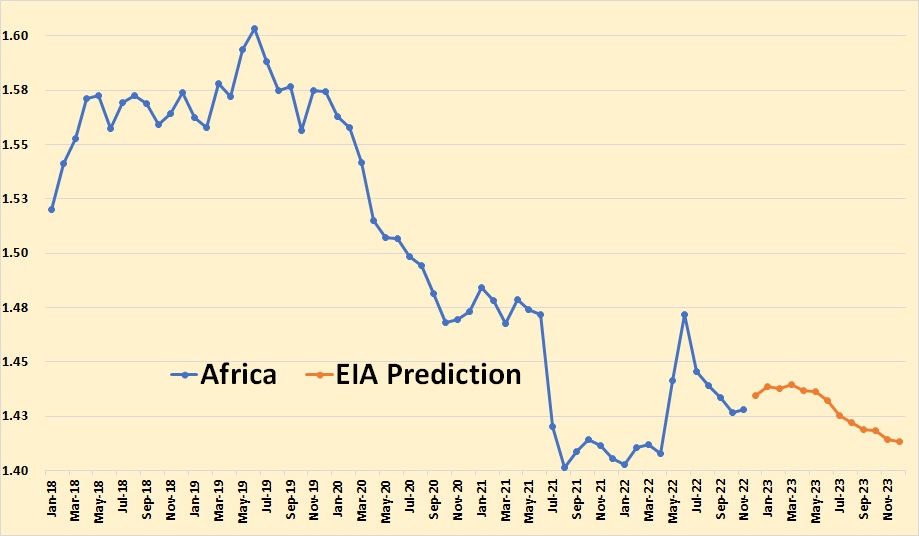
This is Africa non-OPEC nations only. That is Egypt, Sudan, South Sudan, and a few other countries.
With the below charts, I have attempted to show exactly what the EIA, as well as other institutions, are saying when they give us oil production data in “Total Liquids” instead of “Crude + Condensate”. They are giving us a lot of stuff that is just not oil. Data on all charts below is through August 2022.
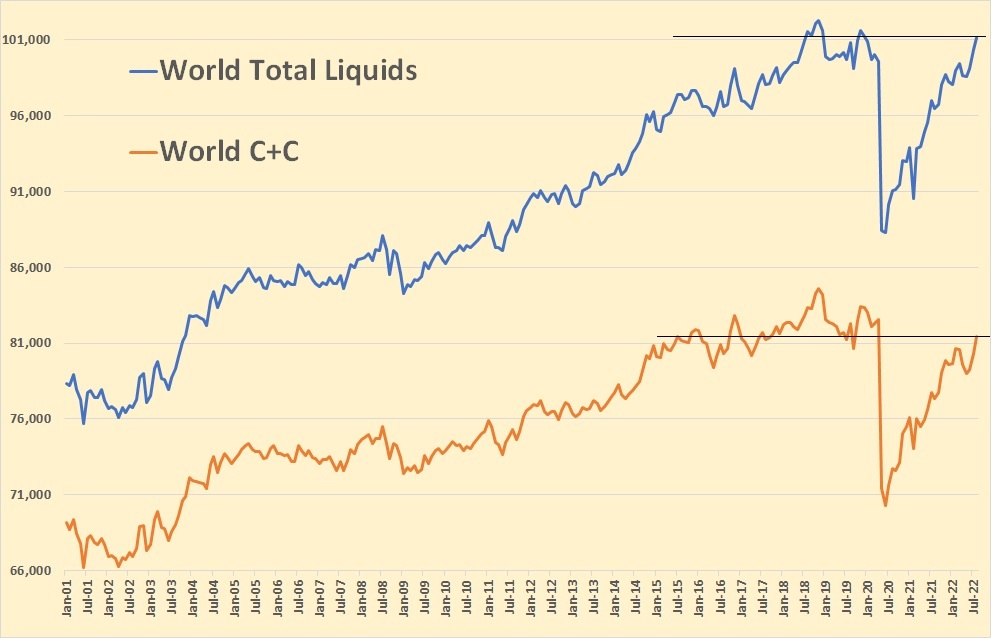
World total liquids average about 20 million barrels per day higher than C+C. Twenty years ago it was less than half that. But what, other than crude + condensate, makes up those 20 million barrels? Well, it is 1. Natural gas liquids, that is, bottled gas such as propane and butane. 2. Other liquids, 3. Refinery process gain. We know what 1 and 3 are, but what about number 2? The EIA says: Other Liquids include biodiesel, ethanol, liquids produced from coal, gas, and oil shale, Orimulsion, blending components, and other hydrocarbons. Orimulsion was a mixture of Venezuelan heavy oil and water, but it is no longer produced.
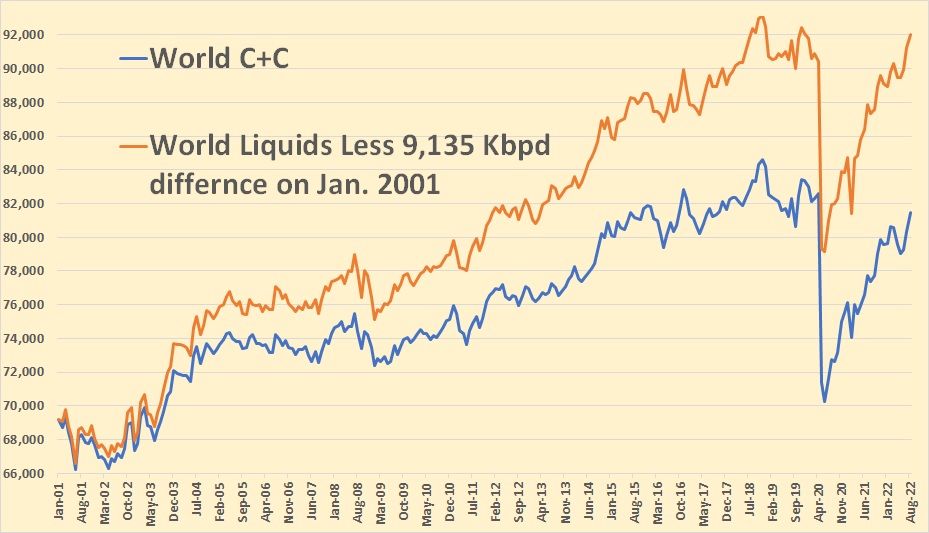
In January 2001, World Liquids were 9,135 Kbpd above world C+C. I subtracted that number from total liquids from that date through today to show the gain of liquids over a C+C.
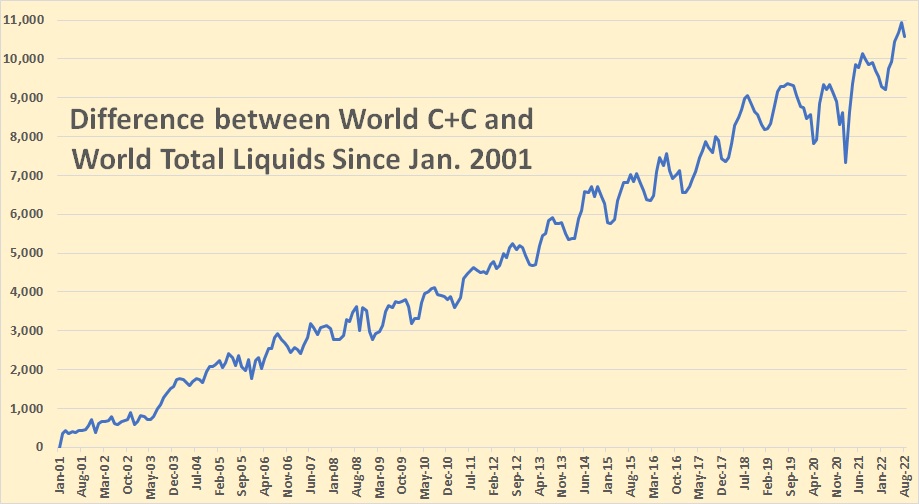
The actual difference between Total liquids and C+C in January 2001 was 9,135 k barrels per day. The chart above shows the gain of liquids over C+C since that date.
Below are the three components, other than C+C, that make up total liquids. I show the charts zero based in order to show more clearly their total contribution to Total Liquids.
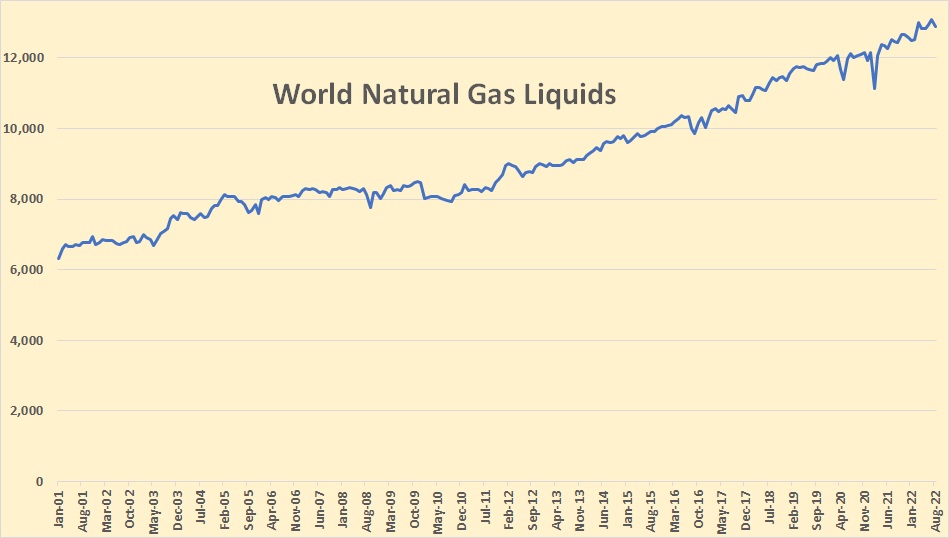
World Natural Gas Liquids production in August 2022 was 12,893,000 barrels per day, down 200,000 barrels per day from July.
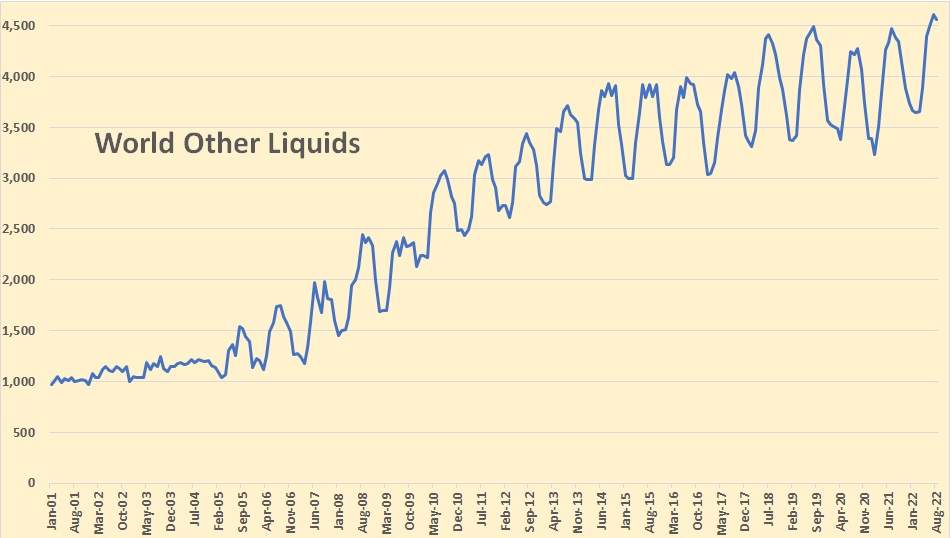
World Other Liquids production in August 2022 was 4,566,000 barrels per day, down 47,000 barrels per day from July. The annual gyrations were caused by Brazil’s ethanol production.
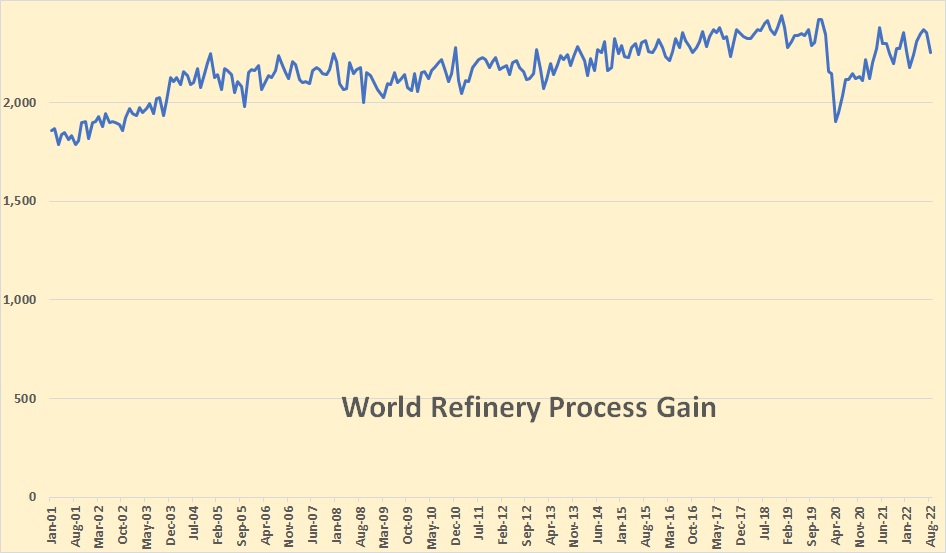
World Refinery Process Gain was 2,254,000 barrels per day in August, down 100,000 barrels per day from July.
Great post Ron. Thanks for breaking down the C+C/Total Liquids. Never seen that before!
I think there will be serious weather related problems in the Bakken oil patch. Lynn Helms said “crude oil trucks were not moving, pumpers weren’t on the road, tanks filled up and wells were shut down,” Then he said “Once a well goes down in this kind of weather, it can be extremely challenging to get that pumping unit up and running again.”
The problem is the temperatures stay so low for so long. Won’t the water in the oil seperate and freeze? I was told that will be a problem if Russia shuts down their Siberian field for very long. The Bakken had another blizzard in April that took their monthly production down by over 200 Kbp/d. But the temperatures were not as cold as this time and it warmed up quite quickly in May.
What are some opinions here? I would be interested in your input.
Bakken 30 day Weaher Forecast
Ron, I shudder to think, but I must say–I didn’t notice a reduction in my production revenue from the Bakken from the April storm. I hope this one is no worse. Most of my wells are handled by really good companies with a bunch of Canadian crew who are accomplished in this. Crescent Point, Zavanna, Whiting, Murex, Petro-Hunt, etc. I’m hoping they’ll know how to manage this. These aren’t Siberian conditions, where the methane clathrates form. I have a five-county presence up there–it’s been the best place to invest a dollar in the shale oil ever since the Permian acreage went sky-high.
I wish you and your wells the best Gerry. However, I think this blizzard will turn out to be far worse than the April blizzard. But they will, no doubt, recover.
I don’t understand how they start back up frozen production if it doesn’t ever get much above freezing. The earlier in the winter you have a freeze up, obviously the chances are you will be down for longer.
The winter of 2013-14, we had several leases which froze up in December and didn’t go back on until mid-March, because it was never warm enough, long enough, to unfreeze.
We have a lot of water in our oil, so unless there is a high volume going through the siphon leg, it will freeze up when the temperatures get below zero F.
We are lucky in that late next week temperatures are forecast to be above freezing 24/7 for several days with highs in the 50s.
I don’t know a thing about Bakken production besides what is on the internet, so maybe they are able to do things there that we aren’t, or cannot afford.
About 20% of our production is shut in, should all be back on line in 5-7 days. There are 4 one well leases we drain and shut in for the winter, they don’t make enough oil to fight the cold.
I don’t understand how they start back up frozen production if it doesn’t ever get much above freezing.
SS, I don’t understand that either. According to this chart, Williston 30 Day Weather Forecast it does not get above freezing for any day in the next 30. And it hasn’t been above freezing for the past three weeks that I know of. But perhaps someone more familiar with the area than I can explain it.
At any rate, I expect the completions will be way down for December and January. Production was down in April by just over 200 Kbpd after that blizzard. This one was supposed to be worse. But what do I know? Not much about oil production in the Bakken, that’s for sure. So we will have to wait and see.
More Bakken blizzare news: Up to 30pc of North Dakota oil output still offline
Up to 30pc of North Dakota’s 1.1mn b/d of crude production remains offline as severe winter weather and travel restrictions persist in the state.
An estimated 300,000-350,000 b/d of crude output is shut in, the North Dakota Pipeline Association (NDPA) told Argus this morning.
The high end of the estimate has been lowered from 400,000 b/d earlier in the week as some gains had been made, but “progress has stalled,” according to NDPA director Justin Kringstad, with extreme cold, blizzards and poor road conditions all limiting efforts to bring back wells.
The agency indicated on 22 December that some production had been restored, but extreme cold over the past day has made for additional curtailments.
North Dakota’s Department of Mineral Resources earlier this week projected that a significant amount of production will stay offline through the end of the year and that there is “virtually nobody” completing wells right now.
Ron
I recall reading this a long time ago. Under controlled conditions, a well can be shut in freezing weather by forcing gasoline down far enough to the point that the crude below it will still flow.
This was the reason that Russia kept using to get lower cuts while part of OPEC. This excuse faded when covid hit. Russia said they could not cut and then SA, UAE and Kuwait opened the valves in March 2020 and then Russia agreed to cut. Never read anything about how they did it.
Russia ha permafrost, which means the well bores can freeze even with no pressure present, which makes recovery and restart very problematic. The problems with cold air temperatures in normally temperate onshore fields are likely just to affect the topsides equipment and, although inconvenient, can be cleared without too much difficulty. If depressurisation and warming up doesn’t work then injecting glycol or methanol almost always does.
The biggest problem is the formation of methane and ethane clathrates. These are a weird marriage of physics and chemistry. Basically they are cages of hydrogen-bonded water that encase gas molecules–most commonly methane and ethane. The GOM is pockmarked by methane mounds which, because of high pressure and low temperatures, form clathrates. They can also form in Siberian pipelines, especially standpipes in gathering stations, but they can also form in Williston blizzards, though they’ve probably mitigated agains them up there. I am not a methane clathrate expert but I have been fascinated by them forever. This is not their first blizzard. Surely those Canadian boys can handle it. I have been most impressed with Zavanna and Crescent Point up there. However, this is just one more reminder that these shale basins all have quirks, due to complex interaction of a rainbow of natural gas components, pressure, water, rock facies, and the dislodgment of oil and gas from tombstone rock. This whole concept makes you shake your head.
Ron, I admire the determination and regularity with which you produce these posts.
From my website:
All these glitzy skyscrapers powered by gas.: the gas fired World Coup
18/12/2022
Qatar peak oil and gas (update Aug 2022 data)
http://crudeoilpeak.info/qatar-peak-oil-and-gas-update-aug-2022-data
Gas not yet peaked. But new LNG capacity is eroded by “expiring” Qatargas T 1-3 and Ras Lanuff T 1-2
Does any one know what “expire” exactly means? For a particular train or group of trains gas depleted? End of life of liquefaction facilities? Technology outdated and now uneconomic?
Storm cuts U.S. oil, gas, power output, sending prices higher
Dec 23 (Reuters) – Frigid cold and blowing winds on Friday knocked out power and cut energy production across the United States, driving up heating and electricity prices as people prepared for holiday celebrations.
Some 1.5 million barrels of daily refining capacity along the U.S. Gulf Coast was shut due to the bitterly cold temperatures. The production losses are not expected to last, but they have lifted fuel prices.
Freeze-ins – in which ice crystals halt oil and gas production – this week trimmed production in North Dakota’s oilfields by 300,000 to 350,000 barrels per day, or a third of normal. In Texas’s Permian oilfield, the freeze led to more gas being withdrawn than was injected, said El Paso Natural Gas operator Kinder Morgan Inc. (KMI.N).
U.S. benchmark oil prices on Friday jumped 2.4% to $79.56, and next-day gas in west Texas jumped 22% to around $9 per million British thermal units , the highest since the state’s 2021 deep freeze.
Gas output dropped about 6.5 billion cubic feet per day (bcfd) over the past four days to a preliminary nine-month low of 92.4 bcfd on Friday as wells froze in Texas, Oklahoma, North Dakota, Pennsylvania and elsewhere.
That is the biggest drop in output since the February 2021 freeze knocked out power for millions in Texas.
Any first hand info would be appreciated.
https://www.reuters.com/business/energy/storm-cuts-us-oil-gas-power-output-sending-prices-higher-2022-12-23/
Power prices in New England
The EIA Monthly Energy Review came out a couple of days ago. The data is subject to revision, especially the last two months. Usually, they have the last two months much higher than previous data. But I think the EIA is beginning to lower its expectations. This data looks a lot more reasonable. The data is through November.
I have inserted the STEO data for Sep, Oct, and Nov just to show the difference.
Latest update on my HHH options strategy. Click to enlarge.
Fracs dropped another 10 to 265 for the week ending December 23. This is the typical Xmas holiday drop.
Enjoy the holidays like Frackers. 🎄🎄🎄🎄🎄🎄🎄🎄🎄
An oil pro named Mike poked fun at my earlier prediction of all debt paid back in the Permian by early 2025. I updated my projection accounting for higher OPEX and capital cost and have also lowered the oil price expected in the future to $75/bo from the earlier scenario that had $100/bo in the future. NGL is 35% of crude price and natural gas is assumed to sell for $4/MCF. The cumulative net revenue for the Permian basin is shown for the scenario with 429 new wells per month maximum completion rate. The URR for the scenario is 33 Gb from 2010 to 2044 (no output after 2044). The cumulative net revenue for the entire Permian basin tight oil industry is shown in the chart below, actual prices are used through May 2027 for the scenario. Oil prices are assumed to fall to $75/bo by Nov 2022 and remain at that level until July 2032 and fall to $40/b by June 2035 and then remain at that level. All debt paid back by September 2025.
If we assume future Brent oil prices are $50/bo (2022$) from April 2023 to July 2032 (WTI would be about $45/bo), cumulative Permian debt is paid back in full by October 2033 (in the scenario we assume that 25% of any positive net revenue is paid out as dividends with the balance used to reduce debt),
For a case where Brent oil prices are $100/bo from June 2023 to Jan 2034 , all debt is paid back by June 2024.
Note that for previous chart I mistakenly labelled net revenue in 2020$, it should be 2022$.
Ignore the Permian cumulative net revenue charts above (9:42 pm on 12/24 and 11:59 am on 12/25/2022), I found an error in my spreadsheet. Chart below corrects that error and also updates oil and natural gas prices through November 2022 using real prices in 2022 $. The $100/b oil price scenario is shown with a higher total number of wells completed (118k vs 81k before) with the same maximum completion rate of 429 wells per month. This scenario has a URR of 49 Gb (vs 33 Gb previously), all debt paid back by April 2023.
Corrected $75/bo scenario, URR=49 Gb like $100 Gb scenario above. Debt paid back by August 2023.
I am not an ‘oilpro’ DH, just someone who has been IN the oil business for a long time spending his own money. I learned about well economics the hard way. Howzabout you?
I was actually poking fun at your ridiculous, totally absurd calculations of ARR based on LTO’s comment about 1.65: 1 ROI’s. I thought it was, well… whatever. Stupid? Why discount cash flow when it’s already been realized? Normal folks discount FUTURE cash flow. Nobody in the real oil business wants to know what their dollars returned are in 2021 dollars when its 2023. That’s a slick way of creating confusion among readers, members of YOUR community, who are relying on you for the truth. You should send some of your charts to Forbes; they would love you.
Money in v. money out, dude. Period.
This raft of charts about when “Permian” debt is paid back; good grief. You say 75% of “remaining” net cash flow after dividends goes to pay down debt…what debt? Where in the world did you come up with <$100B of Permian debt? Its 3 times that, public and private. And if 75% goes to pay down debt, where does the money come from to keep drilling wells?
My New Years resolution is to dump AOB and not try and help you anymore. Clearly, when I read comments about EURR and TRR and top down stuff you do, you are losing credibility. Your own readers say that. So three days in advance, Happy New Year and good luck. As your bud, HB says, nobody reads me, they read you.
God Bless America.
Mike. I did an anecdotal post on oily stuff regarding the cost of everything.
I don’t know how the shale biz works, but if it’s anything like our current experience, those guys have no earthly idea how close they will be to their “budgets.”
The cost of everything including electricity and chemicals has went haywire.
Mike acts as if he can handle game theory.
Mike,
I guess I would need to see a source for your 300 billion in debt for Permian basin tight oil producers.
At link below from Feb 2020
https://www.resilience.org/stories/2020-02-27/peak-permian-oil-production-may-arrive-much-sooner-than-expected/
they say:
Equity infusions have dried up, and lenders are getting picky. They insist that borrowers actually demonstrate cash flow and sustainability, qualities evinced by a shrinking number of shale producers. And starting in 2020, these companies face a wall of debt totaling $71 billion and maturing over the next seven years, according to research and analytics provider Rystad Energy.
The quote above comes from a discussion of the Permian basin, my estimate for Permian Debt at the end of 2019 is about 112 billion in 2022 $. I double checked the Barron’s piece and the debt of $71 billion is for the entire tight oil industry. Not clear where the $300 billion number comes from, my estimate is for upstream companies only producing in the Permian basin.
Cumulative net revenue is gross receipts from oil, NGL, and natural gas sales minus CAPEX minus OPEX, minus royalty and taxes over the period from Jan 2010 to December 2019. The “debt” is simply cumulative net revenue from Jan 2010 to some future date. If cumulative net revenue is negative, I assume the money comes from debt. I take the entire Permian basin tight oil industry as one large project starting in Jan 2010 (which is roughly when tight oil started to rapidly increase in the Permian basin.)
I don’t know how to correctly apportion debt in IOCs and independents between tight oil and gas development and other, or how much is with private companies, or over which period it is due but I’d bet the total is well over $200 billion. It would have been much higher at the start of 2020 because Chesapeake, Oasis and Whiting all went through restructuring that year, which wiped out most of their long term debt, and there was a switch in 2021 to paying down debt (plus dividends).
Total liabilities could be around twice the debt.
An analysis of debt for 50 publicly traded companies in the US at link below
https://www.eia.gov/petroleum/weekly/archive/2022/221214/includes/analysis_print.php
The E&P companies decreased their overall debt by $4.2 billion in the third quarter and lowered their long-term debt-to-equity ratio to 47%, the lowest in the past five years (Figure 3). The companies have collectively reduced debt in nine consecutive quarters, with a cumulative decline of $43.1 billion over the past two years.
These companies represent 35% of all crude produced in the US. If they are representative of tight oil producers in general which together produce 72% of US crude, then for all tight oil producers debt might have been reduced by $86 billion, Permian tight oil is about 59% of all US tight oil output, so Permian debt might have been reduced by 51 billion over the past two years. My analysis has Permian debt being reduced from about 128 billion in Nov 2020 to about 91 billion in Nov 2022 ( a decrease of about $37 billion). These are all in nominal dollars.
Buddy,
Don’t confuse me with facts
… or by trying to get me to understand the difference between facts and gross assumptions disguised as them.
George and Huntington beach,
George is correct, my analysis is based on a set of assumptions about average CAPEX and OPEX in the past which may not be correct. How much of the debt is from the Permian tight oil producers is not known, so there are no facts for that, as set of speculative assumptions must be made to estimate and these are pretty far from factual, they are WAGs.
I state the assumptions, I suppose some might think they are facts, but I agree they are not and assume most readers would be able to distinguish facts from speculative assumptions.
Another analysis of debt for the entire US oil and gas industry at link below.
https://www.spglobal.com/marketintelligence/en/news-insights/latest-news-headlines/us-oil-and-gas-shares-will-continue-to-gain-as-debt-is-paid-off-analysts-say-68469076
This might be where some have gotten the 300 billion estimate for debt, but it is certainly not the Permian tight oil producers specifically, the analysis is for the entire publicly traded oil and gas E & P sector. Not sure how we would estimate private company debt, though perhaps private companies have lower levels of debt, no idea really we can only speculate.
You are correct the debt is well over $200 billion in 2020, about $298 billion according to the S&P Global Market Intelligence analysis in Jan 2022. I do not know how much of this debt is for conventional oil production, conventional natural gas, shale gas, and tight oil again we would need to make speculative assumptions to guess at how the debt might be apportioned. I won’t make those here so there is no confusion.
Found this article from August 2022
https://www.oilandgas360.com/u-s-shale-on-track-for-200-billion-year-could-erase-its-debt-by-2024/
Excerpt:
U.S. shale producers are on course to make nearly $200 billion this year, enough to make the industry debt-free by 2024 and potentially fund a pivot toward more natural gas production, according to Deloitte LLP.
…
The trend is most powerfully seen in US shale, which burned through about $300 billion of cash from 2010 to 2019. But for those companies that survived the pandemic, the bounty is well and truly here. The industry will have made back that entire loss in 2021 and 2022, with further profits on the horizon for the rest of the decade. Deloitte’s analysis assumes an average Brent oil price of $106 a barrel for 2022 and $81 a barrel for 2023. Brent futures settled at $101.22 a barrel on Wednesday.
Note the 300 billion in cash burn from 2010 to 2019 is for all tight oil and shale gas producers in the US. My estimate for the Permian basin is about 112 billion of cash burn from Jan 2010 to Dec 2019 and this increased to 131 billion by May 2020 and decreased to $91 billion by November 2022, these totals are in nominal dollars as there are those that find an analysis in real dollars, (constant dollar value adjusted for inflation) as would be preferred by an economist, to be somewhat confusing.
Dennis,
Your region (New England) has become a viral online ‘talking point’ today with your electricity generation costs hitting >$2,800/Mwh briefly this evening. (That’s about 50 times higher than historical norms).
Oil burn was over 6,500 Mw constituting ~40% of the total at points throughout the day.
The inadequate supply of natgas will kneecap your region for the next several winters.
If the globally-scarce supply of heating oil runs short befor winter is over, you guys will be busting up old furniture to keep your lights on.
There are just two reasons for this disaster for the lower classes of New England. The elites hatred of the fossil fuel industry and their belief or pretending to believe that carbon dioxide will be the cause of the end of life on earth.
Just who are these “elites” that some people keep raving about? And no one believes CO2 will cause the end of life on earth. People who claim anyone believes such stupid things obviously haven’t a clue as to what the debate is all about.
The elites are the 90% of all the professors and administration of all the Universities in New England. A huge percentage of the teaching establishment. And the brain washed do-Gooders. And today in everything you read ‘emissions, only mean one thing. Carbon Dioxide. Carbon free, net zero, green this and green that. Why is all of this effort, laws, money and political pressure placed to Reduce Emissions. I may be stupid but your blind or corrupt. We are made to believe that carbon dioxide is evil. Which equals climate change which equals famine, floods, ice free Arctic, island nations going beneath the seas, the death of polar bears, the Great Barrier Reef being no more, the end of snow in the UK. So exactly what is the issue I’m missing?
We are made to believe that carbon dioxide is evil.
Bullshit! That one sentence alone proves that you haven’t a clue. A molecule cannot be evil. Denial of global warming is simply a denial of science. Only idiots deny scientific facts. I’ll bet you deny evolution, also.
So, exactly what is the issue I’m missing?
Your gross exaggeration of the problems caused by climate change proves that you are not interested in an honest discussion of the facts. Gross exaggeration is just a form of lying about obvious scientific facts.
Worldometers has a very interesting page regarding population growth, including estimates going back 8,000 years and future estimates.
As has been discussed here for years, this is the key issue. The Industrial Revolution brought about explosive population growth. The world population was growing over 2%. That has now fallen below 1%.
The US is just above 1/2%. Japan, Russia, and many European countries are negative or near zero population growth. Pakistan, Nigeria and others are above 2%.
The page I cited is a pretty good summary.
Ron
There are many powerful groups that are clearly stating that emitting CO2 is evil and a crime.
https://www.greenpeace.org/international/press-release/27881/commission-on-human-rights-declares-fossil-fuel-companies-can-be-held-responsible-for-climate-related-human-rights-harms/
What Evil have these companies done? The have produced oil which produces CO2.
https://scholarship.shu.edu/cgi/viewcontent.cgi?article=2139&context=student_scholarship
Politicians under pressure have closed down coal fired power stations leaving very little excess capacity. These pressure groups are very powerful within government lobby circles
There are various forms of energy nativity (or intentional ignorance)
-pretending that the world of people can abruptly get off fossil fuels without extreme disruption
-pretending that fossil forms of solar energy are indefinitely abundant
-pretending that greenhouse warming of the earth by CO2 and methane is a minor or fabricated issue
-and this last one some people may not quite agree with
pretending that energy will remain affordable at scale for most of the earths people and functions of modern civilization
Some people find it intentionally convenient to remain naive about certain (or all) of these aspects.
I think that what many people don’t realize is that the umbrella term climate change is a euphemism for the combined effects of global warming and fossil fuel depletion. However TPTB don’t want to focus on depletion because that is an existential threat on our convenient way of life and so would freak everyone out. The “proof” is that Ervin does not realize this and is going on with BAU and complaining about elites.
” Why is all of this effort, laws, money and political pressure placed to Reduce Emissions.”
let me guess, money ?
that carbon dioxide will be the cause of the end of life on earth.
Lovely Straw Man you have there.
Coffeeguyzz,
Not enough natural gas pipeline capacity to New England, which perhaps New England states could sue New York State for interfering with interstate commerce by blocking pipeline development. Not clear if New England States want more natural gas pipelines, but getting gas from Pennsylvannia to New England requires a route through New York.
In the mean time LNG is more expensive than oil, so more oil will be used in New England Power PLants during cold weather. More offshore wind development might help with this problem, but the fishing industry has a problem with offshore wind and it it is expensive, though probably less than the current cost of LNG. The offshore wind resource in New England is very large and should be utilized in a responsible way (with a little damage to the environment as is feasible.
A summary of some of the problems at link below
https://www.iso-ne.com/about/what-we-do/in-depth/natural-gas-infrastructure-constraints
The real problem in New England is lack of insulation, no lac of gas.
Oil Wells Creeping Into Texas Cities Herald Shale Era’s Twilight
(Bloomberg) — Each morning when Michael Quinn pulls into the parking lot of the luxury apartment complex he manages in West Texas and looks across the street, an unsightly vision blots the horizon: a 24-foot-high insulated wall.
Quinn, who works at the Midway Station Apartments in Midland, isn’t troubled by the eyesore. The barrier, covered in a sand-colored tarp, is designed to muffle noise from an oil-well site across the road. To Quinn, it’s a symbol of a flourishing industry that’s the lifeblood of the local economy.
An uptick in drilling within the city limits signals that the very best rock in one of the world’s most prolific oil fields has already been tapped. In the shale boom’s early days, with so much crude-soaked land up for grabs elsewhere in the Permian Basin, there was little reason to deal with the red tape needed to bore underneath populated areas. But with over two-thirds of the Permian’s premium land now drilled, according to BMO Capital Markets, producers are seeking more permits than ever to burrow beneath Midland and its 130,000 residents.
“US supply is already materially slowing down,” said Francisco Blanch, head of commodities research at Bank of America Corp. “It’s giving OPEC a lot of comfort to come in and keep prices elevated because they don’t fear US shale like they did in the past.”
But US output tumbled at the start of the Covid-19 pandemic and is still about 1 million barrels a day below the record 13 million reached in early 2020. Next year, growth is likely to be around 560,000 barrels a day, according to Enverus. That’s despite crude prices averaging more than $90 a barrel this year, far above what producers need to break even.
Wells drilled this year produced between 8% and 13% less oil per lateral foot than a year earlier, according to BloombergNEF, the first major reversal after a decade of productivity gains.
It is worth while to read the original article.
https://www.bnnbloomberg.ca/oil-wells-creeping-into-texas-cities-herald-shale-era-s-twilight-1.1858125
New England can’t import more gas because THEY invested heavily to fund the groups that prevented the building of more capacity. THEY are to well funded and too powerful for any pipeline company to even try to put into the ground a new supply. Any business worth is name would love to deliver gas to a critically undersupplied market But THEY have made that impossible. You seem to think that ISO New England has no problem supplying the market with $.30 to $60/ kwh electricity you seem to think that the poor really don’t care if they are spending hundreds more per month for their electricity.
Merry Christmas everyone!
Merry Christmas Dennis and everyone else!
First of all, thank you Ron for this work.
The separation of Total Liquids in NGL, Other Liquids and Refinery Process Gain is very interesting. While the growth of Total Liquids looks almost linear, NGL took a boost around 2010, when Other Liquids slowed down. This leads me to the assumption that somehow, roughly before 2010, NG was used in a different way to produce those Other Liquids. Is this possible? And how could NG be used in such a process?
Also interesting though quite obvious and logical – as it is directly related – is that Refinery Process Gains reflect closely the World C+C production curb.
This leads me to the assumption that somehow, roughly before 2010, NG was used in a different way to produce those Other Liquids. Is this possible? And how could NG be used in such a process?
No, that is not possible. Natural gas liquids and “other liquids” are two entirely different things. NGLs are not used to produce other liquids.
Other liquids definition from the EIA: Other Liquids include biodiesel, ethanol, liquids produced from coal, gas, and oil shale, Orimulsion, blending components, and other hydrocarbons.
The correlation in these two curbs could be caused by market forces shifting toward NGL and away from other, more expensive forms of liquids. It obviously coincides with the beginning of the fracking boom and the related surplus of NG. It’s just too strange that the combined curbs are almost linear while each one separated has very different characteristics.
West Texas,
I do not know if this addresses your question regarding NGLs, but – starting with the ~2010 surge from the Appalachian Basin, the liquid components
produced from the gas wells have been on a meteoric rise.
I beleive the US now exports well more than 2 million barrels a day of ethane, propane, and butane.
This is in addition to the huge increase in consumption caused by new American steam crackers
Depending upon where the wells are drilled, some output contains as much as 60% liquids with the balance being methane.
Yes Coffeeguyzz, that makes a lot of sense to me. Thank you. Seems like fracking was the turning point in the distribution of Total Liquids.
West texas fan club,
The NGL to natural gas ratio is fairly constant in the US, NGL output has increased mostly because natural gas output has increased. Other liquids is biofuels, and GTK and CTL.
I double checked this on NGL per unit of natural gas produced. This was roughly correct from 1981-2006 (data for NGL only goes back to 1981 from EIA), after 2006 the NGL produced per cubic foot of natural gas by about 60% from 2007 to 2022, this coincides with the increase in shale gas output over that 15 year period.
NGL per cubic foot of natural gas rose by 60% from 2007 to 2022.
Not the reason for the rise in NGL, but Norway was injecting gas to produce oil in the North Sea until the price of gas rose sharply this year and it became more profitable to produce more gas and less oil. So there are some instances of Enhanced Oil Recovery (EOR) where one can favor either gas or oil depending on relative prices.
Not a lot to say . Less meat ,more potato’s on the plate .
Just for info purposes .
With WTI around $80/b, will the US still issue a tender in January for delivery of 3 million barrels in February?
North Dakota oil output drops about 40% after blizzard, freeze; restoration continues Bold mine
North Dakota has restored some of the oil output that was curtailed during the recent blizzard and freeze-offs, but an estimated 40% of production remains down, an official state source said Dec. 27.
Oil production in North Dakota is estimated to be 650,000-700,000 b/d as of Dec. 27. Using 1.12 million b/d as the baseline, overall state oil production is estimated to be down 400,000-450,000 b/d, Jessica Petrick, spokeswoman for the state’s Department of Mineral Resources, told S&P Global Commodity Insights in an e-mail.
“That’s about a 40% reduction due to recent storms and travel difficulties,” Petrick said. “Weather conditions are improving rapidly, and [upstream] operators are working quickly to restore production.”
Blizzard conditions prevailed Dec. 19 when DMR Director Lynn Helms gave his monthly production webinar, which had been delayed due to the weather conditions. The harsh weather caused shut-in production of 300,000 b/d to 400,000 b/d, but by Dec. 24-25, more shut-ins had occurred.
According to North Dakota’s latest monthly production figures, the state averaged 1.12 million b/d of oil output in October, flat with September.
Natural gas production was down 1% to 3.143 Bcf/d.
O&G Journal lists Guyana’s oil reserves for the first time as of Jan. 1 2023 at 11,000 Mb, thus nearly as large as Brazil’s at 13,242 Mb. Namibia still at zero. Total proven reserves for the world increased to 1757 Gb from 1735 Gb last year.
Here is some data from the annual reports for Pemex and Petrobras (PBR). Pemex loses money every year, has a huge and fairly steady debt load and negative equity, but as a nationalised industry I guess its worth should be measured differently from publicly held companies.
Given that Brazil is one of the few areas with growing production the PBR spending on exploration and development is surprisingly low in recent years. I think this is because exploration and leasing has been cut back as far as possible and the FPSOs under development are either at the beginning or end of the cost S-curve; as more move into detailed engineering and procurement the costs will have to rise.
I presume that most of this production in Brazil is from the pre-salt basins, which have increasing GOR and WOR.
In other words, they’re in the same situation as other basins. Production should continue to be good but the three big fields are declining.
Most production is from pre-salt in the Santos basin. The water cut there is overall still below 10%. Water injection is used to maintain pressure so GOR doesn’t change. I don’t know what you mean by the big three fields but all the main Santos fields are on plateau or growing though some of the individual FPSOs are past peak.
The First Stage Of Grief, DENIAL, for Dummies
If you spend a bit of time reading this blog, you will find two distinct ideologies.
1) Those who provide more Objective Facts about the major challenges to the Global Oil Industry
2) Those who read these major challenges reply with “ALL WILL BE FINE.”
Thus, the second group belongs to the first stage of Grief… DENIAL. It seems that these individuals who cannot handle the major issues that we face, have a KNEE JERK reaction that everything will be fine. “We will find a solution or new technology.”
As we head into 2023, I believe this will be a “negative” pivotal year for the Global Oil Industry. And, by 2025, the world begins to fall over the ENERGY CLIFF.
However, this will likely put the second group of individuals on this blog to become more entrenched in DENIAL.
GOD HATH A SENSE OF HUMOR….
steve
What a load of crap
***
“How Black and White Thinking Hurts You (and What You Can Do to Change It)
Black and white thinking is the tendency to think in extremes: I am a brilliant success, or I am an utter failure. My boyfriend is an angel, or He’s the devil incarnate.
This thought pattern, which the American Psychological Association also calls dichotomous or polarized thinking, is considered a cognitive distortion because it keeps us from seeing the world as it often is: complex, nuanced, and full of all the shades in between.
An all-or-nothing mindset doesn’t allow us to find the middle ground. And let’s face it: There’s a reason most people don’t live on Everest or in the Mariana Trench. It’s hard to sustain life at those extremes.
Most of us engage in dichotomous thinking from time to time. In fact, some experts think this pattern may have its origins in human survival — our fight or flight response.
But if thinking in black and white becomes a habit, it can:
hurt your physical and mental health
sabotage your career
cause disruption in your relationships”
https://www.healthline.com/health/mental-health/black-and-white-thinking
HB, there are two types of people. There are those who divide people into two types. And there are those who don’t. 🤣
However, I must agree with Steve somewhat on this subject. There are stupid people out there, and they do organize to maximize their stupidity. And they often behave in ways that are a danger to society. Opposing those who organize these people in order to incite violence in support of their ideology can be singled out as a dangerous cult not to divide people into groups two groups. It is simply to point out the danger and damage to society that they are capable of.
Those who shoot up Gay clubs are ignorant and a danger to society. Those who shoot up electrical sub stations are also a danger to society. Pointing these things out is not painting everything as black or white, but simply telling it like it is.
https://en.wikipedia.org/wiki/Dunning–Kruger_effect
“The Dunning–Kruger effect is a cognitive bias[2] whereby people with low ability, expertise, or experience regarding a certain type of task or area of knowledge tend to overestimate their ability or knowledge. Some researchers also include in their definition the opposite effect for high performers: their tendency to underestimate their skills. ”
80% of humans believe they are above average intelligence.
“U don’t know, what u don’t know” – somebody
Jesus repeatedly says in the Gospels of the New Testament that he wants you to live like a Peasant.
Republicans want us to maximise profits and do what Jesus says.
Donald Trump loves the OLD Testament and NEW Testament equally, its the most important thing in his life ( he says as he holds the Bible upside down, he doesn’t know what either of them are ).
You couldn’t write a MOVIE this good!!!
“The title of the movie, The Unknown Known, comes from Rumsfeld’s most famous statement while serving as George W. Bush’s secretary of defense:
As we know, there are known knowns; there are things we know we know. We also know there are known unknowns; that is to say we know there are some things we do not know. But there are also unknown unknowns—the ones we don’t know we don’t know. ”
https://www.theatlantic.com/politics/archive/2014/03/rumsfelds-knowns-and-unknowns-the-intellectual-history-of-a-quip/359719/
Ron,
“There are stupid people out there”
Ok, no argument there. The general public, their not in denial. Their in ignorance.
I’ve been told here that I’m in denial a number of times. Of course, I believe I have a better grasp on reality than most. I don’t think but maybe a couple of the regulars here are in denial. The comment struck me more as a doomer, denial of technology dividing color into black & white. We’re here for the nuance.
Name the “ALL WILL BE FINE.” regular posters ? Sooner or later there will be some kind of collapse. It’s all about timing. But this: “by 2025, the world begins to fall over the ENERGY CLIFF”. I’ve read this same kind of stuff for 15 to 40 more years.
Then comes the close, “this will likely put the second group of individuals on this blog to become more entrenched in DENIAL”. Steve must have got a little last night and was feeling frisky. Lucky Steve, I had to comment and he got his reaction. That made him two for two in about 12 hours. There’s a risk every morning you wake up, everything you remember that’s important to you from the past is different. Just ask Volodymyr Zelenskyy.
Volodymyr Zelenskyy–
Maybe he could play the piano with his penis again?
Seemed like a highpoint?
Then Volodymyr woke up the next morning and Russia was dropping bombs on his homeland.
Today, Volodymyr addresses the American congress regarding Russian aggression and tyranny. Then is rewarded with 10’s of billions of dollars of American military equipment.
And Volodymyr playing the piano is a highpoint for you ?
Hint:
Zelensky came into power on the coup of 2014.
(or the result of, which is more accurate)
Repressive right wing government (or dictatorship, as my comrades say)
The Russians are not much better—-
HUNT,
Why don’t you really tell me how you feel about DENIAL… 🙂
Regardless… the world isn’t prepared for what’s coming as we have designed a way of life-based upon the Amazon Star Trek Replicator Economy.
You PUSH A BUTTON on a computer screen, and almost magically, the product appears on your front door the very next day.
The Growth of this Amazon Star Trek Replicator Economy was nearly seamless, but the downside disruptions will be quite the opposite as it destroys the American Leech & Spend Consumer Lifestyle.
Happy New Years 🙂
steve
Happy New Years to All!
One can only wonder what craziness will await oil and energy markets next year. Thanks for all the great discussions here on POB and to the excellent content provided free of charge by our hosts. Your efforts are greatly appreciated!
Stephen
The most productive oil well in México´s history was the famous “Cerro Azul 4” it delivered 250.000 barrels a day, with 1920´s technology. There is not a single well in Mexico, not one, with even a 5.000 barrels a day output, and the average well delivers 250. Mexico cannot even refine 800.000 barrels of daily heavy oil outpue from its most productive field. The oil is swapped by refined fuels from the U.S. “Oh, well…México is a particular case” Yeah, like…Venezuela for example? And there´s still people charting volumes like crazy, as if that would give you the slightest idea about what is really going on.
Happy new year, Steve. Thanks for being there.
Blessings
Steve,
It’s a lot more efficient to ship a package to the front door, then to drive 5 to 10 miles one way to pick up a item.
I believe you have to be aware of the situation to be in denial. Charles Barkley would say I’m in denial if I thought the Lakers could win a championship. I don’t think Dennis is in denial and has a better grasp on energy economics than yourself. Last month Ron said he called peak in October 2018, only to be reminded he also called it in January 2015. Was he in denial ? Did he want to just conveniently forget ?
I think your in denial that humanity can continue as is for another 50 to 100 years. Because of efficiency, alternatives, resources management and advances in technology. Fifteen years ago EV’s, smartphones and Permian weren’t in your vocabulary.
“IRVING, Texas – October 28, 2022 – Exxon Mobil Corporation today announced third-quarter 2022 earnings of $19.7 billion, or $4.68 per share assuming dilution.”
https://corporate.exxonmobil.com/-/media/global/files/investor-relations/quarterly-earnings/earnings-announcements/2022-earnings-announcements/3q-earnings-release.pdf
Happy New Year
There are no “five stages of grief.” It was a misappropriation of an idea by Kubler-Ross about people confronting life-threatening illnesses.
It’s time to let the five stages of grief die.
My point of view is that there are a lot of challenges ahead, but not the same challenges we had last century.
Suncor refinery shuts down, to stay closed for months
https://kdvr.com/news/local/suncor-refinery-shuts-down-to-stay-closed-for-months/
The EIA released its monthly US Production report today.
U.S. October production increased by 69 kb/d to 12,381 kb/d. It should be noted that September’s oil production increase, which was considered high last month, was revised further up by 44 kb/d to 12,312 kb/d in the current report.
Attached is the table that Ranks States by Production. New Mexico and Texas continue to lead on a YoY comparison. Check out Utah, up almost 40%. A full report should be out late Sunday.
I want to thank all of the participants for their contributions to keep this board interesting and active.
I wish all of you a Happy, Healthy and Prosperous New Year and especially the participating oil producers.
🍾🍾🍾🍾🍾🍾🍾🍾
Thanks Ovi,
Happy New Year!
Chart below has trend since June 2020 for US output using OLS.
For tight oil over the same period the annual rate of increase was 542 kb/d (the OLS trend).
EOG Resources’ 2022 drills show a substantial decline in normalized well productivity as reality bites on their ‘Double-Premium’ well inventory!!
Shale wells have now started degrading rapidly, especially for companies that continue to overcapitalize their core acreage. 🛢💰
Thanks Hole in head,
Where did you get this chart?
From https://novilabs.com/blog/eagle-ford-update-through-july-2022/
We have the following for all Eagle Ford producers.
Dennis ,it ‘s a tweet . Here is the link .
https://twitter.com/WhiteTundraSG/status/1609033101111615488
Thx Hole in head
Dennis/HIH
How do we resolve HIH’s chart and that the peak production in the Permian 2022 wells is lower than the 2021 wells with the ever increasing output in New Mexico and Texas Permian. Somehow some critical piece of info is missing.
Ovi,
The chart for Hole in head is for EOG wells in the Eagle Ford play. So not really relevant for Permian.
For the Permian basin as a whole the 2022 wells have similar productivity to 2020 wells, 2021 wells were slightly better (this data is not normalized for lateral length.)
See also chart below from
https://novilabs.com/blog/permian-update-through-august-2022/
click on chart for larger view.
Even with slighly lower peak productin the cumulative production over the first few months is more critical. Enough wells are being completed to increase output and in addition the well profile data is often revised as well data becomes more complete over time. Basically it is too early to make a solid judgement on the average productivity of the 2022 wells.
Note the scale difference between the earlier Eagle Ford Chart and the Permian chart above. For the Eagle Ford output is cumulative output at 6 months in barrels per 1000 feet of lateral. Foe the Permian chart it is cumulative output at 12 months and is barrels per 10,000 feet of lateral, so the charts are not easily compared due to 6 month and 12 month difference (the 1000 to 10000 difference is easy as we just multiply by 10, but 12 month output is not simply 2 times 6 month output, it is roughly 1.3 times larger at 12 months vs 6 months.
Also note the higher productivity per 10000 feet of lateral for Delaware basin wells, the total length of the average Delaware basin well tends to be deeper than the Midland basin average well so the capital cost of similar lateral length well in the Delaware would be higher.
For those with an interest in finance .
Will the dragon king appear?
Despite central bankers insisting that interest rates are going up even higher in 2023, global markets say otherwise. And if you wanted a simple, two-word reason, it can be summed up as “counterparty risk.”
When someone takes out a mortgage on a house or a loan on a car, the bank holds a claim on the car or house against the risk that the borrower will default. In the far distant past, this caused bank managers to be extremely cautious. The bank would make plenty of money on the interest from the loan, but only over a long – 20 to 30 year – timescale. That changed with the use of so-called “collateralised debt obligations” (CDOs) which became easier to develop as the digital revolution took off from the mid-1980s. By packaging and selling the income from a range of loans into a single CDO, banks could rapidly recover the currency they generate when they make loans as profit. In this way, small regional banks morphed into globe-spanning giants by the end of the twentieth century.
We ordinary folk got to learn about CDOs when a raft of “mortgage-backed CDOs” turned out to be duds because too many sub-prime incomes had been bundled in. So that when oil prices rose after 2005, and central banks raised interest rates in response, low-income borrowers defaulted, causing CDOs to be worthless overnight. Worse still, nobody could tell which CDOs were bad, and so banks refused to accept them as collateral on loans between one bank and another. And so, we got to learn what a “credit crunch” was.
This might not have been so bad, except that almost all of our currency is borrowed into existence when banks make loans. Moreover, while governments and central banks continue to maintain the fiction of a fractional reserve – the idea that banks must keep central bank reserves or M0 money in their vaults as a kind of substitute for gold before they can loan out multiples of this to you and me – the reality is that most currency is created when banks lend to each other behind the back of the central bank. In practice, banks would use CDOs as security against loans of newly created currency to each other… the true brake on lending being the perceived counterparty risk rather than any fictional reserve limit set by the central bank. That is, so long as everyone continued to believe that the other bank’s CDOs were good, they could spirit as much new currency into existence as they chose.
When the real economy came knocking after 2005, perceived counterparty risk rose. Banks became more reluctant to lend to each other and, as a consequence, cut back the amount of loans issued to us. With the rate of new lending falling, and with interest rates rising, counterparty risk grew even further as the real economy tanked. Plenty of people saw the inevitable conclusion but they called it a “black swan event” anyway – implying that, in fact, “nobody could have seen it coming.”
Writing in the aftermath of the 2008 crash, Didier Sornette, a specialist in complex systems and risk management, argued that many of the crises which are retrospectively categorised as black swans are, in fact “dragon kings” – big outlier events which, viewed through the correct lens, are entirely predictable.
As Mark Twain is reputed to have said, “History doesn’t repeat itself but it often rhymes.” We are not about to repeat the events of 2007-2008, but there are alarming similarities, together with a few new factors which could make the coming shock much worse. The similarities are:
Rising energy costs translating into higher prices
Central banks jacking up interest rates – far faster – in an attempt to crush demand
Large numbers of “zombie” companies and households – the modern equivalent of 2008’s sub-prime borrowers – that were struggling to service debt even before interest rates began to rise.
New factors include:
The slow-motion collapse of supply chains
Global energy and commodity shortages
The self-inflicted de-industrialisation of Europe
The non-western states’ move toward a new BRICS currency as an alternative to the US dollar.
There is a plausible argument that we – that is, the central bankers and politicians – never once resolved the economic turmoil which began in the mid-1970s with the end of US energy dominance and the collapse of the Bretton Woods gold standard. Instead, each new manifestation of the crisis was temporarily overcome by making the problem even bigger. Companies bailed out each other – via mergers and takeovers – in the 1980s, then banks bailed out companies in the 1990s and early 2000s. In 2008, governments had to ride to the rescue of banks, and in 2011, the European central bank had to bail out countries which had foolishly joined the Euro – the so-called “PIIGS” (Portugal, Ireland, Italy, Greece, and Spain).
What few people realise is that the international banking system – the “Eurodollar” system – is entirely unregulated. Banks can – and do – simply generate new US dollars out of thin air when they make loans to one another, in almost exactly the same way as they create bank credit when they lend to you and me. But banks don’t lend money to each other for fun. Rather, they do it to settle accounts on dollar denominated debt that they have loaned to governments and to transnational corporations. The same – but much bigger – process of creating and swapping CDOs has been going on internationally. The result is an inverted pyramid of CDOs ultimately based upon the taxed levied by governments. And there is the first element of the dragon king…
With economies struggling following Brexit, trade wars with China, energy shortages, lockdowns and sanctions, governments are struggling to find politically acceptable means of raising taxes. And just as national banks were worried about the counterparty risk from sub-prime borrowers in 2008, so 2022 saw an increasing reluctance to accept even supposedly good government debt – British gilts or Italian bonds – as collateral against dollar loans. This appears to be the reason why yield curves have inverted across the western economies, as banks seek to obtain US Treasuries as the last good currency still standing.
We caught a glimpse of what may happen in 2023 – albeit a partially engineered crisis – when the Bank of England had to buy back UK government debt in order to prevent a pensions crisis. Central banks can, of course, “monetise” debt denominated in their own currency at a cost of devaluation more or less indefinitely. But problems arise when governments seek to roll-over their dollar-denominated debt… which they need in order to pay for essential commodities like oil and gas. If, for example, banks begin to regard, say, the British state as sub-prime, they may refuse to accept British gilts as collateral against dollar loans. The result, in addition to the British population being both metaphorically and literally starved (60 percent of our calories are imported) would be a run on the pound which, eventually, could topple national currencies like dominoes.
Read the full post
https://consciousnessofsheep.co.uk/2022/12/31/in-brief-britain-is-broken/
WTI average prices for 2022 are now out:
Jan = 83.22
Feb = 91.64
Mar = 108.50
Apr = 101.78
May = 109.55
Jun = 114.84
Jul = 101.62
Aug = 93.67
Sep = 84.26
Oct = 87.55
Nov = 84.37
Dec = 76.41
2022 average closing price = 94.53.
My prediction for 2022 was $90 while Ovi’s prediction (if he remembers) was $100 so I beat him by a hair. Not bad predictions though.
My prediction was based on the post-Covid recovery of the Word economy. What I hadn’t
counted on was Russia’s invasion of Ukraine, Bidens’ release of SPR oil, China’s lock down of major cities, and dramatically higher interest rates.
My prediction for 2023 is $100/barrel average closing price for WTI. Is anyone else willing to make a prediction?
Frugal
Thanks for reminding me. Yes not bad guesses. I think GS was 120.
Pls repost it on the new post on US October oil.
Thanks
A new thread on US October Oil Production has been posted.
https://peakoilbarrel.com/us-october-oil-production-pushed-higher-by-new-mexico/
A new Open Thread Non-Petroleum has been posted.
https://peakoilbarrel.com/open-thread-non-petroleum-january-1-2023/