Peak Russia + Peak USA means Peak World

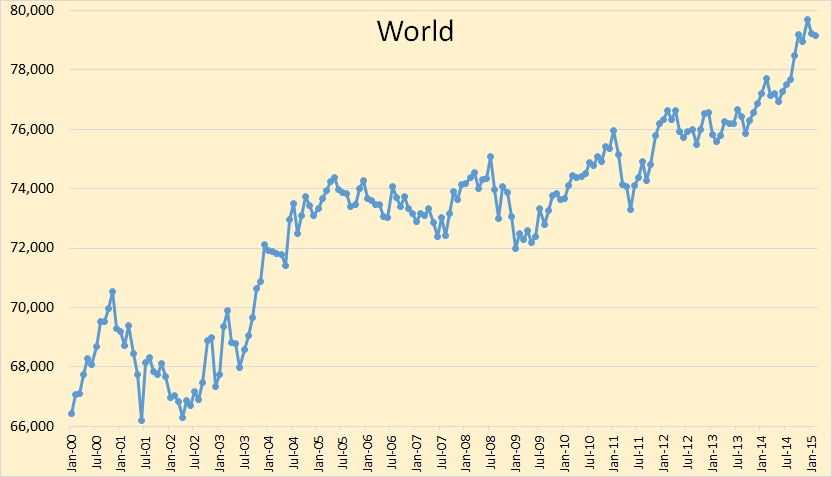
Since around 2005 many countries have increased their oil production but more have decreased. But the combined production of the United States and Russia have kept the world on a slight uptrend since that time.

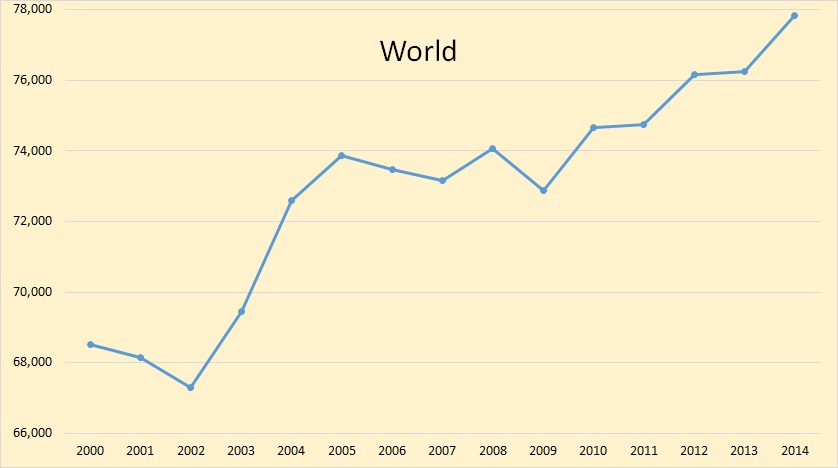
World since 2000

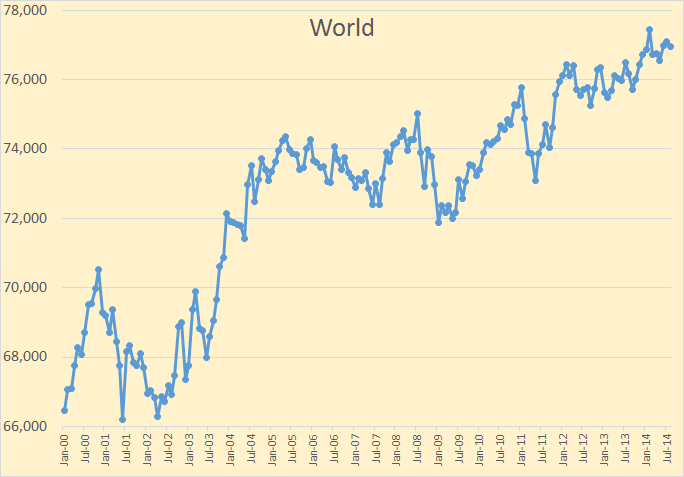
World oil production jumped in 2011, hardly moved at all in 2013 but it was up by more than  1.5 million barrels per day in 2014. And after such a huge gain everyone and their brother were singing “peak oil is dead’. But if you scroll down through the 37 major world oil producers it becomes obvious that a majority of nations have peaked and most of them are in steep decline.

The above chart is EIA data however the next four charts below are JODI data with the last data point February 2015. The data on all charts is thousand barrels per day.

Read More

Worldwide Drilling Productivity Report

The EIA publishes what they call a Drilling Productivity Report in which they claim that each rig is getting more productive, that is each rig produces just a little more oil each month than it did the previous month. But over the long haul, I find that the exact opposite is true. In every place in the world, each rig produces a little less oil every year.

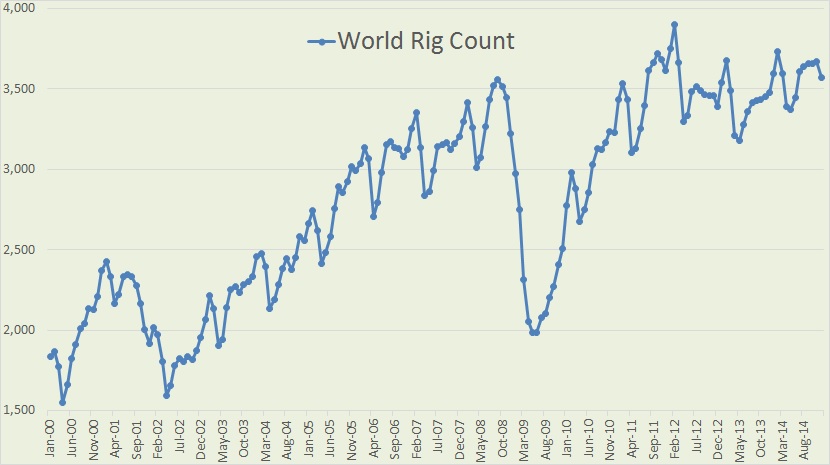
Baker Hughes publishes monthly their International Rig Count where we can find the world rig count back to 1975. However I only looked at the last 15 years and found some surprising results.

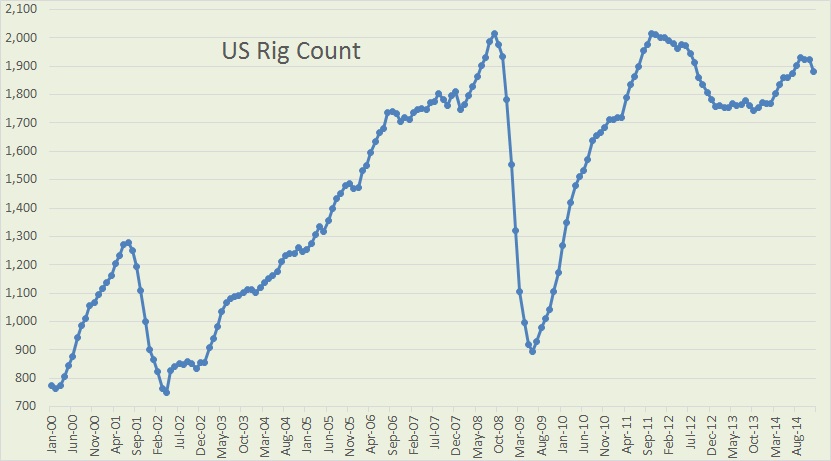
The last “Rig Count” data point on all charts below is December 2014. Also, very important, the rig count includes rigs drilling for gas as well as oil since Baker Hughes does not break down international rigs down to either gas or oil. They just give us the total rig count.World Rig Count

The last price collapse we had, in late 2008, the rig count dropped by over 1,570 between September 2008 and May 2009.US Rig Count

1,114 of that 1,570 rig count decline in 2008 and 2009 came from the US alone. That was the number of rigs dropped by the us between September 2008 and June 2009. Read More

The EIA’s World Oil Production Numbers

The EIA has recently published their International Energy Statistics. Their stats include all liquids such as NGLs, biofuels and even refinery process gain. But I only track actual oil. The EIA does not track “Crude Only” so we are forced to track what they do track which is Crude + Condensate.

The EIA is about four months behind with their world petroleum data. All data in this report has data through August, 2014 and is in thousand barrels per day.

World

World C+C production was down 124,000 barrels per day in August. But according to the IEA it will be up considerably more in September.

Non-OPEC

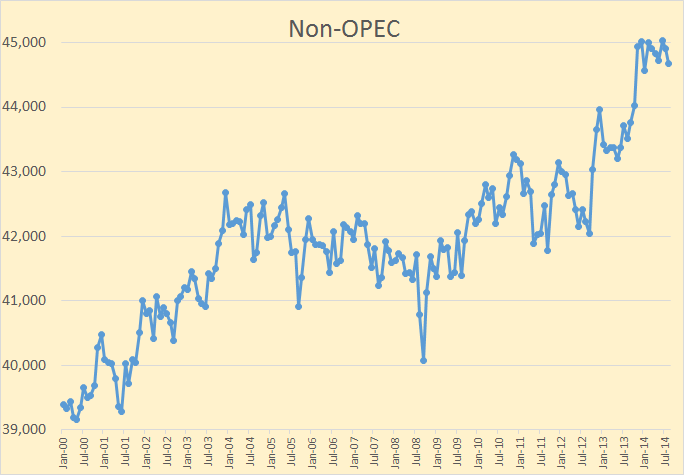
Non OPEC production shot up in November, 2013 but has made no progress since. Though US production has continued to climb, declines in the rest of the world have kept it from increasing.
Read More

Peak Oil and The Blibbit Principle

Podunk was a small town Arkansas. Back about a hundred years ago Podunk had no sewage plant, everyone just used outdoor toilets. But a problem soon developed, Podunk’s water supply became contaminated. That’s when they decided to build a blibbit* in which they would store their crap. This blibbit was built out of wood and placed on a hill in a convenient location, right in the middle of town.

The blibbit was almost circular, about 100 feet in diameter. Poles, similar to utility poles, were placed in the ground about 10 feet apart and boards were nailed to them to form the sides up to about 10 feet high. Then every few days everyone in town would haul their crap to the blibbit and dump it in. After a few years the blibbit was full so they added a few more boards to raise the sides higher.

But then someone noticed that the bottom boards were bulging out and appeared about to rupture. “She’s gonna burst” the person shouted to everyone in town. “Nah, maybe it will hold a bit more” was what most people said.

Then a few years later the blibbit was full again so they nailed a few more boards a little higher up on the poles and continued to dump in their crap. The bottom boards became even more strained and looked like they would pop this time for sure. “She’s gonna burst” a couple of more people started yelling. Naw, that’s what you said five years ago you were wrong. So we should not listen to you.

Then about five years later the blibbit became full again. More boards were added and more crap was dumped in. “She’s gonna blow this time for sure. The blibbit has reached peak crap for sure.” “Listen stupid”, was the reply, “that’s what you said 10 years ago, then again 5 years ago, and you were dead wrong. “And because you were wrong in the past means you have to be wrong now.”

Now here is my question: Because the peak blibbit crap people were wrong in the past, does that mean it is more likely they are wrong now? Or, is it even more likely they are right now because the situation has deteriorated even more since the early days of peak blippit crap predictions?

We are all asked, from time to time, what do we think is going to happen to this or that down the road. No one gets asked that question more than peak oilers. And every peak oiler seems to have a slightly different opinion. I have, in the past, reframed from making predictions as to when crude oil extraction will peak. I did so out of fear that I would be wrong and cornucopians would throw it up to me later. But I have now gone out on a limb and now predict that Crude Oil, or rather C+C will peak no later than 2017. I strongly believe the peak will be in 2016 but it could be a year or two earlier but no later than 2017.

World

In spite of all the hoopla about the US shale boom world C+C has been relatively flat for two years.

Read More