World Oil Production

A guest post by David Archibald

The views expressed in this post do not necessarily reflect the views of Dennis Coyne or Ron Patterson.

The BP Statistical Review of World Energy has oil production data by country up to the end of 2015. This is what that looks like from 1988:

chart/

The United States increased production by 5.1 million barrels per day from 2010 to 2015. The increase in production from countries around the Persian Gulf over the same period was slightly less at 5.0 million barrels per day. The increase in total world production was 8.4 million barrels per day so the rest of the world declined by some 1.7 million barrels per day. This was despite Canadian production rising 1.0 million barrels per day from oil sands developments plus some other increases from Russia, Brazil, Colombia etc. Most oil producing countries are in well-established long term decline or plateau at best. How these trends will interact can approached from a bottom-up basis. To that end, the following graphs show likely production profiles by region for the next five years. Read More

The Future of US Light Tight Oil (LTO)

chart/

The future output from the light tight oil (LTO) sector of the US oil industry is the subject of much speculation. Above I present some possible future output scenarios based on a simple model of US LTO, the scenarios are compared with the EIA’s 2017 Annual Energy Outlook (AEO) reference scenario with cumulative output of 82 Gb from 2001 to 2050. The cumulative output of the model scenarios is for the same period (2001-2050). Read More

Eagle Ford Output Estimate and Future Scenario

Eagle Ford output is difficult to estimate as there are 20-25 separate fields that need to be followed to get a full picture. To save time, I have used Enno Peters’ data for horizontal wells from Districts 1 to 5 in Texas from his website shaleprofile.com, he has data through June.  Enno’s data is combined with the RRC data for statewide C+C output to find the percentage of Texas C+C from the Eagle Ford. This percentage is multiplied by Dean’s estimate for Texas C+C output to get the following estimate, which is compared with Enno Peters’ data.  EF-EP is Enno Peter’s collection of data from the RRC, EF-DC is my estimate using the method described.  Based on a May 2016 Eagle Ford estimate, I subtract 70 kb/d from the EF-DC estimate to account for non-Eagle Ford horizontal well output in Districts 1 to 5

TXchart/

Read More

Texas Oil and Natural Gas Update- Sept 2016

TXchart/

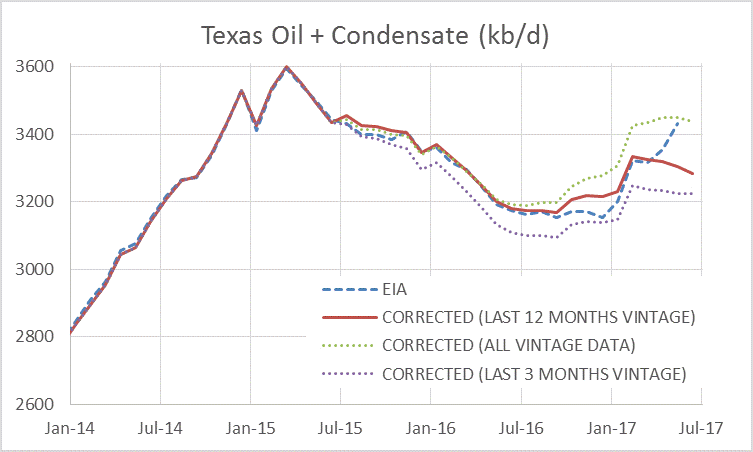
Dean has provided his monthly update for Texas Oil and Natural Gas.  The most recent month’s estimate is often volatile and may be ignored, the June and May estimates are likely pretty good (within 1% and 2%), the April 2016 estimate is likely to be robust(within 1% of the final value). The June EIA estimate is 240 kb/d lower than Dean’s estimate (about 7% too low). Read More

Overview of the Northern Deepwater Gulf of Mexico

by SouthLaGeo

The post that follows is a guest post by SouthLaGeo, a geologist with over 30 years of oil industry experience.

SouthLageo/

In this post, I will address 3 topics relating to the Northern Deepwater Gulf of Mexico –
1. Historical oil production
2. One view of the future of exploration
3. EUR ranges

I will limit my comments to oil production (not gas production). All production data is from BSEE/BOEM. The play outlines on the map are my best estimates. I will be using the BSEE definition of deepwater which includes water depths greater than 1000’. And, I will be assuming a Business As Usual future – by that I mean that fossil fuels will continue to be an important an energy source, and the world will continue to be able to afford them. Read More