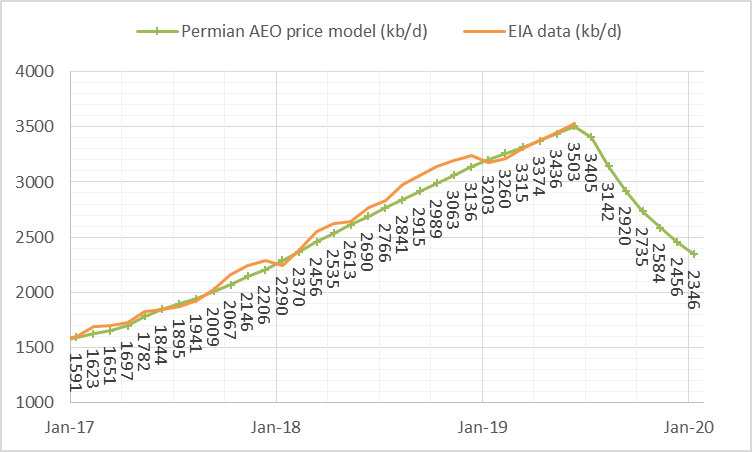
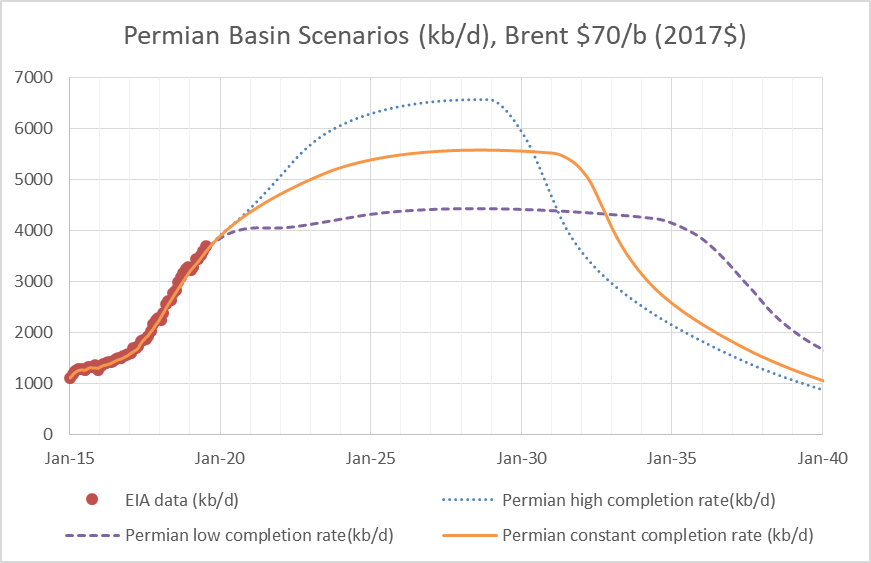
Seems we don’t know what future completion rates will be in the Permian basin or anywhere. There are many different opinions on whether the completion rate might increase, decrease or stay the same. In my view, the conservative assumption is to assume they will not go up or down, but that the completion rate will remain constant. I have created three different scenarios: in the first, the completion rate increases; in the second, the completion rate decreases; the third scenario has a constant completion rate.
Read MoreTag: tight oil
US Tight Oil Legacy Decline and US Tight Oil Scenarios
US tight oil legacy decline can be estimated by assuming no future tight oil completions in the various US tight oil basins. The charts below illustrate such an estimate for the Permian, North Dakota Bakken/Three Forks, Eagle Ford, Niobrara, and other tight oil basins (not included in the previous 4 tight oil basins).
Permian legacy decline is 3405 minus 3142 or 263 kb/d. Read More
US Tight Oil Estimate and Projection to Dec 2019
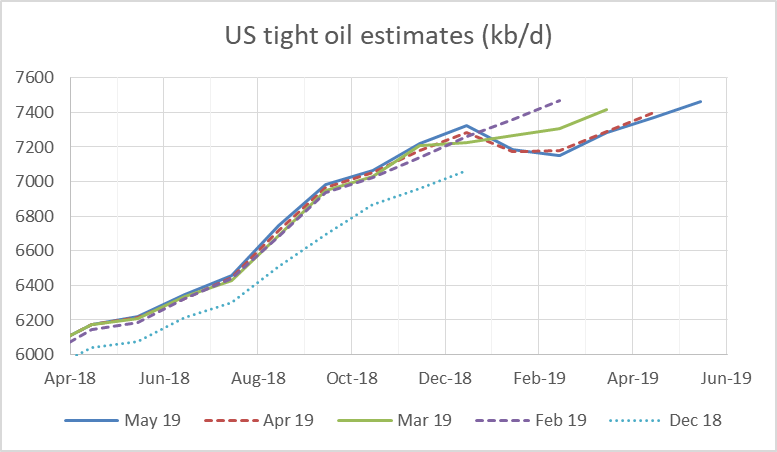
New tight oil estimates were recently released by the EIA. The chart below compares estimates from Dec 2018 to May 2019, where the Dec 2018 estimate is that estimate with the most recent month estimated being Dec 2018 and likewise the May 2019 estimate has May 2019 as the most recent month estimated. The May 2019 estimate is fairly close to the April 2019 estimate with a slight downward revision of the April 2019 estimate from 7399 kb/d to 7368 kb/d, March 2019 was also revised lower by 10 kb/d from 7292 kb/d to 7282 kb/d. For May 2019 the most recent estimate is 7462 kb/d and if past history repeats this estimate may be revised lower next month.
EIA tight oil estimates
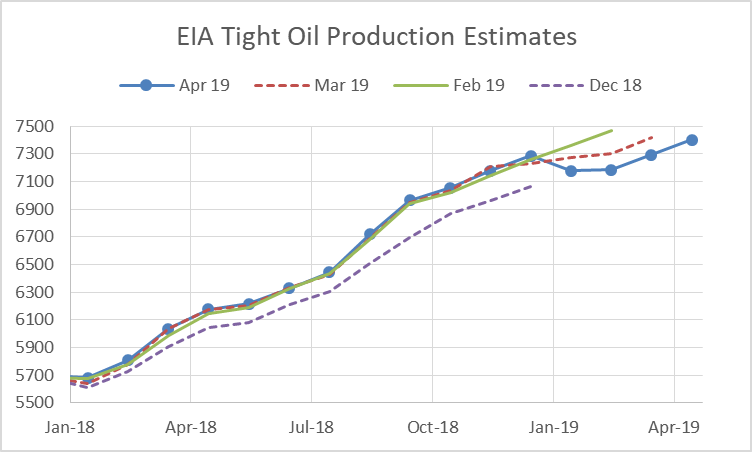
The US Energy Information Administration publishes Tight Oil Production Estimates by Play each month (can be found at link above.) I noticed this month that the estimates seemed different than I remembered so I checked earlier estimates I had saved on my computer. The chart below compares estimates from Dec 2018 to April 2019 (where the last month of data in the estimate is Dec 2018, Feb 2019, March 2019, and April 2019).
Is The Bakken a Bust?
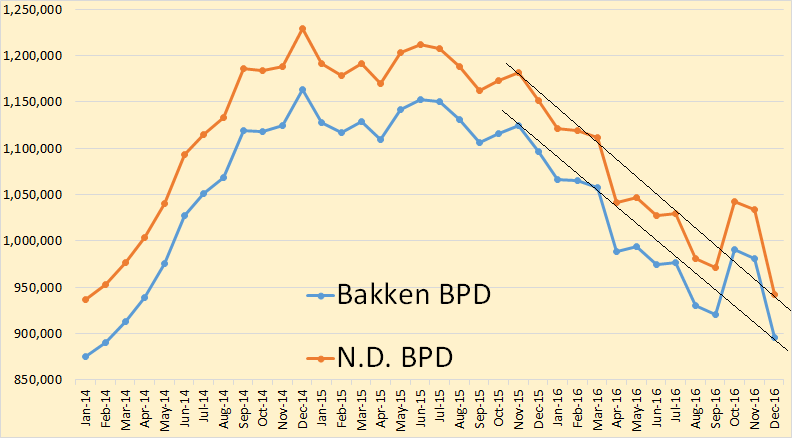
North Dakota has released December production data for the Bakken and for all North Dakota. They were a little shocking.
Bakken production down 86,150 barrels per day 895,330 bpd. North Dakota production down 92,029 bpd to 942,455 bpd. It was noted that this the largest decline ever in North Dakota production. But it should not be overlooked that the October in crease in production was also the largest ever increase in North Dakota production.