Texas RRC Oil & Gas Production

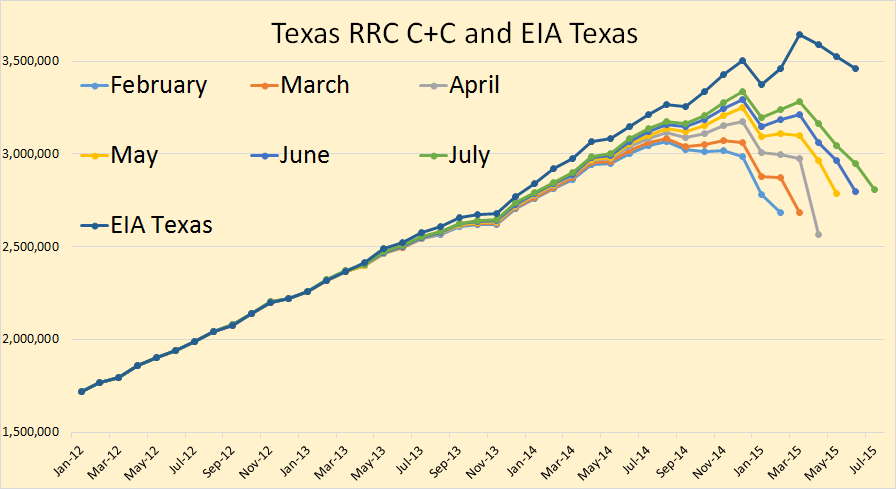
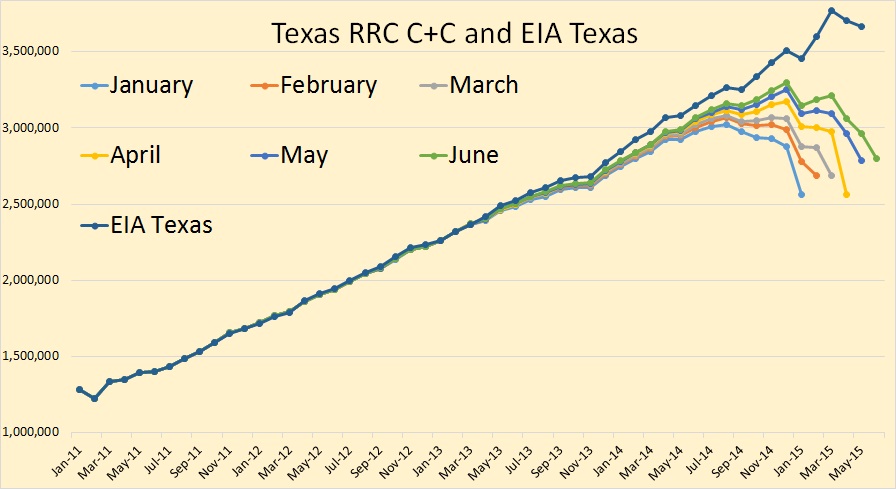
The Texas RRC Oil & Gas Production numbers are out. They came out on a weekend this month. All RRC data is through July. The EIA data is through June. Keep in mind that the RRC data is incomplete, that is why the chart lines droop on the end. However the EIA data is from the EIA’s Petroleum Supply Monthly, the data of which the EIA says now comes directly from the states, and reflects the complete best estimate of oil production.

Texas C+C

According to the EIA data, Texas crude + condensate peaked, so far, in March and declined in April, May and June. However the incomplete data from the RRC shows production likely dropping sharply in April, up in May then flat for June and July.
Read More

Texas Oil and Gas Production for April

The preliminary Texas RRC Production Data is out this morning. There appears to be a considerable drop in Texas crude oil production in April. All Texas RRC data in the charts below is through April 2015 and all EIA data is through March 2015.

For those new to this site, the Texas RRC data is incomplete. The drooping lines will eventually, after the final data comes in, closer resemble the EIA data. Though I believe the EIA data is quite a bit too high at this point.

Texas C+C

It appears that, when the final data comes in that Texas will have took a huge hit in January, recovered somewhat in February and March, then took another hit this past April.

Read More

Texas RRC March Production Data

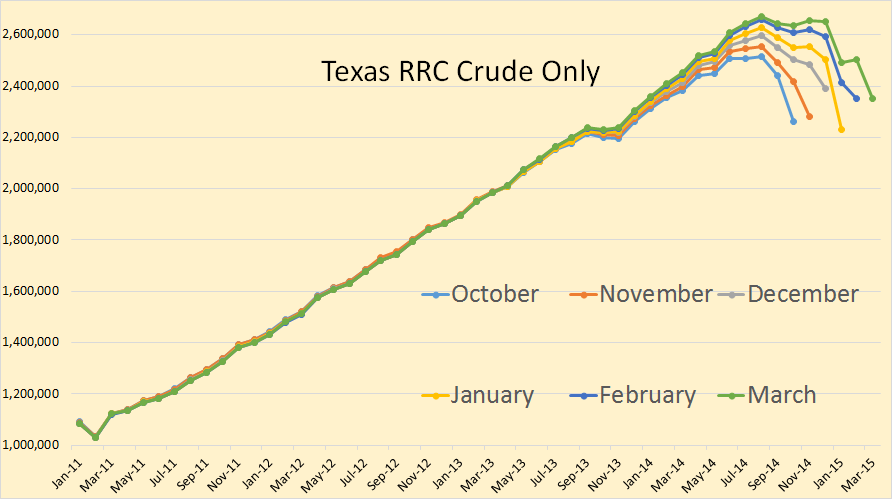
The Texas RRC is out with their latest Oil and Gas Production Data. Looks like oil production has leveled out with March production pretty much level with February. All RRC data is trough March 015.

Texas Crude Only

I always show the last 6 months or the RRC data in order to get a pretty good indication of which way data production is moving. From the data you can see that December was a very good month but January was just awful. February was a lot better and March was about the same as February.

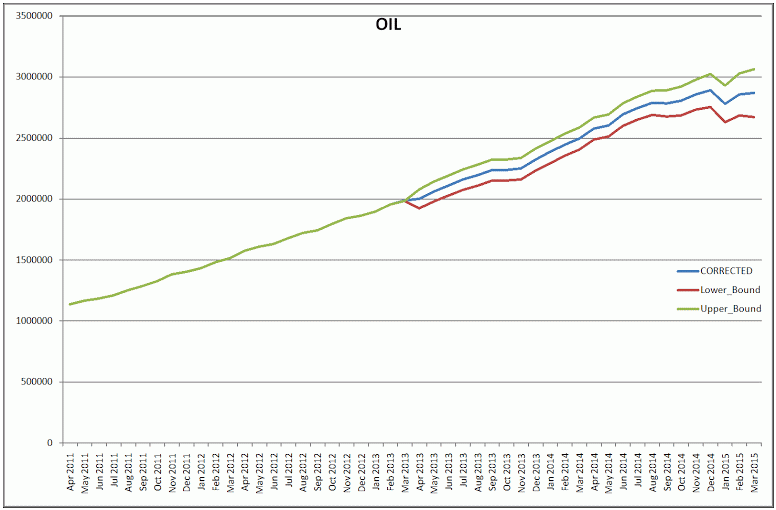
Dean 1

The chart above was created by Dean Fantazzini, PhD, of the Moscow School of Economics. He has developed an algorithm which predicts what the data will reflect after the final data has come in. His data suggests that Texas crude has plateaued.

Read More

Bakken, What Is The Data Telling Us?

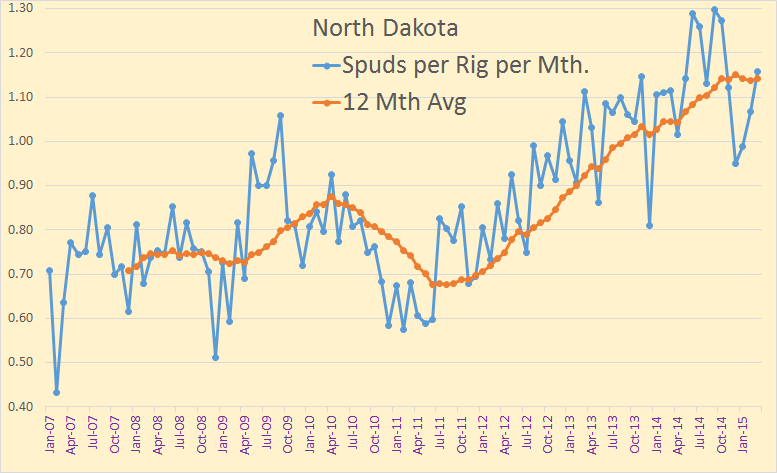
North Dakota publishes, every month, a Monthly Statistical Update from which we can gather a wealth of data if we dig deep enough. They publish the number of spuds, that in new wells started, each month, along with the average number of rigs that month. From this we can glean the average number of days each rigs spends on each well.

Spuds per Rig

The last data point is March, 2015. Through 2011 a rig could drill about .75 wells per month, or about 40 days spud to spud. Today that figure is about 1.14 wells per month or about 26.3 days spud to spud.

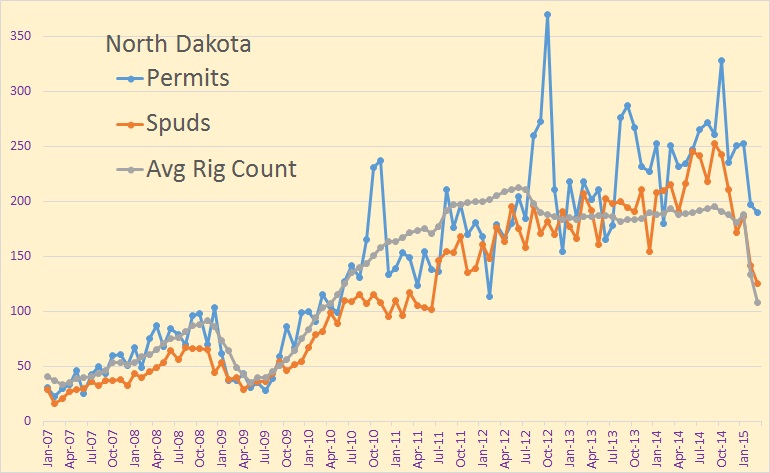
Permits & Spuds

Again, the data is through March. We can see the falloff of spuds, rigs and permits in February and March. April and May should show a further decline in all three.

Read More