All data for this post is from the EIA’s
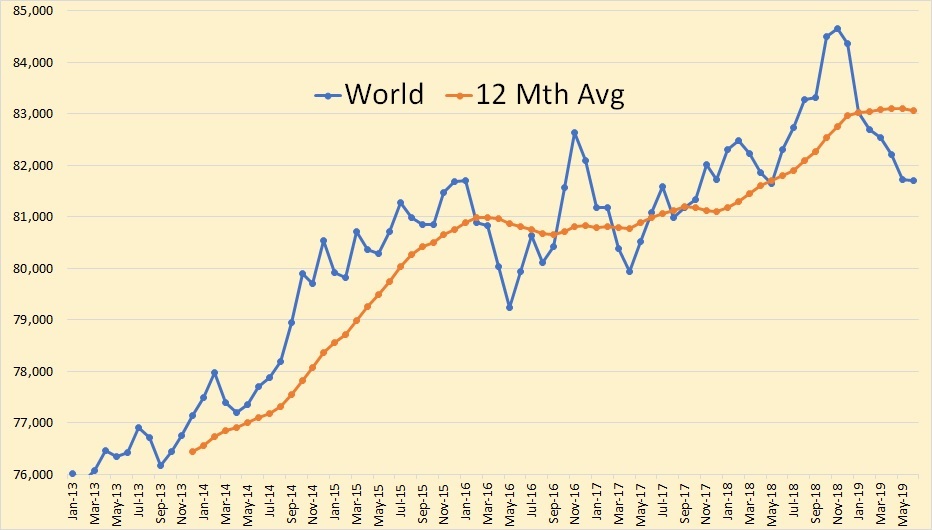
Petroleum Supply MonthlyAll USA data is through July and the World data is through June 2019. All data is in thousand barrels per day.

All data for this post is from the EIA’s
Petroleum Supply MonthlyAll USA data is through July and the World data is through June 2019. All data is in thousand barrels per day.

Comments related to oil and natural gas production in this thread. Thank you.
by Dennis Coyne
I have updated my scenarios for US LTO output, based on both EIA tight oil output data and average well profile data from Enno Peters’ shaleprofile.com. I have also created a scenario for the Niobrara shale oil play and for “other US LTO” which excludes the Permian Basin LTO, Eagle Ford, North Dakota Bakken/Three Forks, and the Niobrara.

(Details for the chart above are explained in the post.)
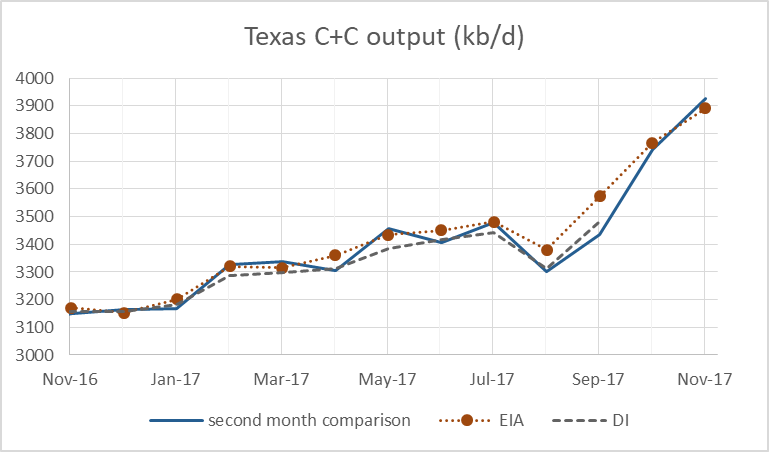
The Texas Railroad Commission (RRC) had the oil and gas production reported online in early 2005, and became fully online for producers and the public on Feb 14, 2005. At the time it was set up, it required the producers to input their production in the production file for existing approved leases, and in the pending lease data file for those leases which have not yet received an approved lease number by the RRC. Each month, the RRC only reports the oil and condensate that is currently updated that month which is in the production file.
Historically, the production did not seem to be completely reported. The lag time to near full reporting of RRC production went from almost 18 months, down to about nine months within the past two years. Even at nine months it leaves interested parties trying to find some way to estimate what current Texas oil production is. Read More

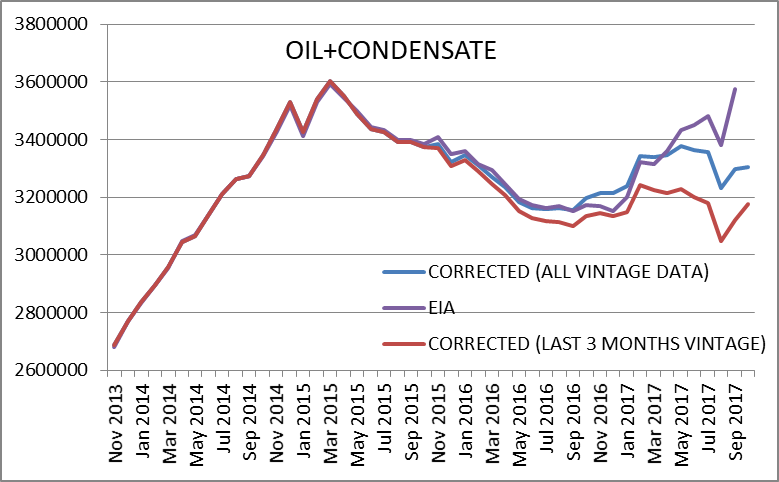
Dean Fantazzini’s estimate for the recently updated RRC data in two charts. For all vintage oil plus condensate estimate (using all RRC data from April 2014 to Oct 2017), Sept17 is 3296 kb/d and Oct17 is 3305 kb/d. Read More