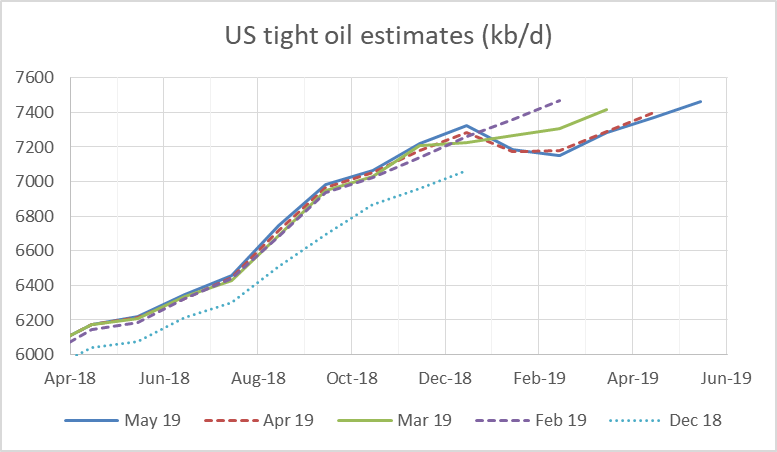
New tight oil estimates were recently released by the EIA. The chart below compares estimates from Dec 2018 to May 2019, where the Dec 2018 estimate is that estimate with the most recent month estimated being Dec 2018 and likewise the May 2019 estimate has May 2019 as the most recent month estimated. The May 2019 estimate is fairly close to the April 2019 estimate with a slight downward revision of the April 2019 estimate from 7399 kb/d to 7368 kb/d, March 2019 was also revised lower by 10 kb/d from 7292 kb/d to 7282 kb/d. For May 2019 the most recent estimate is 7462 kb/d and if past history repeats this estimate may be revised lower next month.
Tag: shale oil
Open Thread Petroleum, April 17, 2019
Comments related to oil and natural gas production and closely related subjects in this thread. Thanks.
“Shale companies from Texas to North Dakota have been managing their wells to maximize short-term oil production. That has long-term consequences for the future of the American energy boom. By front-loading the wells to boost early oil output, many companies have been able to accelerate growth. But these newer wells peter out more quickly, so companies have to drill new ones sooner to sustain their production. In effect, frackers have jumped on a treadmill and ratcheted up the speed, becoming ever more dependent on new capital to keep oil production humming, even as Wall Street is becoming more skeptical of funding the industry.” Rebecca Elliot, The Wall Street Journal (4/8)
OPEC + Russia through March 2019, in thousand barrels per day.
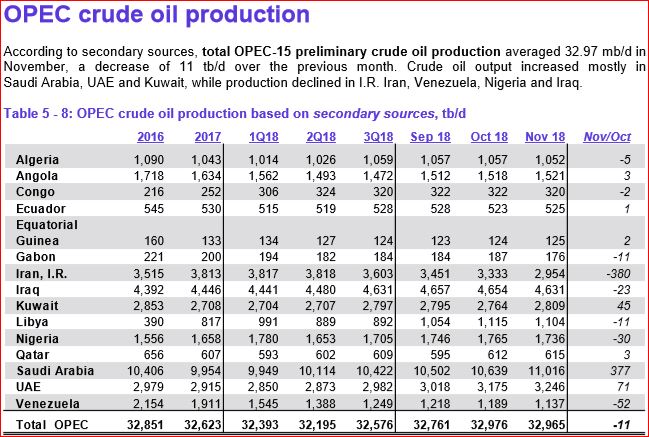
OPEC November Production Data
All the below OPEC data is from the latest OPEC Monthly Oil Market Report. The data is in thousand barrels per day and is through November 2018.
OPEC 15 was down 11,000 barrels per day in November but that was after October production was revised upward by 67,000 bpd.
OPEC production was 32,965,000 barrels per day in November. The revised October numbers, 32,976,000 was an all time high.
US Light Tight Oil (LTO) Update
by Dennis Coyne
I have updated my scenarios for US LTO output, based on both EIA tight oil output data and average well profile data from Enno Peters’ shaleprofile.com. I have also created a scenario for the Niobrara shale oil play and for “other US LTO” which excludes the Permian Basin LTO, Eagle Ford, North Dakota Bakken/Three Forks, and the Niobrara.
World Oil Production
A guest post by David Archibald
The views expressed in this post do not necessarily reflect the views of Dennis Coyne or Ron Patterson.
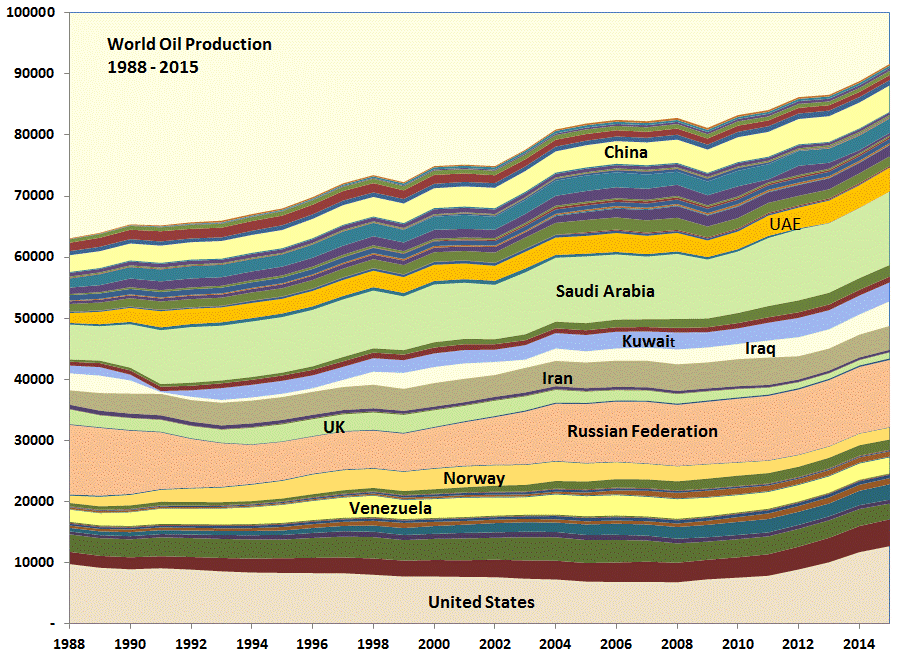
The BP Statistical Review of World Energy has oil production data by country up to the end of 2015. This is what that looks like from 1988:
The United States increased production by 5.1 million barrels per day from 2010 to 2015. The increase in production from countries around the Persian Gulf over the same period was slightly less at 5.0 million barrels per day. The increase in total world production was 8.4 million barrels per day so the rest of the world declined by some 1.7 million barrels per day. This was despite Canadian production rising 1.0 million barrels per day from oil sands developments plus some other increases from Russia, Brazil, Colombia etc. Most oil producing countries are in well-established long term decline or plateau at best. How these trends will interact can approached from a bottom-up basis. To that end, the following graphs show likely production profiles by region for the next five years. Read More