Texas RRC October Oil & Gas Report

The Texas Railroad Comission has updated their Oil & Gas Production Data Query to include the production numbers for October. The Texas data is always incomplete so the charts all look like there is a big decline in the last few months. This is not the case, the charts only reflect the data that has been received and the production numbers will look a lot more positive after several months.

That being said there is something that can be gleaned from these numbers. Even though the data is incomplete, if production is increasing then last months incomplete numbers should be higher than this months incomplete numbers. Using that logic, there seems to have been a strong slowdown in Texas oil and gas production.

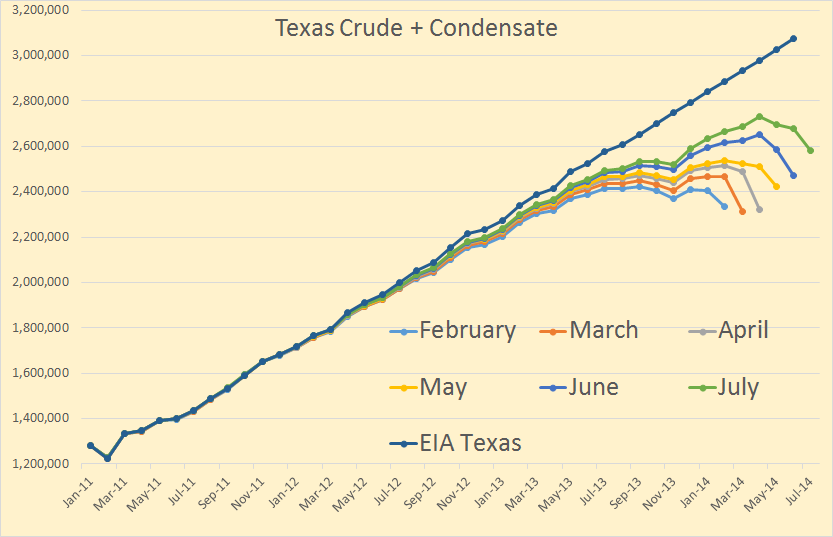
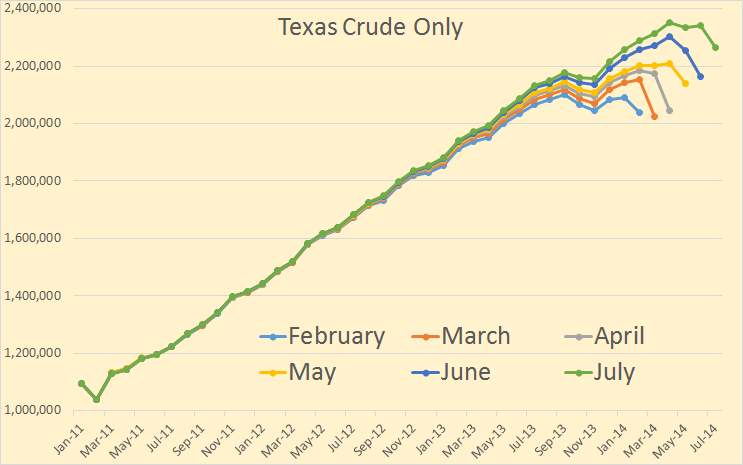
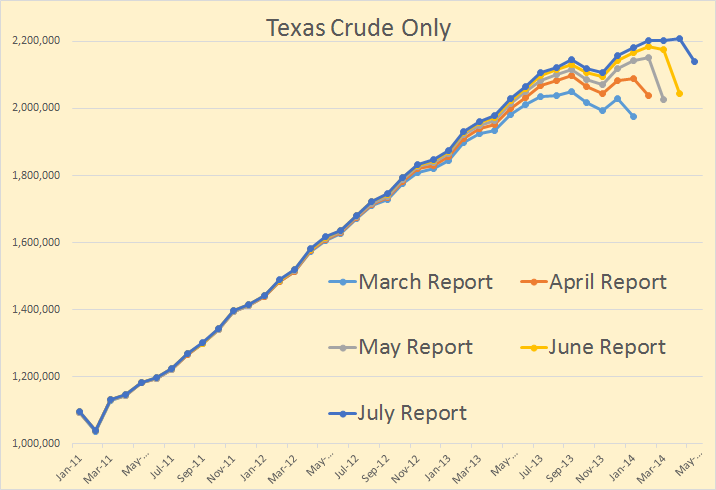
All the last data points are October and is in barrels per day.

Texas Crude Only

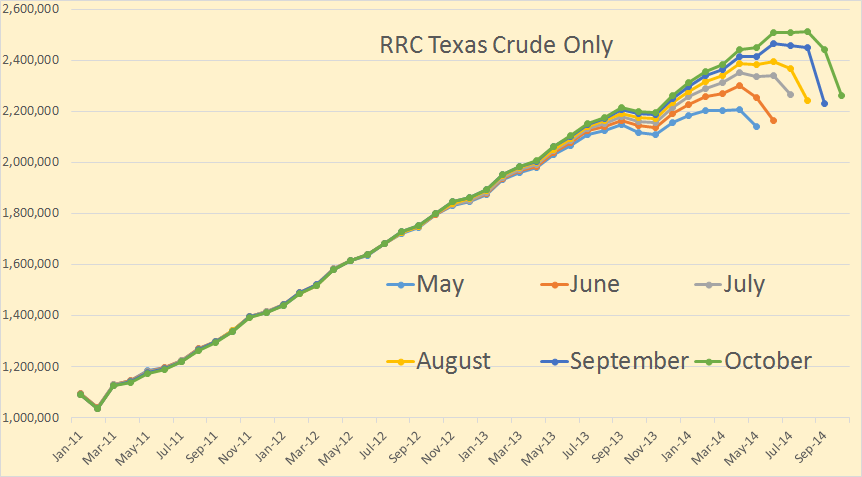
In June and July there was a strong increase in production reported to the Tesas RRC by the oil companies. But in August, September and October things slowed down considerably.

Texas Condensate

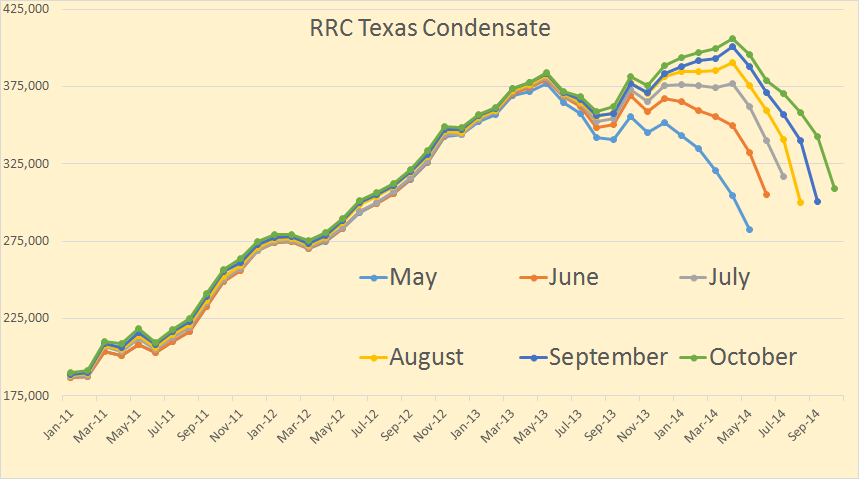
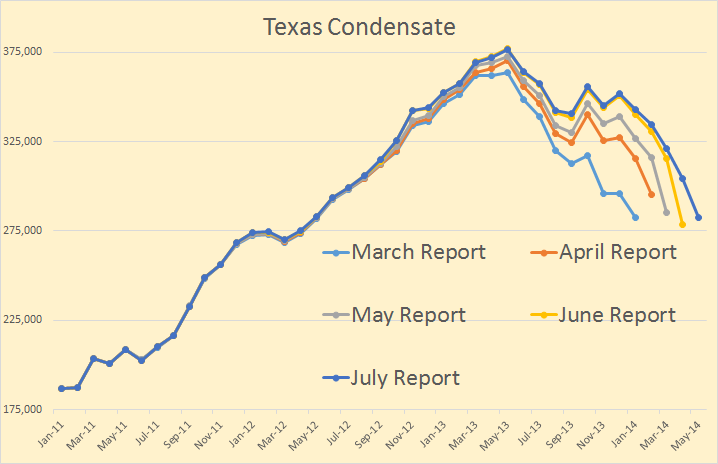
Texas condensate production has slowed down a lot more than crude. Most Texas condensate comes from their natural gas wells but there are a some wells in the Eagle Ford that produces mostly just condensate.
Read More

Texas RRC Data September Report

The Texas RailRoad Comission released their Oil & Gas Production Data with production data through July 2014. The data was actually released Thursday but was all messed up. They corrected their mistake Friday except for condensate. Then yesterday they updated everything. As I have stated before, the RRC data, for the last several months, is incomplete. Nevertheless we can gather some indication of what is happening.

Texas C+C

Texas C+C is still increasing at a pretty hefty clip. The EIA data is just an estimate of course but I think it is pretty close to what the data will show when it is all in. I have included six months of data to show how it is increasing month to month.

Texas Crude Only

Texas crude only was down in October and November but has been up every month since. The declines in the last few months is due to incomplete data.

Read More

The EIA’s Drilling Productivity Report

The Eia’s latest Drilling Productivity Report is out. However they have only updated the PDF file. The spreadsheets have not been updated and still have last month’s data. But I will give you what the PDF file shows and perhaps add some charts tomorrow if they get around to updating the Excel spreadsheets.

DPR 1

The EIA says Bakken new wells will produce 100,000 bpd in October but all the old wells will decline by 73,000 bpd and leave a net increase of 27,000 bpd. If these numbers are correct and September production was 1,152,000 bpd then that means the monthly decline rate is 6.33%.

DPR 2

The EIA says Eagle Ford new wells will produce 154,000 bpd in October but all the old wells will decline by 123,000 bpd and leave a net increase of 31,000 bpd. If these numbers are correct and September production was 1,551,000 bpd then that means the monthly decline rate is 7.93%.
Read More

Texas RRC July Oil and Gas Report with May Production Numbers

The Texas Rail Road Commission has just released their Oil & Gas Production Data through May. There are four categories of data, Crude, Condensate, Gas Well Gas and Casinghead Gas. Casinghead gas is what most folks call Associated Gas. That is gas that comes up with the oil in oil wells.

On all oil charts the July Report has data through May 2014 and is in barrels per day. Also the last month, May in this case, is always exaggerated on the low side. That is the data is incomplete back to about two years. But the last month is always far more incomplete than the previous months.

Texas Crude Only

This data is of course incomplete but even from the incomplete data we can get an idea of the average monthly increase. I calculate that Texas Crude only is increasing at about 40,000 barrels per day per month.

Texas Condensate

I think Texas Condensate peaked back in May of 2013 and is now declining at about 500 bp/d per month.
Read More

EIA’s Drilling Productivity Report

Note: Just as I was finishing this post North Dakota published their production numbers for May 2014. North Dakota production was up over 36,000 barrels per day on 227 new well completions according to The Director’s Cut. I will have a post on all that tomorrow.

The EIA’s Drilling Productivity Report has just came out. Below are a few charts gleaned from that report. The World’s seven largest publicly owned oil companies have peaked. Their combined production has declined 12.4% since 2009.

The Drilling Productivity Report shows, or tries to show, the true decline rate of shale oil and gas. I usually only track the oil however.

Bakken Legacy Decline

In January the EIA estimated that Bakken production from new wells would equal 88 kb/d. They estimated that the declines of all older wells would equal 63 kb/d leaving net production at 25 kb/d.

In August they estimate that Bakken production from new wells will equal 90 kb/d or 2 kb/d above January new well production. They estimate that the decline from older wells will equal 73 kb/d, an increase of 10 kb/d from January, leaving a net increase in production of 17 kb/d.

Eagle Ford Legacy Decline

Eagle Ford fared a bit different. In January they thought new well production would increase by 120 kb/d while older wells would decline by 91 kb/d leaving net production 29 kb/d. In August they expect production from new wells will equal 140 kb/d, a whopping 20 kb/d over January numbers. However decline from older wells will have increased to 115 kb/d, 24 kb/d more than it was in January, leaving net production up 25 kb/d. So in spite of the 20 kb/d increase over January new well production, net production will still be 2 kb/d lower than January.
Read More