Eagle Ford, Permian Basin, and Bakken and Eagle Ford Scenarios

This is a guest post by Dennis Coyne

Increased oil output in the US has kept World oil output from declining over the past few years and a major question is how long this can continue. Poor estimates by both the US Energy Information Administration (EIA) and the Railroad Commission of Texas (RRC) for Texas state wide crude plus condensate (C+C) output make it difficult to predict when a sustained decline in US output will begin.

 About 80 to 85% of Texas (TX) C+C output is from the Permian basin and the Eagle Ford play, so estimating output from these two formations is crucial. I have used data from the production data query (PDQ) at the RRC to find the percentage of TX C+C output from the Permian (about 44% in Feb 2015) and Eagle Ford plays (40% in Feb 2015).

Dean’s estimates of Texas C+C output are excellent in my opinion and are close to EIA estimates through August 2014. I used EIA data for TX C+C output through August 2014 and Dean’s best estimate from Sept 2014 to Feb 2015. By multiplying the % of C+C output from the RRC data with the combined EIA and Dean estimate, I was able to estimate Eagle Ford and Permian output. The chart below shows this output in kb/d.

  
blog150427/

Read More

Texas RRC February Production

The Texas Railroad Commission has released its  incomplete production data for February.  The RRC also estimates final production but that data has not been posted yet.

All Texas RRC data is through February. The EIA data is through January.

Texas C+C

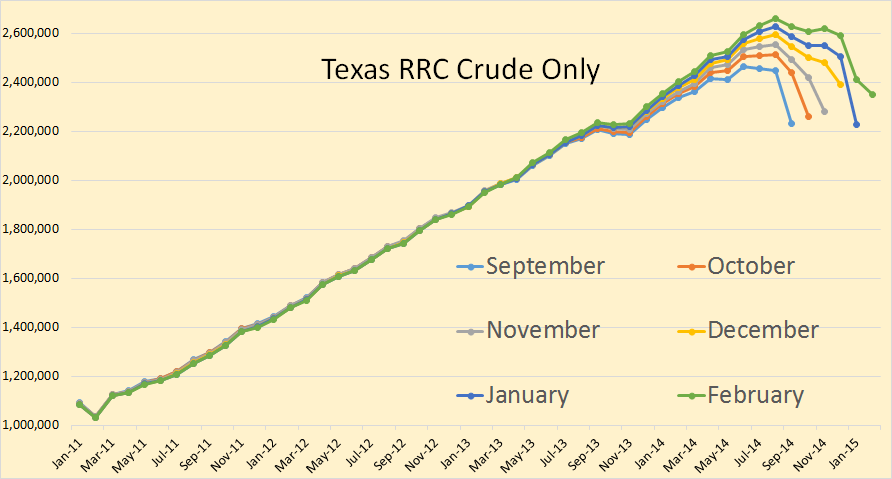
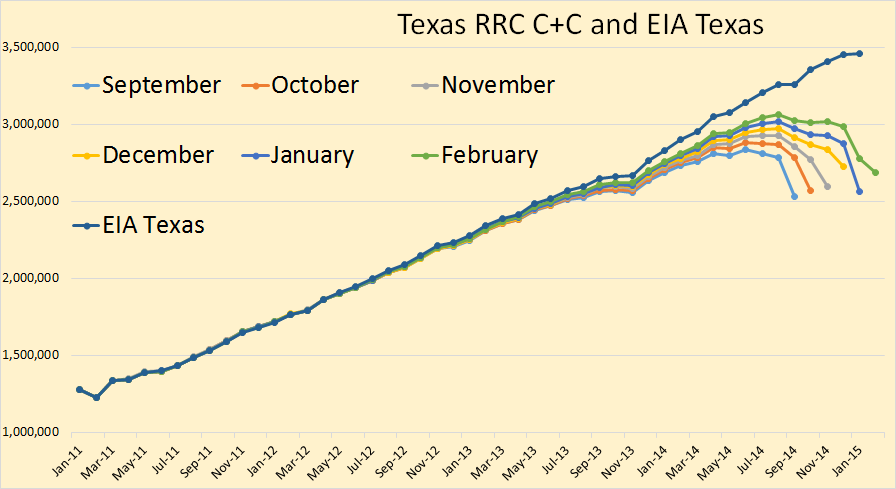
It looks like, after the final Texas data comes in, that February crude oil will be above January production but still below December production. It is my best guess that Texas production will be down about 80,000 barrels per day in January and up about 50,000 bpd in February or about 30,000 bpd below December production.

Texas Crude Only

I always post the last six months data just so we can get some idea of the general trend. You can see the general trend is up until January when it took a huge hit and only partially recovered in February.

Read More

EIA’s April Drilling Productivity Report

The EIA just released its Drilling Productivity Report for April. In this report they have post what they expect the shale production data will look like through May 2015.

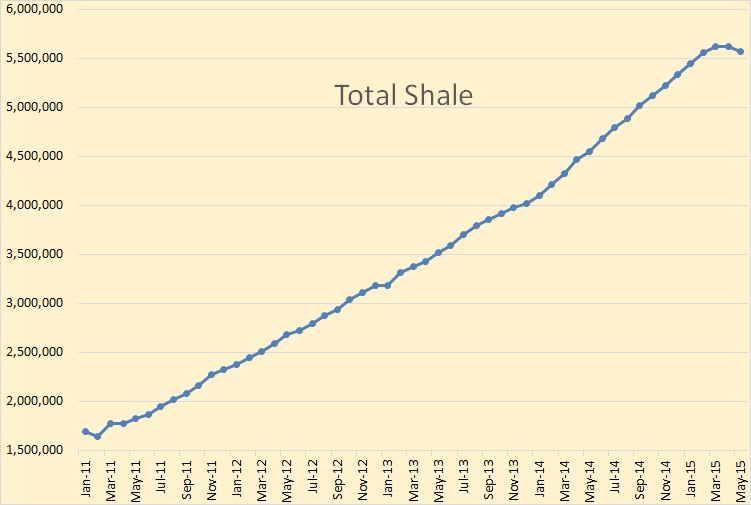
DPR Total Shale


The EIA is expecting a rounded top for shale production. They are expecting a big drop of total shale production in May to the tune of 56,673 barrels per day. In April they had total shale production down 2,098 bpd.

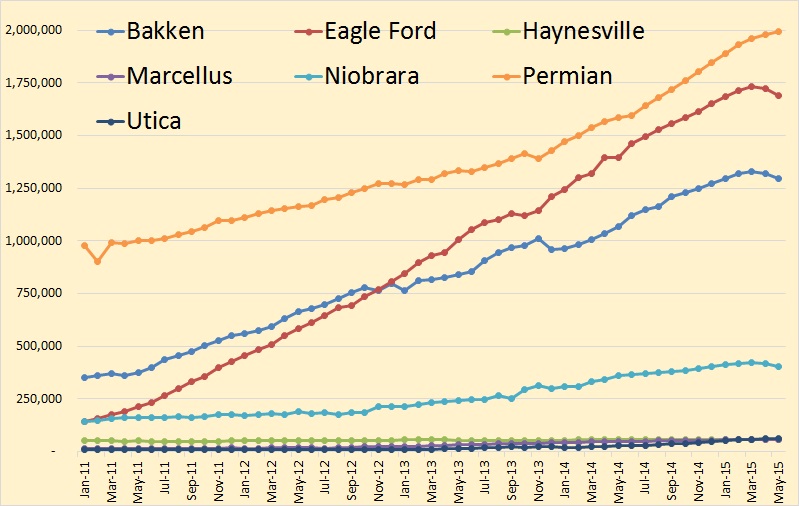
DPR by Basin

The EIA has Bakken, Eagle Ford and Niobrara down but still has the Permian up by 10,647 bpd.

Read More

Texas RRC Report and Other Peak Oil News

The Texas Rail Road Commission has released its latest stats with production numbers through January. There is always a delay in these numbers and that is why you see the production graph lines seem to droop toward the recent months. Because of this I post six months data so the data can be compared in order to gain a better insight into which way production is heading.

All Texas oil and gas data is through January. The Oil data is in barrels per day and the gas data is in MCF.

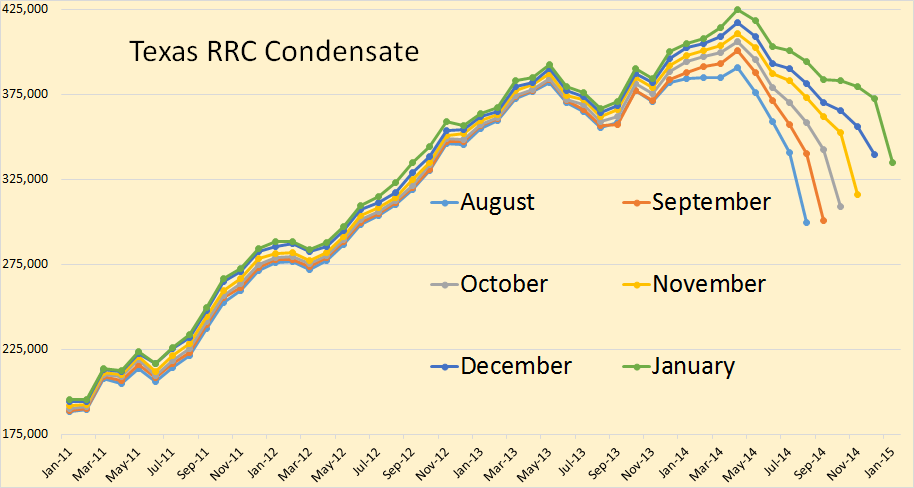
Texas Condensate

Texas condensate will likely show a small gain when the data is finally in. Either way it will not be enough to make much difference in the final C+C January production.

Texas Crude Only

I believe Texas crude only will be down in January. This shows a huge decline from the December incomplete data. The EIA data is through December only.

Read More

US Rig Count by Location

Baker Hughes publishes a weekly oil and gas rig count by producing basin. I have created charts of all the most productive basins in order that we can see where oil and gas rigs are increasing or decreasing. Their historic rig count, by basin, goes back 4 years.

It needs to be noted that Baker Hugs does not count rigs that are not actively drilling. Rigs that are “Moving In, Rigging Up” are not counted in the Baker Hughes count though they are counted by some others including the North Dakota Industrial Commission.

All rig counts are of Friday, February 27, 2015.

Rig Count Total USBut first, total US weekly rig count. The oil rig count stands at 986, down 623 from a high of 1,609 in October. The gas rig count stands at 280, down 656 rigs from the high of 935 in October of 2011. However this data base goes back only 4 years. The all time high for gas rigs was 1,606 in September of 2008. The 1,609 oil rig count in October 2014 was an all time high for oil rigs. That record is valid only back to the days when Baker Hughes began separate stats for oil and gas rigs however.

Rig Count Eagle Ford

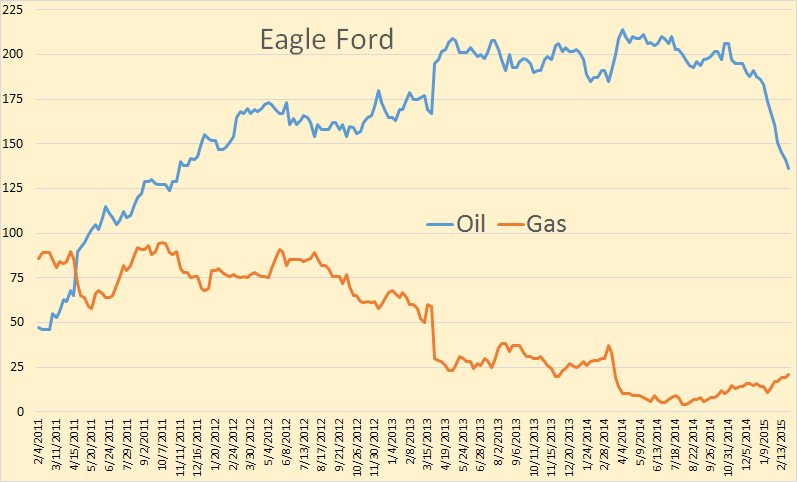
Eagle Ford oil rigs currently stand at 136, down from a high 214 in April 2014. Gas rig count is 21, down from 95 in October 2011.

Read More