The EIA’s International Energy Statistics 2

The EIA, a few days ago posted their International Energy Statistics. They publish lots of statistics here but on monthly basis I only follow their  production of world Crude Oil including Lease Condensate.

The data on all charts below is Crude + Condensate production through July 2014 and is in thousand barrels per day.

World

World C+C production was up 168,000 bpd to 77,023,000 bpd. The high, so far, was in February at 77,409,000 bpd.

Non-OPEC

Non-OPEC C+C was down 135,000 bpd from it high so far. It has been on a 9 month plateau high.

Read More

The EIA’s International Energy Statistics

The EIA, a few days ago posted their International Energy Statistics. They publish lots of statistics here but on monthly basis I only follow their  production of world Crude Oil including Lease Condensate.

The data on all charts below is Crude + Condensate production through July 2014 and is in thousand barrels per day.

World

World C+C production was up 168,000 bpd to 77,023,000 bpd. The high, so far, was in February at 77,409,000 bpd.

Non-OPEC

Non-OPEC C+C was down 135,000 bpd from it high so far. It has been on a 9 month plateau high.

Read More

OPEC October MOMR and other news

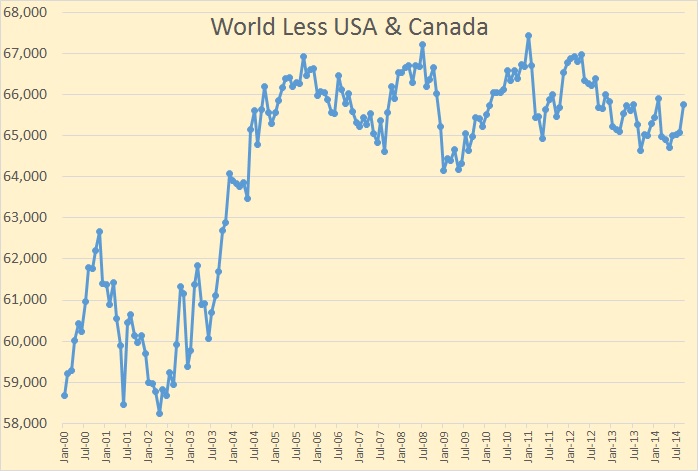
The OPEC Monthly Oil Market Report has just came out with OPEC production data for September 2014. All production numbers are in thousand barrels per day with the last data point September 2014.
OPEC 12

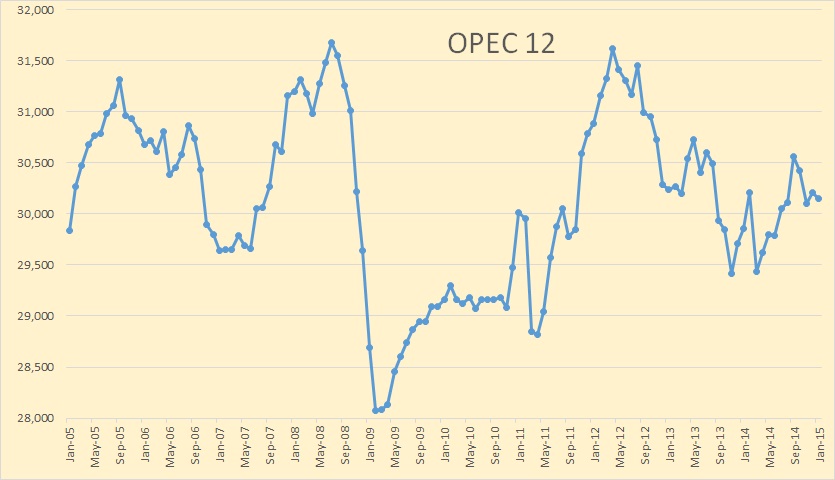
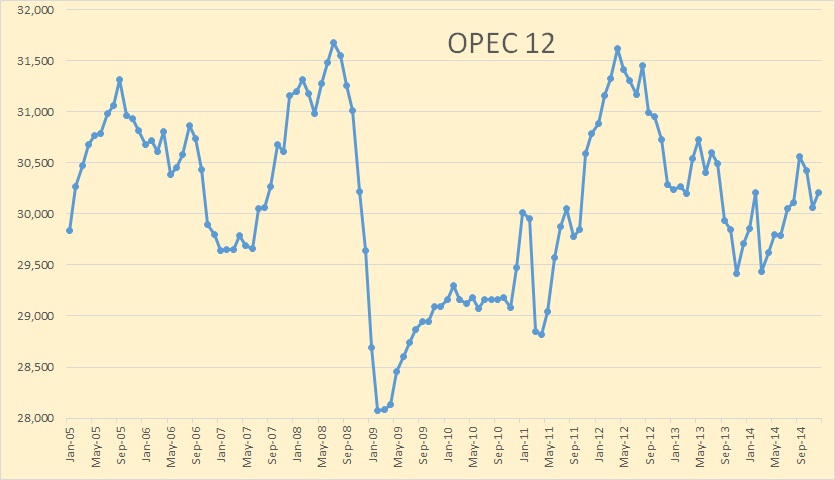
The August production numbers were revised down 275,000 bpd from 30,347 kbd to 30,054 kbd. Current OPEC 12 production stands at 30,474 kbd, up 402 from the revised numbers.

Saudi Arabia

Saudi Arabia’s August production numbers were revised down 202 kbd. With that revision they are down another 50 kbd in Septemer to 9,605 kbd.

Read More

OPEC Annual Statistical Bulletin + MOMR

The August OPEC Monthly Oil Market Report is out with the OPEC production numbers for July 2014. There were no big surprises and only small revisions in the June data.

OPEC 12

The OPEC 12 was up  166,000 barrels per day. The increase was due to some Libyan oil coming back on line.

Libya

Libyan crude only was up 206 kbd to 438 kbd. Libya was up and down all the month of July and is now down again. From the Wall Street Journal: Risks Remain to Libya’s Oil Supply Despite Reopening of Ports, Fields Behind a pay wall but accessible via Google.

Following an end to protests by a local ethnic group at the country’s largest oil field, called Sharara, Libya’s oil production surged to a five-month high in mid-July to about 600,000 barrels a day—one third of which came from Sharara…

A week after the fighting broke out Libya’s state-owned National Oil Co. acknowledged the country’s output had fallen back by around 100,000 barrels a day.
Read More

World Crude Oil Exports

OPEC has released their Annual Statistial Bulletin 2014. Under the heading of “Oil and Gas Data” there are several tables you can download. I was excited to find one labeled “Table 3.21: World Exports of Crude Oil and Petroleum Products by Country”. It turned out to be useless however as it includes a lot of exports of imported products. And they have no table of “Net Imports”. However their their table labeled Table 3.18: World Crude Oil Exports by Country” turned out to be very useful as it seems to measure the same thing as the EIA does in their International Energy Statistics, Crude Oil Exports which also includes lease condensate.

The OPEC export data goes back to 1960 but I have only plotted it from 1990. The EIA data only goes back to 1993. The OPEC data is through 2013 while the EIA data only goes through 2010 except for Canada, Mexico and Norway which goes through 2012. All data is in thousand barrels per day.

World Exports

World crude oil exports peaked in 2007 and now stand 42,297,000 bp/d and in 2013 stood 2,467,000 bp/d below that point. World crude oil exports in 2013 were 2,467,000 barrels per day below peak and at the lowest point in 10 years.

OPEC Exports

OPEC exports peaked, so far, in 2012 at 25,068,000 barrels per day. Their exports fell by just over 1,000,000 barrels per day last year and I am betting they will fall further this year.

Non OPEC Exports

Non-OPEC exports have taken a hit in the last few years, peaking in 2004 and are down just under three million barrels per day since then.

Read More