Comments not related to oil and natural gas production in this thread, please.
Tag: OPEC
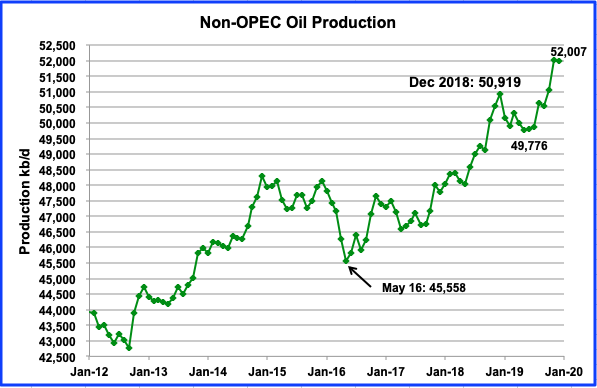
Non-OPEC Oil Production Punches New High
A post by Ovi at peakoilbarrel
As I wrote in my previous post, preparing these last two has been a surrealistic exercise. The oil market environment for this post has been even more surrealistic than the previous one and the associated futures contract prices have been extremely volatile this week. The May WTI front month contract went negative on April 20 for the first time ever and closed at negative $37.63/bbl while the June contract closed at $20.43. Today’s settled price, April 24, for the June contract is $16.94.
On April 7th, OPEC + finalized a record oil production cut of 9.7 Mb/d after days of discussion. The 9.7 million bpd cut will begin on May 1 and will extend through the end of June. The cuts will then taper to 7.7 million bpd from July through the end of 2020, and 5.8 million bpd from January 2021 through April 2022. The 23-nation group will meet again on June 10 to determine if further action is needed.
The lone hold out to the deal was Mexico which was expected to cut 400 kb/d but would only agree to 100 kb/d. This was a real Mexican standoff and Mexico won because they had hedged their oil output and the more the price dropped, the more they made on their hedges. According to this report, they hedged their oil at $49/bbl in January. It was unclear how many barrels were hedged or how much was spent.
Read MoreOPEC March 2020 Production Data
All OPEC data reflected in the charts below are from the April edition of the OPEC Monthly Oil Market Report. https://momr.opec.org/pdf-download/ The data in in thousand barrels per day and all data is through March 2020.
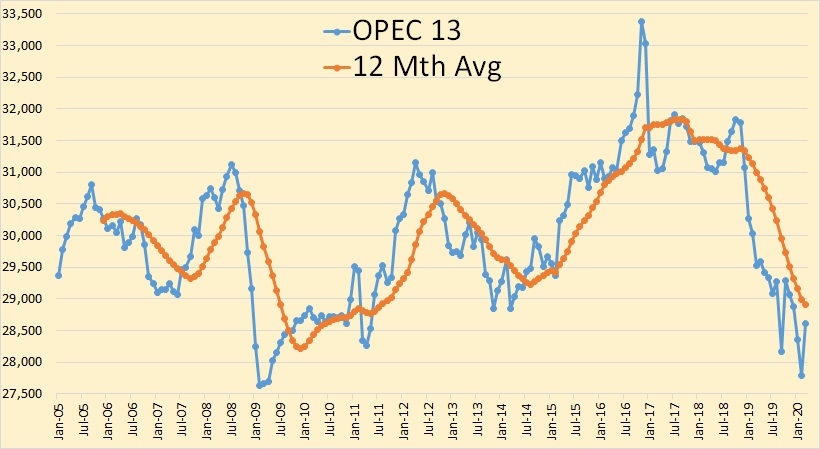
Though OPEC 13 was up 821,000 barrels per day in March it was still the fourth lowest month in 9 years.
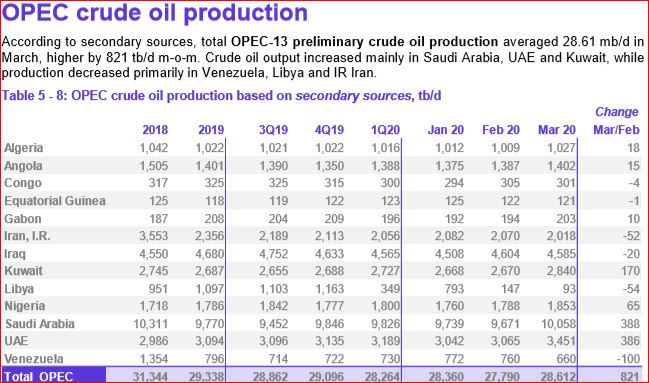
Iran, Libya, and Venezuela are exempt from the agreed on cuts. These three were down a combined 206,000 barrels per day. Those subject to cuts, were up a combined 1,026,000 barrels per day.
Read MoreOPEC February Production Data
All OPEC data below is from the OPEC Monthly Oil Market Report. It is thousand barrels per day and is through February 2020.

The OPEC data no longer includes Ecuador. OPEC 13 was down 546,000 barrels per day in February.

The only major decliners were Libya and Saudi Arabia.
Read MoreOPEC January Production Data
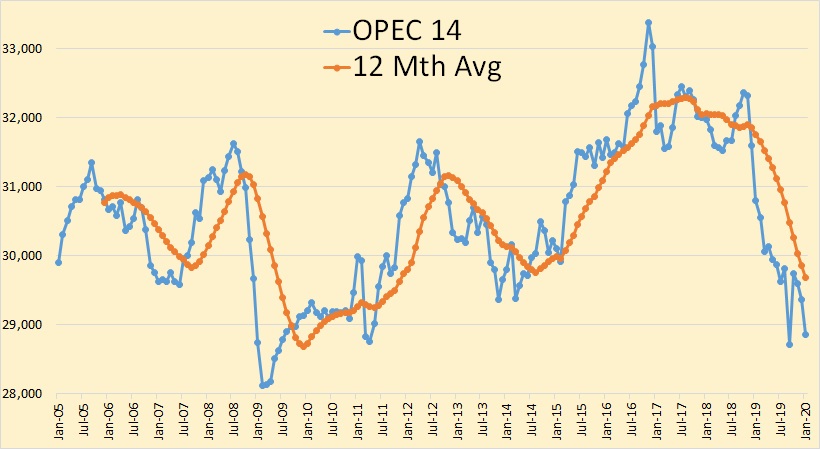
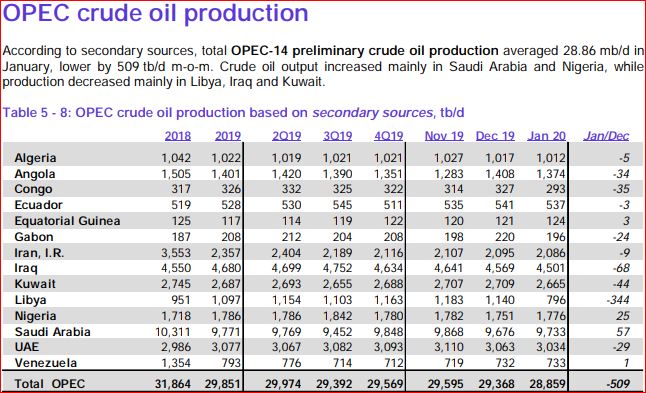
All OPEC data below is from the February edition of the OPEC Monthly Oil Market Report. The data thousand barrels per day and is through January 2020. OPEC Monthly Oil Marker Report
OPEC 14 crude oil production was down 509,000 barrels per day in January. And that was after December production was revised down 86,000 barrels per day.
OPEC announced a couple of months ago that Ecuador was leaving the cartel. However they were still included in January’s data. I have no idea what’s going on.
Read More