Non-OPEC June Oil Production has Small Increase

A guest post by Ovi

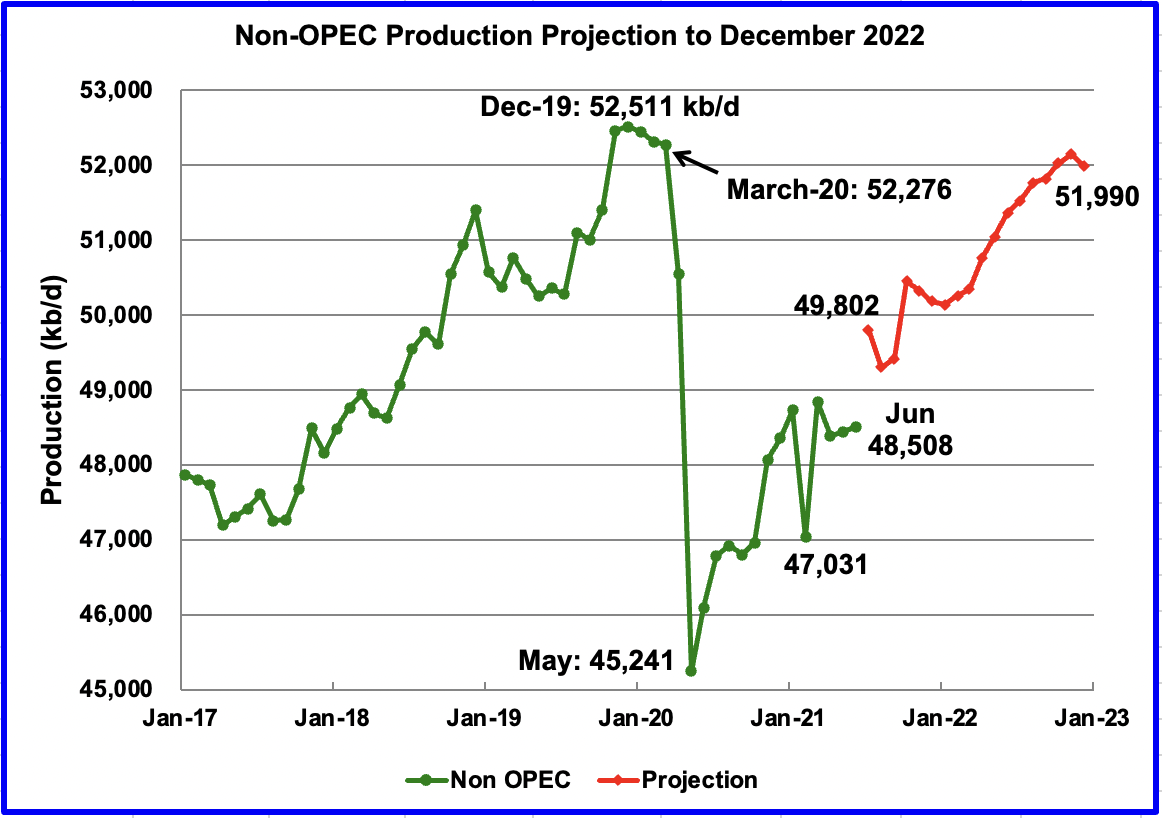
Below are a number of oil (C + C ) production charts for Non-OPEC countries created from data provided by the EIAʼs International Energy Statistics and updated to June 2021. Information from other sources such as OPEC, the STEO and country specific sites such as Russia, Norway and China is used to provide a short term outlook for future output and direction for a few countries and the world.

Read More

July US Oil Production Growth Slows

A guest post by Ovi

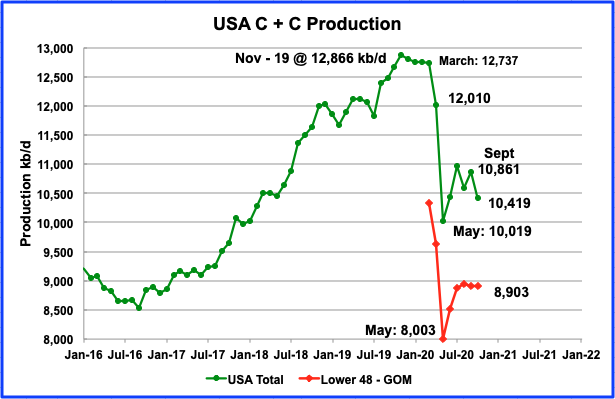
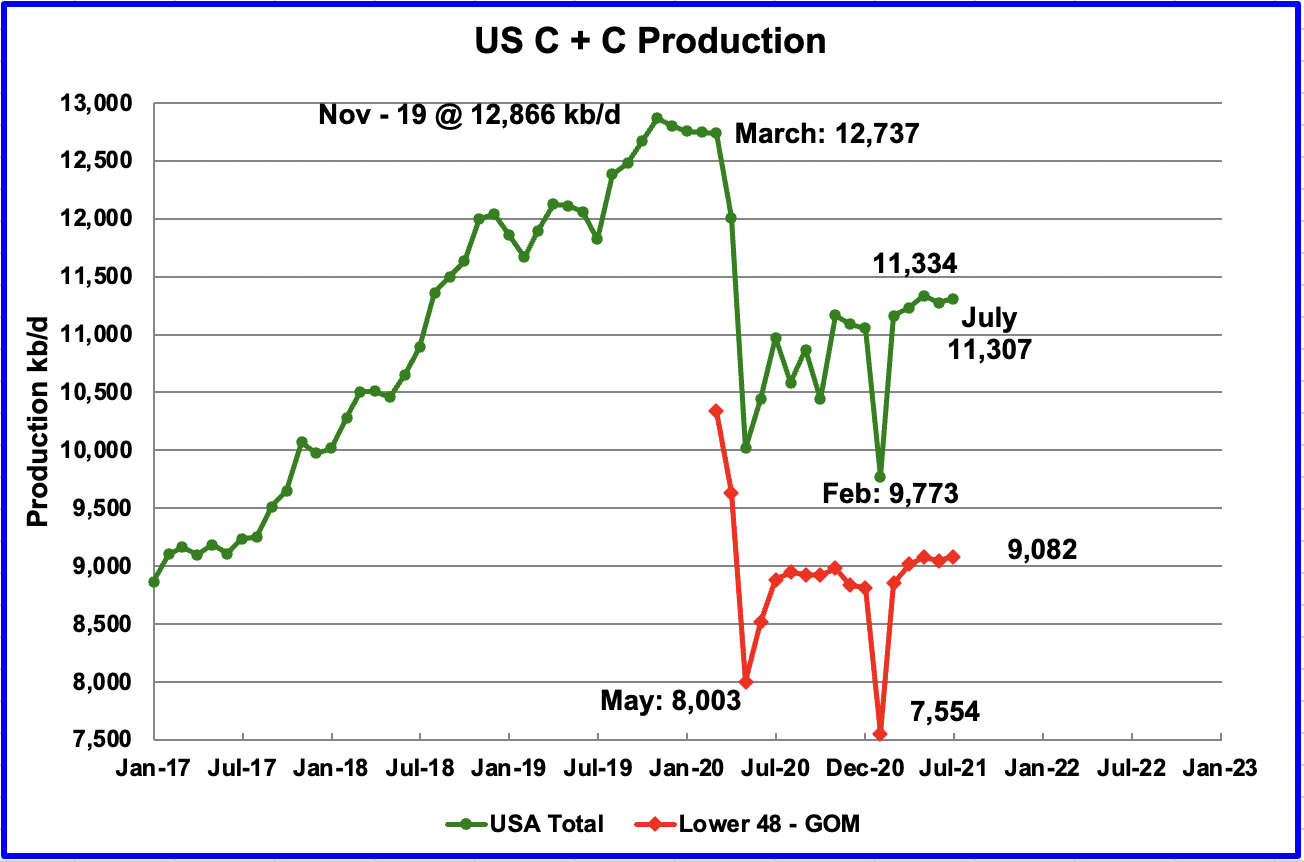
All of the oil (C + C) production data for the US state charts comes from the EIAʼ’s Petroleum Supply monthly PSM. After the production charts, an analysis of three EIA monthly reports that project future production is provided. The charts below are updated to July 2021 for the 10 largest US oil producing states.

Read More

US October Oil Production Declines

A post by Ovi at peakoilbarrel

To all of our participants, I wish you a Happy, Healthy and Prosperous New Year.

All of the oil (C + C) production data for the US state charts comes from the EIAʼs Petroleum Supply monthly PSM. After the production charts, an analysis of three EIA monthly reports that project future US production is provided. The charts below are updated to October 2020 for the 10 largest US oil producing states.

Read More

An Improved Empirical Model For Oil Prices

A Guest post by Ian Schindler (Schinzy)

This is an update to the post An Empirical Model For Oil Prices and Some Implications in which we discussed a model for oil prices as a function of 3 years of production, that is oil price in year t was estimated by production in year t, the discrete first derivative of production in year t, and the discrete second derivative in year t. We subsequently published a paper titled Oil Extraction, Economic Growth, and Oil Price Dynamics using the same model. This article contains most of our intuition on how peak oil will effect oil prices. We believe in fact that peak oil is about extraction prices rising faster than market prices and hence lower profitability for the oil industry.

Before going on, we note that all available data is very approximate. Jean Laherrère has exhaustively documented incoherence in extraction data from all standard sources [1]. We use a single price of oil provided by BP, but there is a large spectrum of prices for oil of different densities, chemistry, and provenance [2]. For this reason we do not search a perfect fit but rather try to understand the dynamics creating oil demand. Read More
Oil Price Volatility and US EIA Data

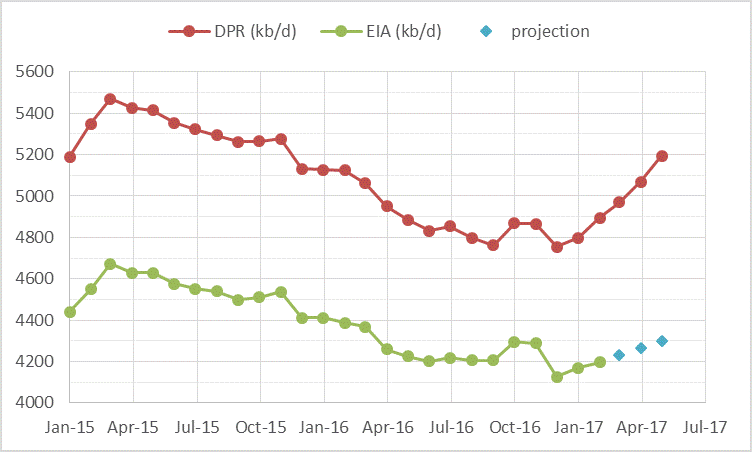
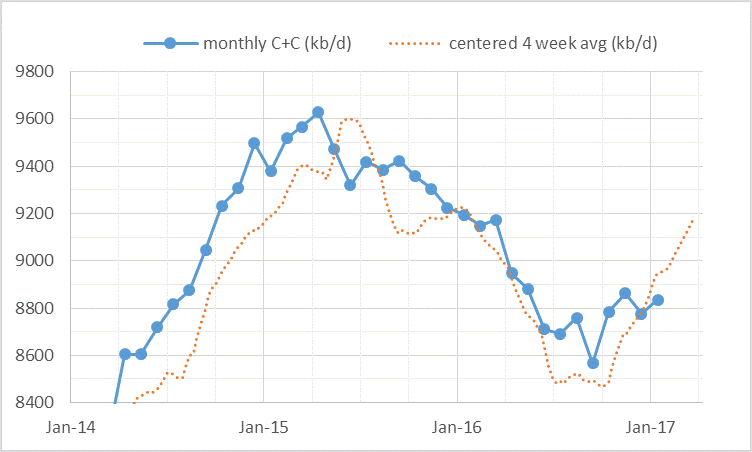
A number of news media pieces have recently suggested that oil prices may fall due to soaring output in the US.  Output from US light tight oil (LTO) may not rise as quickly as some EIA reports may suggest. One source of confusion is that the EIA creates many reports and some are more reliable than others. The two charts below cover US LTO and US crude plus condensate (C+C) output.

US LTO Output from the EIA Drilling Productivity Report (DPR) and EIA Tight Oil (LTO) estimates in kb/d.

chart/

US EIA monthly C+C output and centered 4 week average output in kb/d.

chart/

Read More