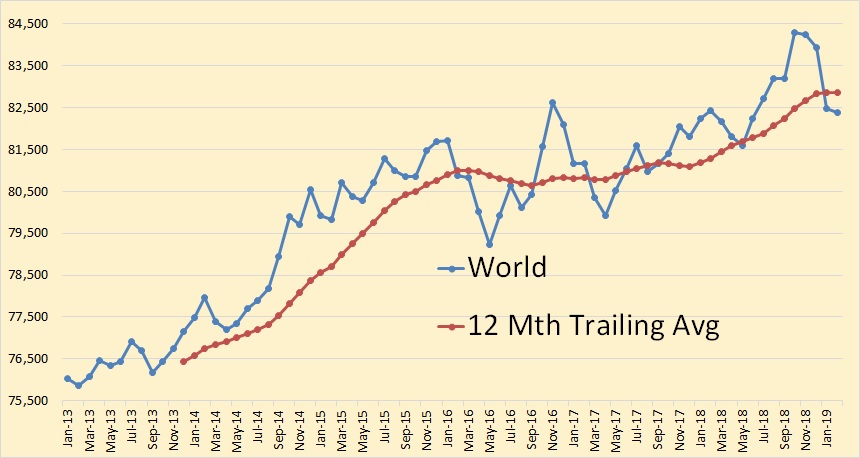
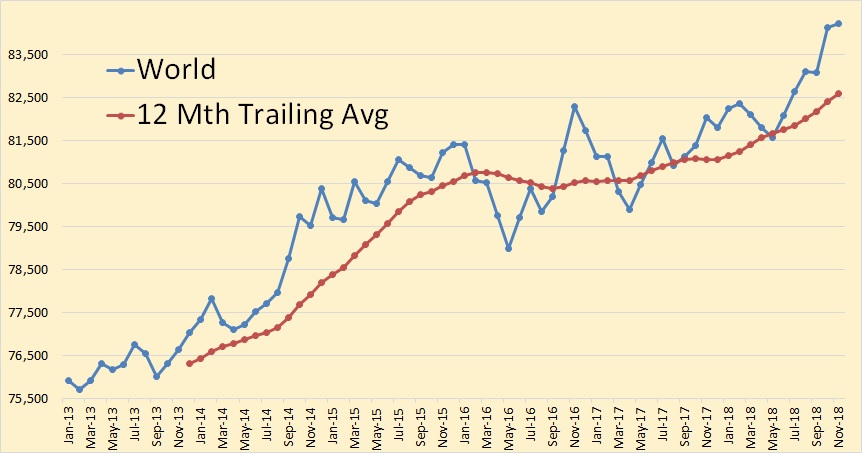
The data for the charts below were taken from the EIA’s Monthly Energy Review. It is crude plus condensate through March 2019 and is in thousand barrels per day.
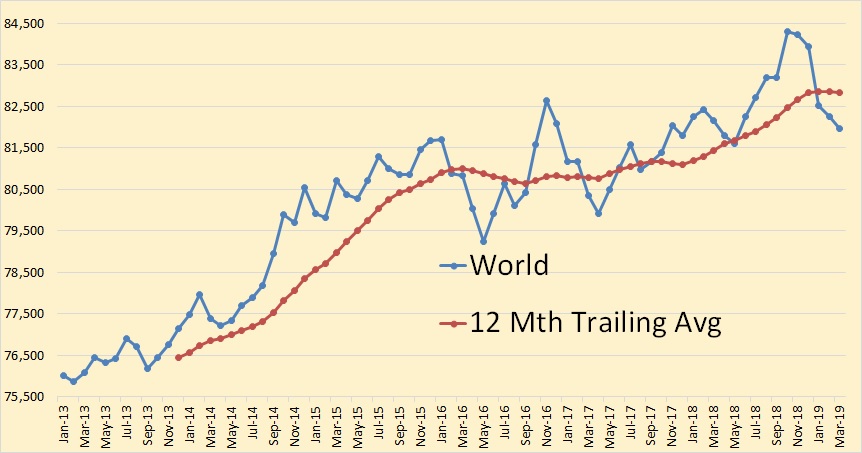
World C+C was down 281,000 barrels per day in March.
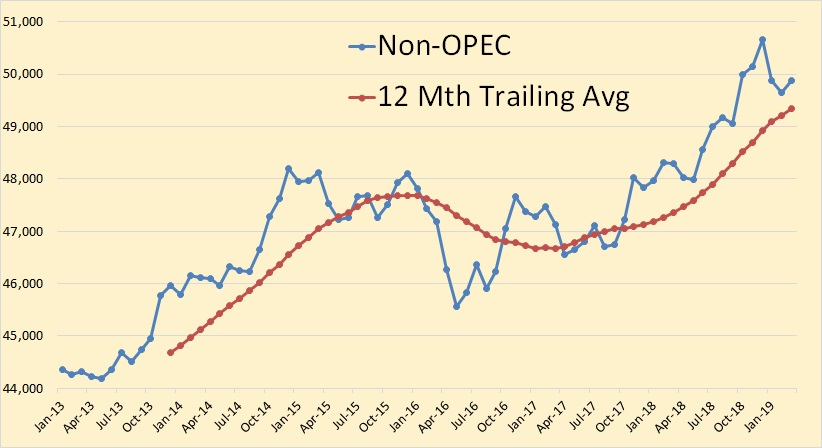
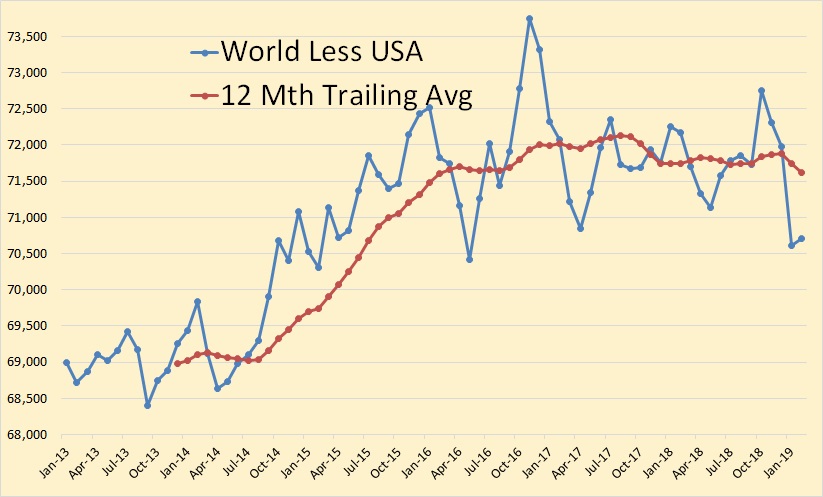
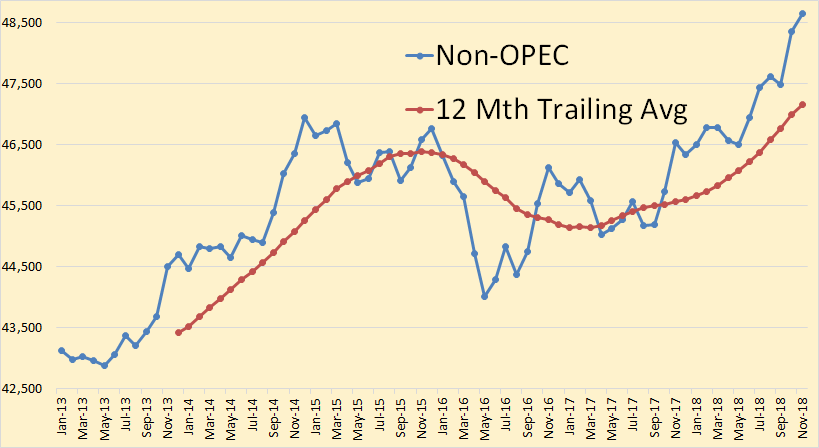
Non-OPEC was up 218,000 barrels per day in March.