Bakken December Production Numbers

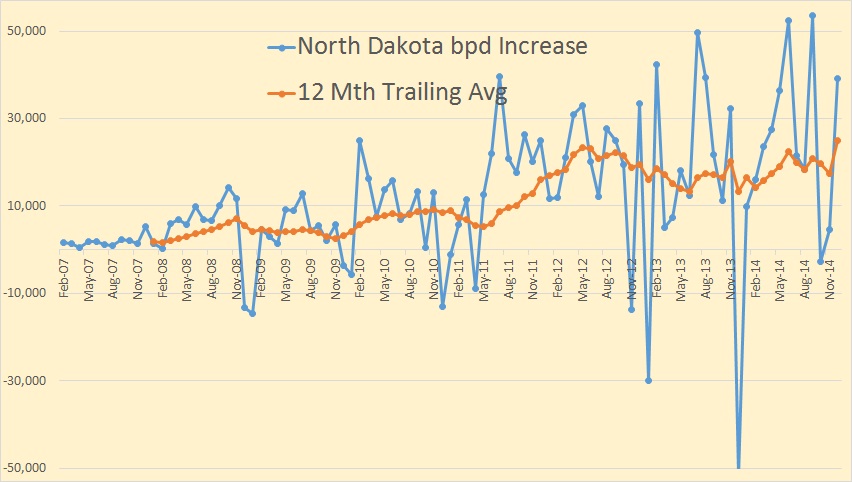
The North Dakota Industrial Commission has released the Bakken and North Dakota monthly production numbers for December 2014. There was a bit of a surprise as Bakken and all North Dakota production was up just over 39,000 barres per day.

Bakken BPD

Since Bakken production was up at almost the exact same amount as the rest of North Dakota, (Bakken up 39,080 kbd vs. 39,086 bpd for ND), suggest that all the wells being brought on line are Bakken and Three Forks rather than conventional wells.

Bakken Change

The North Dakota change per month, 12 month trailing average reached a new high in December of 25,006 barrels per day. That means North Dakota oil production was up an average of 25 thousand barrels per day every month in 2014.

Read More

Are Mountrail’s Sweet Spots Past Their Prime?

This is a Guest Post by Rune Likvern   Fractional Flow

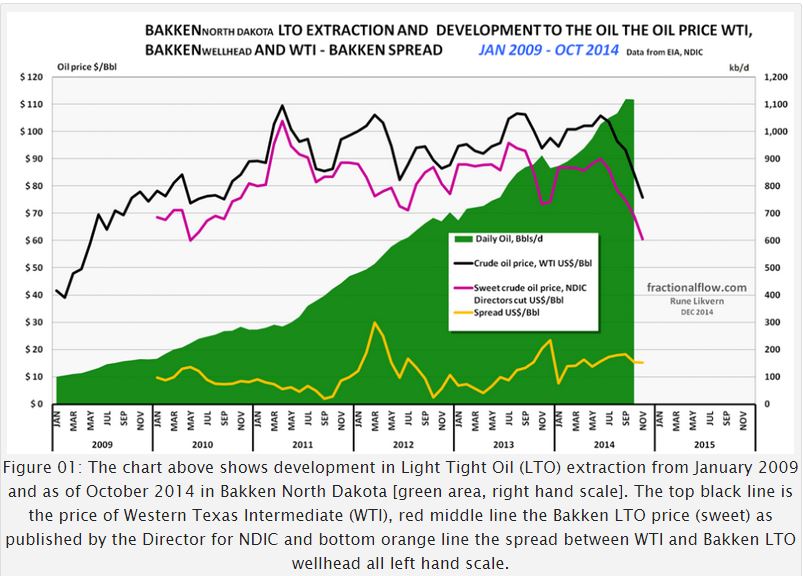
This post is an update on total Light Tight Oil (LTO) extraction from Bakken in North Dakota based upon actual data as of October 2014 from North Dakota Industrial Commission (NDIC). It further presents a statistical analysis on developments of well productivity with a detailed look at developments in Parshall, Reunion Bay and Sanish.

  • There were general improvements in LTO well productivity in Bakken during 2013.
  • Present trends in LTO well productivity for Mountrail’s sweet spots (Alger, Parshall, Reunion Bay, Sanish and Van Hook) suggests these are past their prime.
  • Figure 29 in this post show development in well productivity for Alger and Van Hook and figures 06, 08 and 10 for Parshall, Reunion Bay and Sanish. A common feature for Parshall, Reunion Bay, Sanish, and Van Hook is that these reached new highs in well productivity for wells started in 2013.
    Alger has been in general decline since 2011.
  • LTO extraction in recent years may be viewed as a source for global swing production for oil.

Rune 1NOTE: Actual data used for this analysis are all from North Dakota Industrial Commission (NDIC). Data are incomplete for around 2% of the wells.

For wells on confidential list, data on runs were used as proxies for extraction.

Production data for Bakken, North Dakota: Monthly Production Report Index

Formation data from: Bakken Horizontal Wells By Producing Zone

The important messages from this analysis are the trends in well productivity.

This post is an update and expansion of my post “Will the Bakken “Red Queen” Have to Run Faster?” from the summer of 2013 and may be read as a continuation of my post “Will the Bakken Red Queen Outrun Growth in Water Cut?”.

Rune 2a Read More

Bakken Sweet Spots are Petering Out

The Bakken, as well as other shale oil areas, is not one homogeneous area where equal amounts of can be found. David Hughes in DRILLING DEEPER puts it this way, though here he is talking about gas wells, the same applies to oil wells:

All shale gas plays invariably have “core” areas or “sweet spots”, where individual well production is highest and hence the economics are best. Sweet spots are targeted and drilled off early in a play’s lifecycle, leaving lesser quality rock to be drilled as the play matures (requiring higher gas prices to be economic); thus the number of wells required to offset field decline inevitably increases with time.

However the Bakken, at least through the September North Dakota Industrial Commission  production report, has given no real indication that the Bakken is even close to peaking. But a closer look at the data makes me believe that is all about to change.

The NDIC issues a Daily Activity Report where they list permits issued as well as wells completed and wells released from the tight hole confidential list. These reports usually, but not always, also give the number of barrels of oil per day and barrels of water per day for the first 24 hours of production.  I have gone through every day, back to November 1st, 2013 and collected the data on every well listed that gives production numbers and copied that data to Excel. In that one year and three weeks I have gathered the data form every one of the 2,171 wells that give production numbers. Sorting these wells by well number, which is the original permit number, gives some startling results.
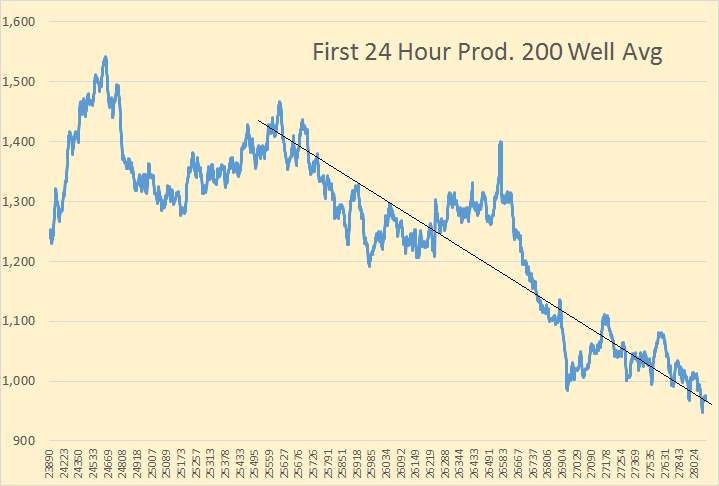
ND 200 Well Avg

To smooth the chart I created a 200 well average of barrels per day per well. The first point on the chart is therefore the average to the 200th well, #23890 and the last point is the 200 well average to the 2171st well, #28971. As you can see there has been a continuous, though erratic, decline in first 24 hour production as the well numbers increase.
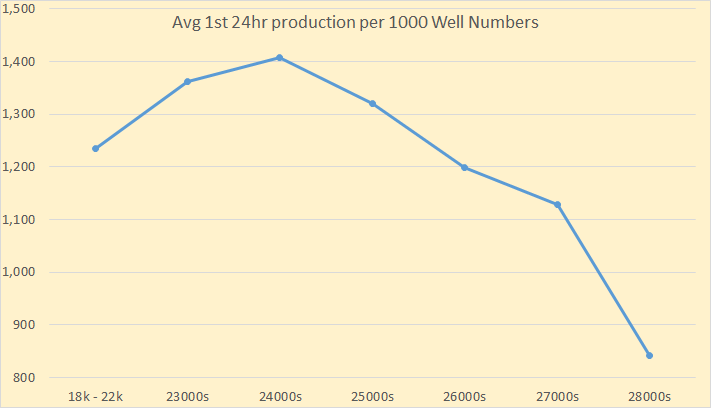
ND Prod per 1000

Breaking this down according to well numbers we see production peaked with the 2400s and have steady decline since. Every group of well numbers do not contain the same number of wells.
Read More
Bakken September Production Data

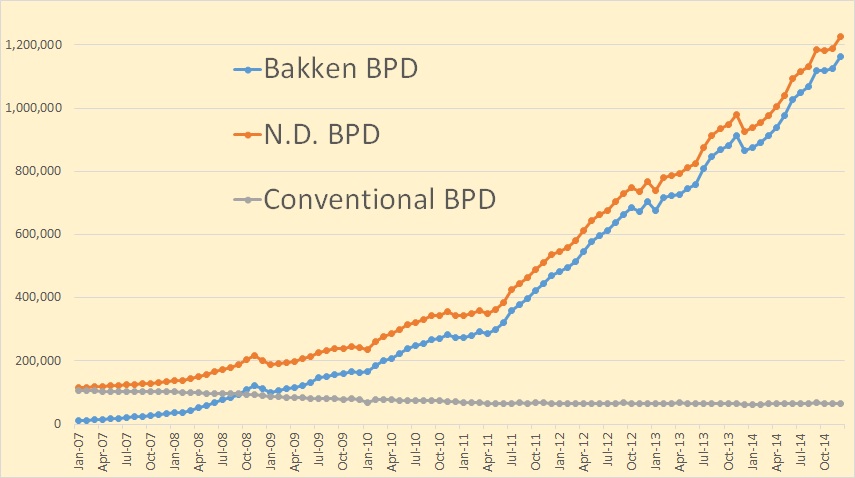
North Dakota just released the Bakken September Production Data as well as the September Production data for all North Dakota.

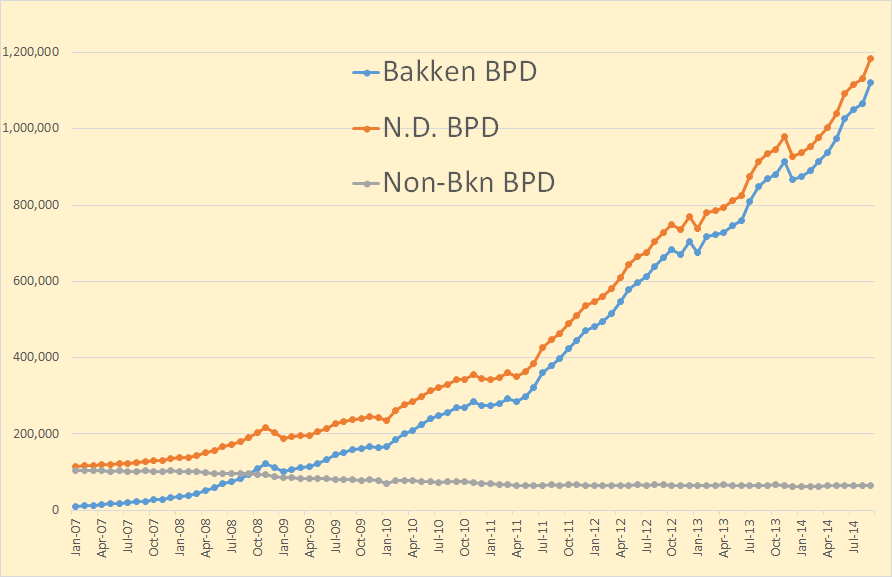
There was a suprisingly hefty increase in Bakken production in September, up 52,568 bpd to 1,120,031 bpd.

Bakken Barrels Per Day

North Dakota production was up slightly less, 52,394 bpd to 1,184,693 bpd. This means production outside the Bakken was down slightly.

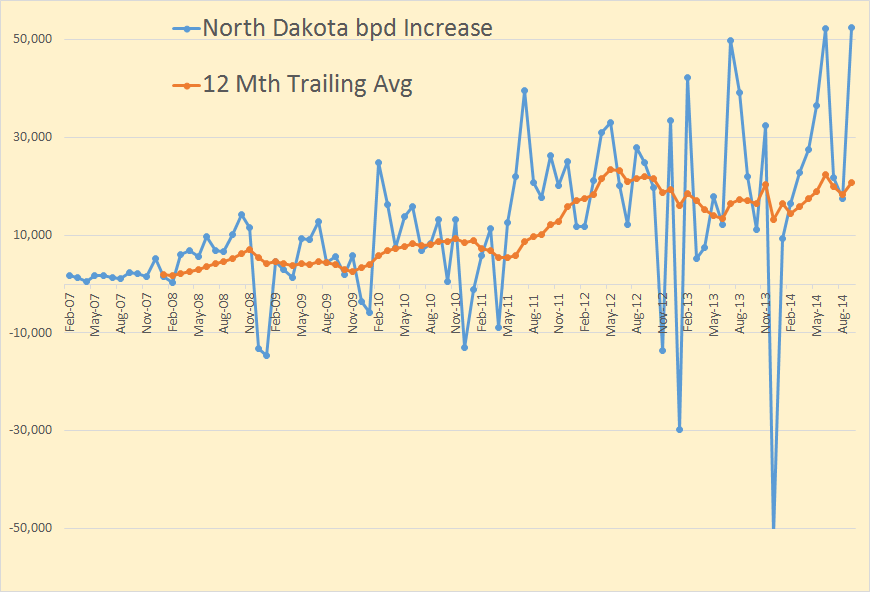
Bakken Barrels Per Day Increase

These big increases happen ever so often and are usually followed by a not so large increase for a few months. I think there is some kind of reporting anomaly here. But as you can see the 12 month average increase gives a better indication of what is really going on.
Read More

The EIA’s International Energy Statistics 2

The EIA, a few days ago posted their International Energy Statistics. They publish lots of statistics here but on monthly basis I only follow their  production of world Crude Oil including Lease Condensate.

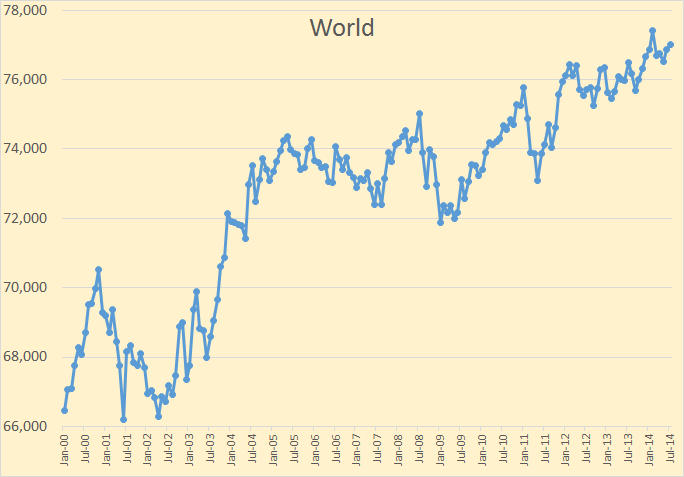
The data on all charts below is Crude + Condensate production through July 2014 and is in thousand barrels per day.

World

World C+C production was up 168,000 bpd to 77,023,000 bpd. The high, so far, was in February at 77,409,000 bpd.

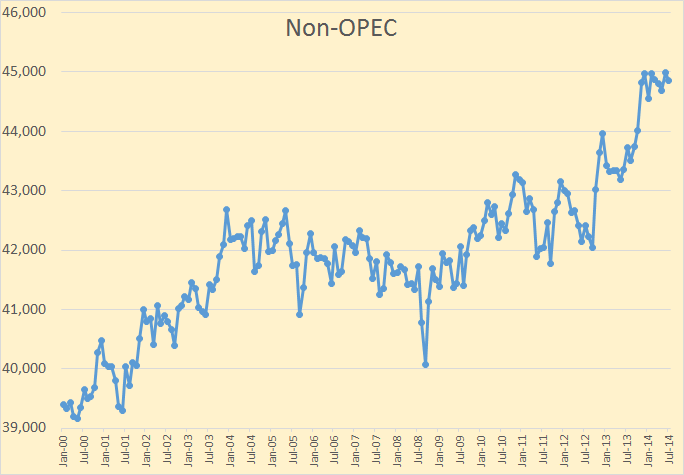
Non-OPEC

Non-OPEC C+C was down 135,000 bpd from it high so far. It has been on a 9 month plateau high.

Read More