Petroleum Supply Monthly & Other News

The EIA just released their Petroleum Supply Monthly where they give their estimates of US crude production as well as the crude production for all states and territories through August 2014.

There was not much movement from anyone in August. Here are the biggest movers:

                            Change
Total USA          61 kbd
Texas                  46 kbd
GOM                   21 kbd
North Dakota   18 kbd
Oklahoma         -6 kbd
Colorado            -9 kbd
Alaska              -24 kbd

The data is in kbd with the last data point August 2014.

USA

I have started the data in January 2009 in order to get a better picture of what is really happening.

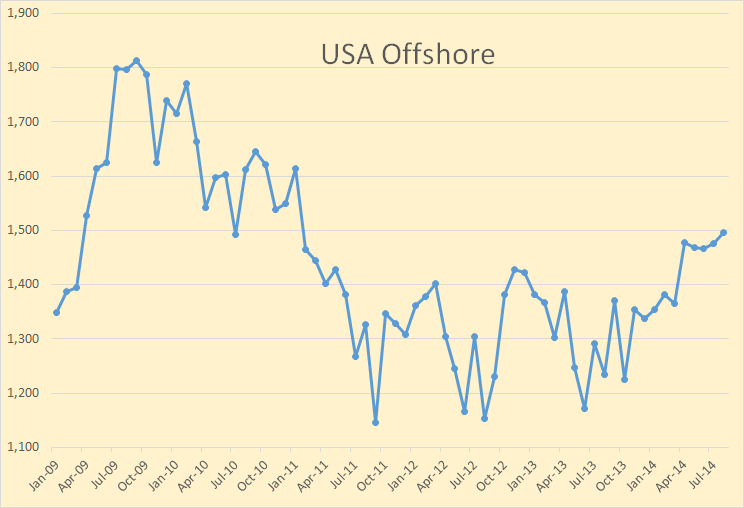
USA Offshore

 The above chart is the combined production of both GOM and Pacific offshore.

 The EIA is predicting Offshore production to reach 2 million barrels per day by 2016, I really don’t think it is going to make it. They are counting on a lot of new offshore fields that are coming on line to bring it up to that level. While that is happening, what they have underestimated is the very high decline rate of these deep water fields.
Read More

Bakken Oil Production by County

North Dakota production by county is posted here: ND Historical Barrels of Oil Produced by County Confidential wells are not included in that data however but that estimated data can be found here:Monthly Production Report Index Click on the latest month.

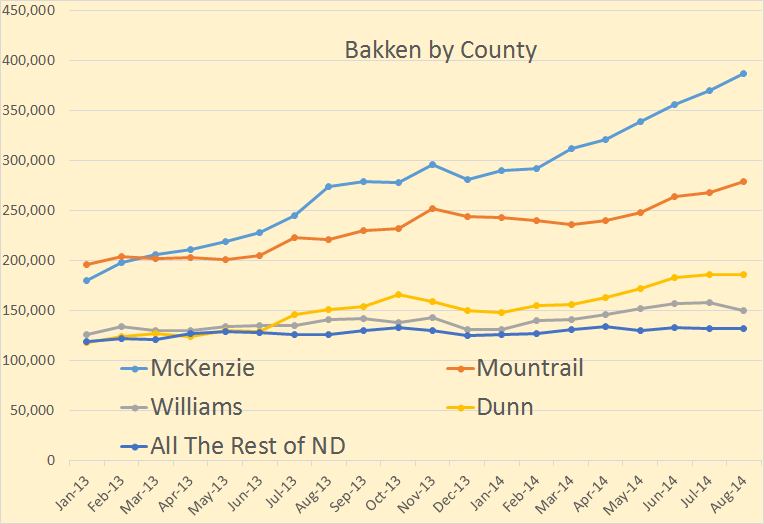
Bakken by County

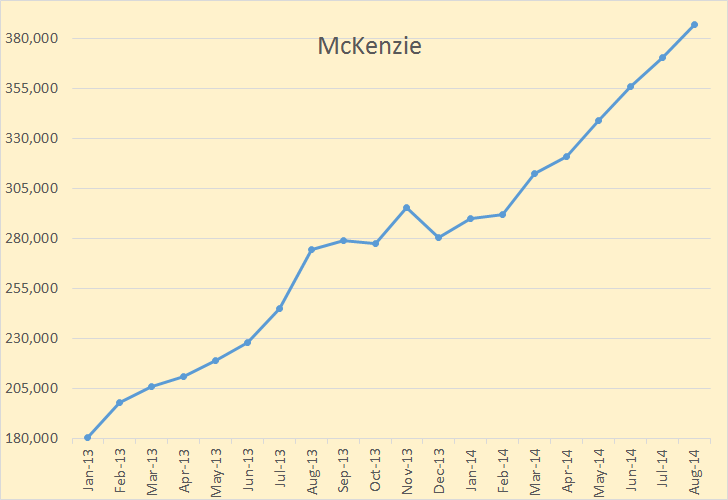
 This is a zero based chart and gives a better overall picture of production from each county. The charts below are not zero based but gives an amplified picture of production from each county.

Production in barrels per day for each county was as follows:
McKenzie      386,715 
Mountrail      278,940
Dunn              185,707 
Williams        149,437
Rest  of ND   131,531

McKenzie

McKenzie county production was up by 16,435 barrels per day. McKenzie remains the most productive county in North Dakota.
Read More

Bakken and N.D. Update for July

North Dakota has released their Bakken and North Dakota production numbers for July.

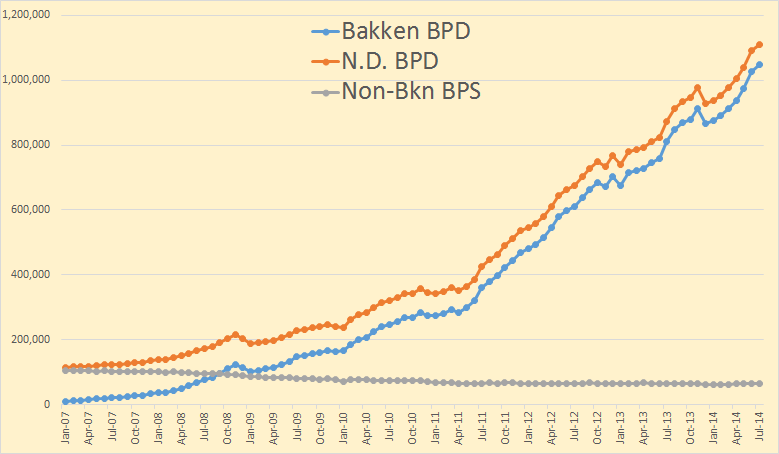
Bakken Barrels Per Day

Bakken production was up 19,456 bpd while all North Dakota production was up 18,134 barrels per day. This means that North Dakota production outside the Bakken fell by 1,322 bpd or a little over 2%.

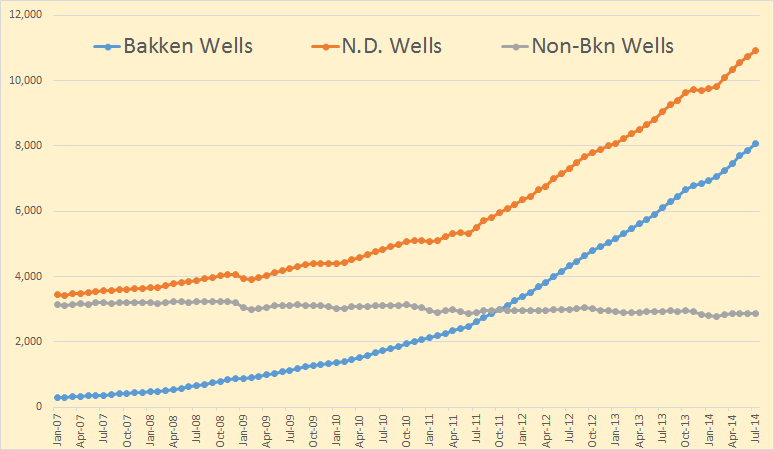
Bakken Wells

Bakken wells producing increased by 195 to 8,065. North Dakota wells increased by the same amount to 10,952 so non-Bakken wells were unchanged at 2,860.

Read More

Petroleum Supply Monthly and Other News

The EIA’s Petroleum Supply Monthly has just come out. That report gives production from individual states as well as offshore production.

The below chart is thousand barrels per day with the last data point June 2014.

GOM BSEE

For February, March and April there is about 60 thousand barrel per day difference between what the EIA and BSEE reports. Eventually the EIA and BSEE will be the same and it will be the EIA data that suffers the greatest revisions. I believe they have the June GOM numbers quite a bit too high here.

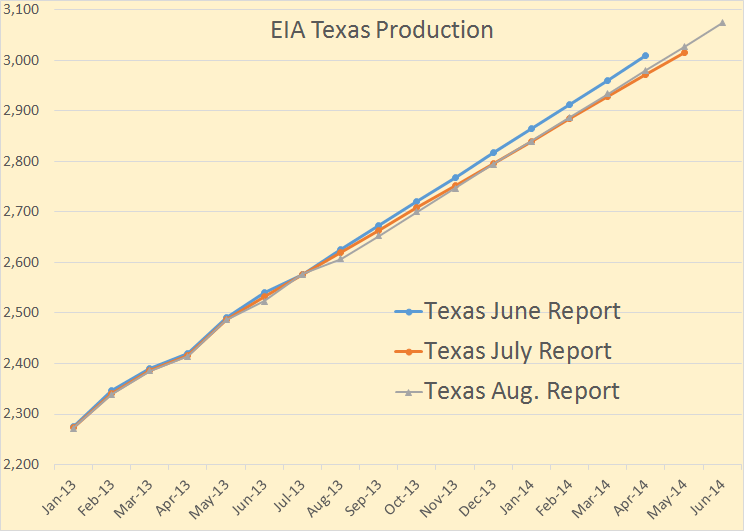
Texas 1

The EIA is still tweaking its guess as to what Texas production will be when it finally comes in.
Read More

EIA Petroleum Supply Monthly

The EIA has released its Petroleum Supply Monthly with C+C production numbers through May 2014. Of all the EIA data releases this seems to be the most accurate. However in some cases it is only as good as a few EIA employees guesses. And the more state data they have to work with, the better their guess.

The data in this report goes back to 1920 for total US production and to 1981 for individual states and offshore production. However I have chosen to shorten the time frame for my charts in order to better show what has happened recently.

USA

US production was down 36,000 bp/d in May to 8,357,000 barrels per day. US production took off in mid 2011 when Shale production took off and has risen some 3,300,000 since. Of course there was shale production prior to this but it was only keeping US production on a relatively flat plateau.

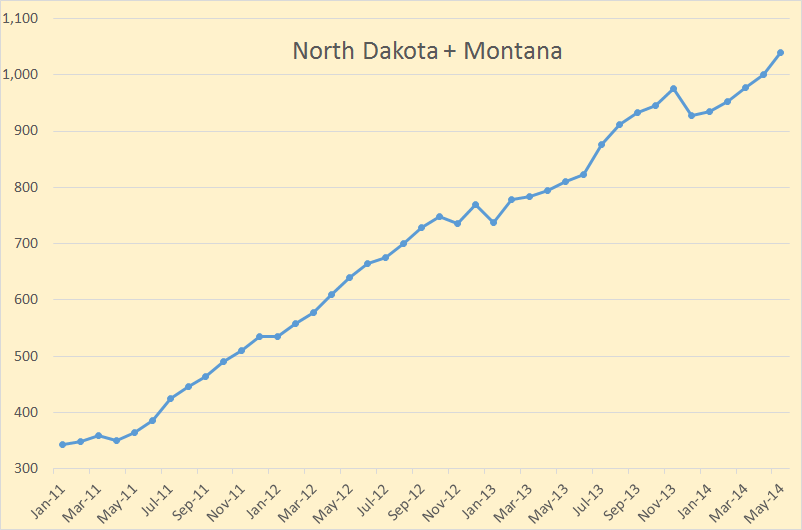
ND and Montana

Everyone is interested in the Bakken so I have combined the two Bakken states. Of course there is production in these two states outside the Bakken but this is the best I could do. Note that when the Bakken has one bad month as they had in December, it takes several months to get back to their prior production level.

Read More