Non-OPEC September Oil Production Flat

A post by Ovi at peakoilbarrel

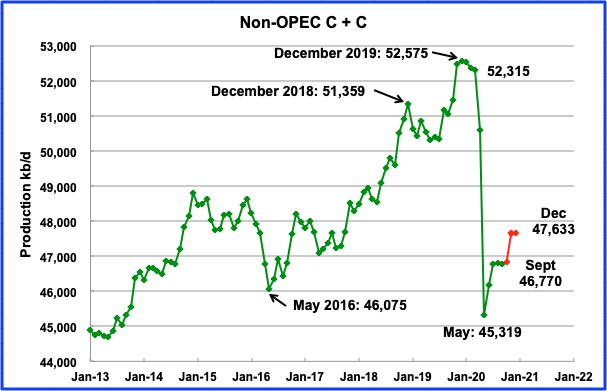
Below are a number of oil (C + C ) production charts for Non-OPEC countries created from data provided by the EIAŹ¼s International Energy Statistics and updated to September 2020. Information from other sources such as OPEC, the STEO and country specific sites such as Russia and Norway is used to provide a short term outlook for future output and direction for a few countries.
Read More

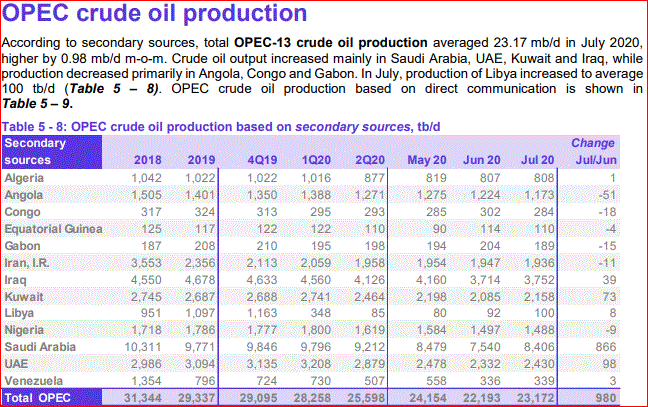
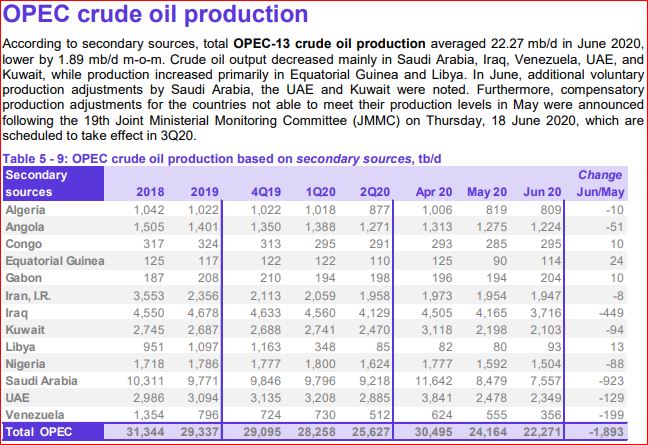
OPEC June 2020 Production Data

All OPEC data below is from the July 2020 OPEC Monthly Oil Market Report.

All OPEC data is through June 2020 and is in thousand barrels per day. All copied and pasted texts are in italics.

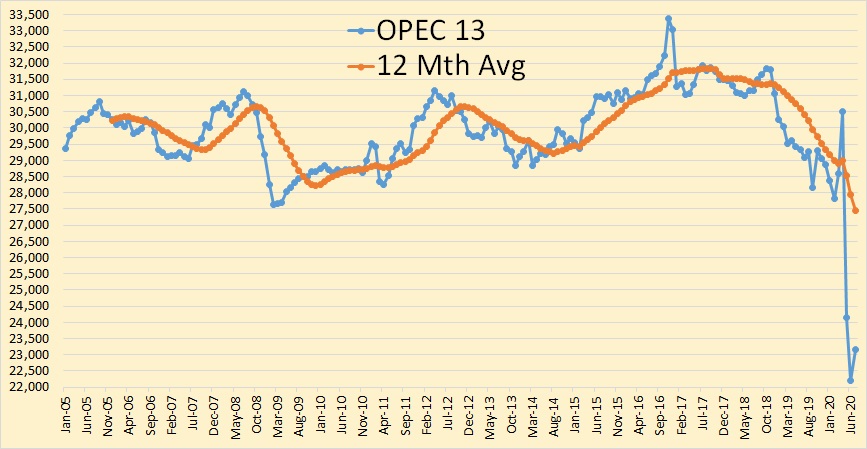
OPEC cut further in June, down almost 1.2 million barrels per day. They are down about 6.8 million barrels per day since November 2019.

All OPEC major producers cut production in June. The tiny producers didn’t seem to bother.

Read More

OPEC March 2020 Production Data

All OPEC data reflected in the charts below are from the April edition of the OPEC Monthly Oil Market Report. https://momr.opec.org/pdf-download/ The data in in thousand barrels per day and all data is through March 2020.

Though OPEC 13 was up 821,000 barrels per day in March it was still the fourth lowest month in 9 years.

Iran, Libya, and Venezuela are exempt from the agreed on cuts. These three were down a combined 206,000 barrels per day. Those subject to cuts, were up a combined 1,026,000 barrels per day.

Read More