World Energy 2017-2050: Annual Report

A Guest post by:

Dr. Minqi Li, Professor
Department of Economics, University of Utah
E-mail: minqi.li@economics.utah.edu

This Annual Report evaluates the future development of world energy supply and its impact on the global economy as well as climate change. The report projects the world energy supply and gross world product (global economic output) from 2017 to 2050. It also projects carbon dioxide emissions from fossil fuels burning and the implied global average surface temperature from 2017 to 2100.
chart/

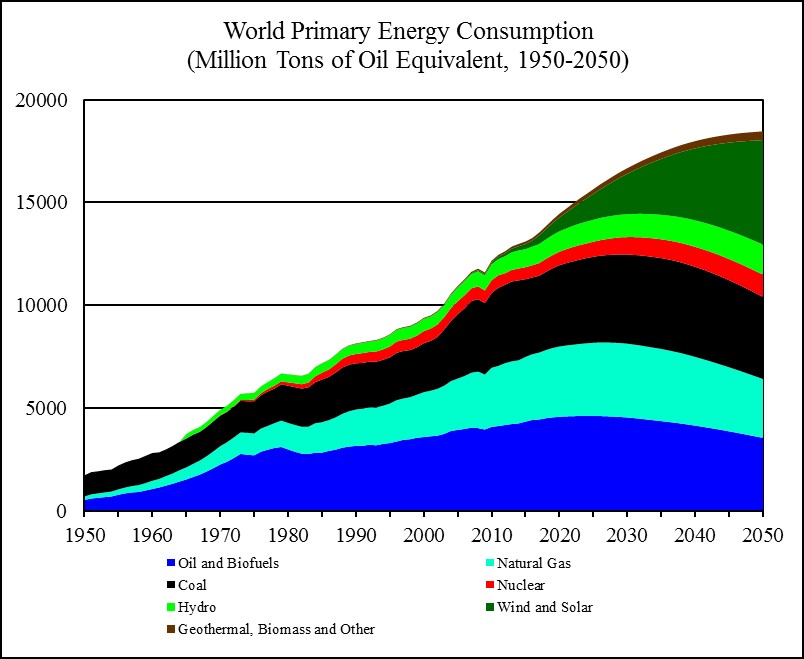
Figure 18
Sources: World historical oil, natural gas, and coal consumption from 1950 to 1964 is estimated from carbon dioxide emissions (Boden, Marland, and Andres 2017); world primary energy consumption and its composition from 1965 to 2016 is from BP (2017); world primary energy consumption and its composition from 2017 to 2050 is based on this report’s projections. Read More
EIA’s Electric Power Monthly – May Edition with data for March

This is a guest post by islandboy.

Any comments not related to petroleum (politics, renewable energy, or coal for example) should be in this thread, there will be a separate Open thread for Petroleum (oil and natural gas) discussion.

chart/

chart/

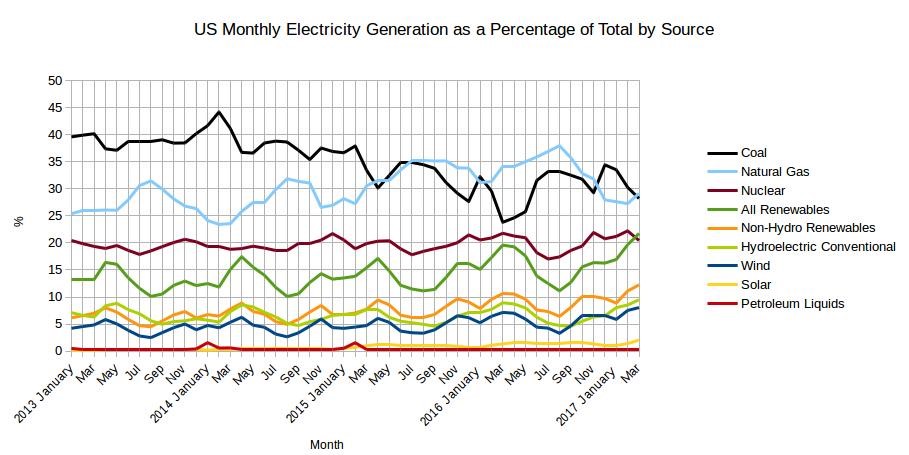
The EIA released the latest edition of their Electric Power Monthly on May 25th, with data for March 2017. March data includes some milestones which are significant in that these circumstances have not existed for a very long time, if ever. Read More

Open Thread, Oil and Natural Gas

Hi Gang, I had expected the Texas RRC data today but it didn’t happen. I expect it Monday or Tuesday at the latest. I am continuing the experiment Dennis started a week or so ago. We have two open threads, one oil and gas only, the other any other related subject such as climate change of economic collapse.

This one is Oil and Gas only.

World Natural Gas Shock Model

This is a guest post by Dennis Coyne.

The views expressed in the post are those of Dennis Coyne and do not necessarily reflect the views of Ron Patterson.

The post that follows relies heavily on the work of Paul Pukite (aka Webhubbletelescope), Jean Laherrere, and Steve Mohr. Any mistakes are my responsibility.

For World Natural Gas URR Steve Mohr estimates 3 cases, with case 2 being his best estimate.

Case 1 URR= 14,000 TCF (trillion cubic feet)
Case 2 URR= 18,000 TCF
Case 3 URR= 27,000 TCF

Jean Laherrere’s most recent World natural gas URR estimate is close to Steve Mohr’s Case 1 at 13,000 TCF.

A Hubbert Linearization(HL) of World Conventional Natural Gas from 1999 to 2014 suggests a URR of 11,000 TCF, an HL from 1982-1998 points to a URR of 6000 TCF for conventional natural gas.

Note that “Conventional” natural gas subtracts US shale gas and US coal bed methane (CBM) from gross output minus reinjected gas for the World.

Read More

World Energy 2014-2050 (Part 3)

This is a guest post by Political Economist

Solar Correction

As I reviewed my spreadsheet, I identified a copy and paste error resulting in a mis-calculation of the solar projection.  This affects the projection of annual installation of Solar PV capacity (see Part 2).

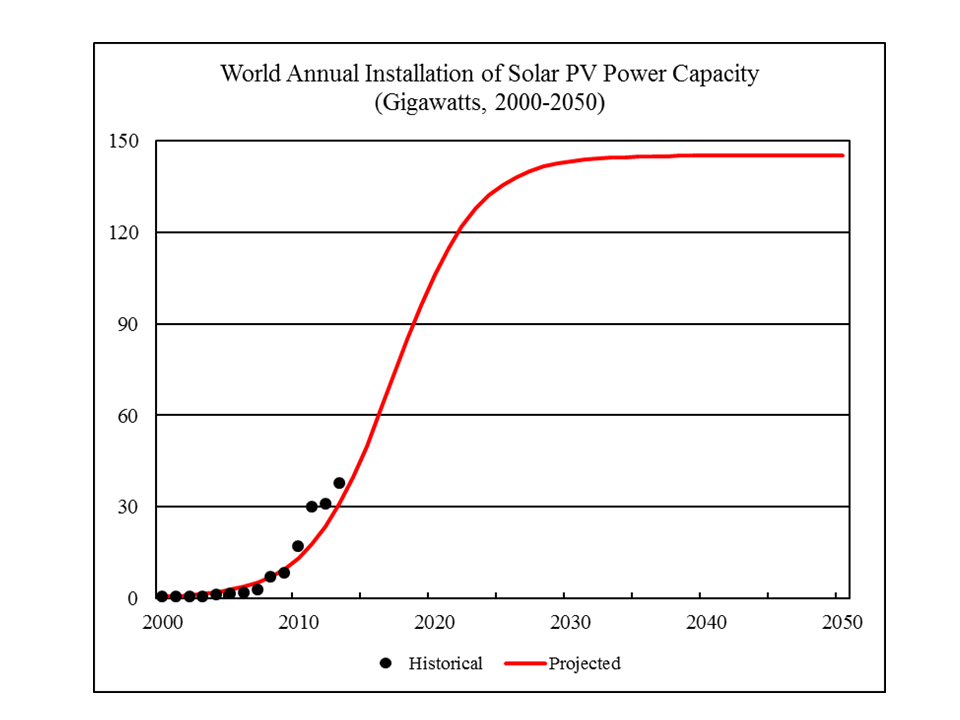
The correct projections of annual installation of Solar PV capacity are shown below:

 photo SolarCorrection070414_zps407c310d.png

Under the current projection, solar PV annual installation is projected to rise from 38 gigawatts in 2013 to 106 gigawatts by 2020.  Beyond 2020, the growth will slow down.  After 2030, it will plateau and approach 145 gigawatts (not 108 gigawatts as previously stated).

Again, please note this does not imply that solar electricity generation will peak.  Instead, it assumes that the GROWTH of solar electricity generation will peak and plateau.  In other words, it assumes that at some point in the future, solar electricity generation growth will become linear rather than exponential.  (I had an interesting discussion with Dennis on this after the post of Part 2)

I made corrections of the projected primary energy consumption and world GDP in accordance with the solar PV correction.  These are shown below.

Total Primary Energy Consumption

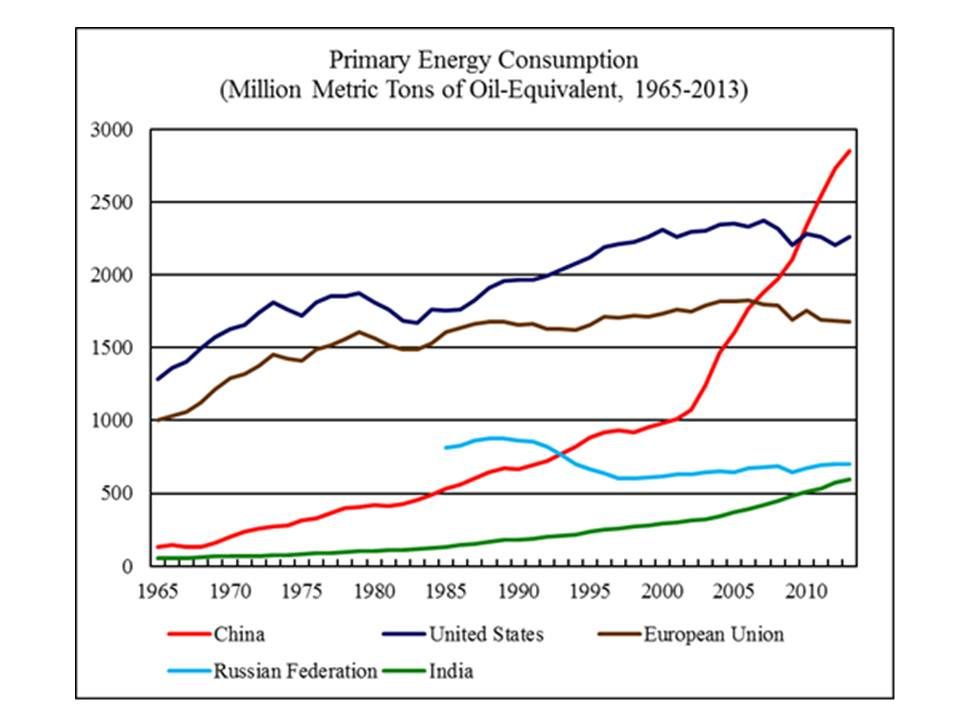
According to BP Statistical Review of World Energy 2014, world primary energy consumption reached 12,730 million metric tons of oil-equivalent, 2.3 percent higher than world primary energy consumption in 2012.  Figure 24 shows the primary energy consumption by the world’s five largest energy consumers from 1965 to 2013.

 photo PrimaryEnergy062114-1_zpsf37768e7.jpg
Read More