World Exports versus Consumption, The ELM

The EIA has updated their International Energy Statistics with annual production numbers through 2014 and export data through 2012. Sometimes these stats can be confusing as they include several types of production and exports. But for production I use only “Crude plus Condensate” and for exports I used “Crude Oil Exports” which I assume includes condensate as well.

Also the export data is not exact, just close, because some importers are also exporters. For instance in 2001 the US exported 59,000 barrels per day. In 2012 the US exported 629,000 barrels per day. The exporting of condensate is allowed in the US and since the Shale boom condensate exports have increased quite dramatically because Light Tight Oil is rather top heavy with condensate.

To get exports versus consumption for exporting nations I simply subtracted their exports from their production. The difference was what they consumed. Similar data can be found on the Energy Export Databrowser.

I think the data clearly endorses Jeffrey Brown’s Export Land Model.
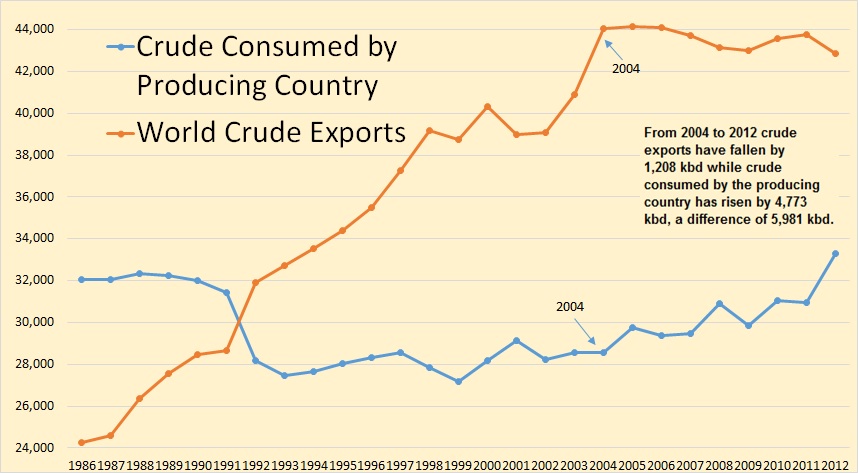
World E v C

In 2012 76,160,000 barrels of C+C were produced per day. Of that 76 million barrels 42,845,000 barrels were exported while the other 33,315,000 barrels was consumed by the producing nations. That is this is oil that was never exported.

Read More
Eagle Ford, Permian Basin, and Bakken and Eagle Ford Scenarios

This is a guest post by Dennis Coyne

Increased oil output in the US has kept World oil output from declining over the past few years and a major question is how long this can continue. Poor estimates by both the US Energy Information Administration (EIA) and the Railroad Commission of Texas (RRC) for Texas state wide crude plus condensate (C+C) output make it difficult to predict when a sustained decline in US output will begin.

 About 80 to 85% of Texas (TX) C+C output is from the Permian basin and the Eagle Ford play, so estimating output from these two formations is crucial. I have used data from the production data query (PDQ) at the RRC to find the percentage of TX C+C output from the Permian (about 44% in Feb 2015) and Eagle Ford plays (40% in Feb 2015).

Dean’s estimates of Texas C+C output are excellent in my opinion and are close to EIA estimates through August 2014. I used EIA data for TX C+C output through August 2014 and Dean’s best estimate from Sept 2014 to Feb 2015. By multiplying the % of C+C output from the RRC data with the combined EIA and Dean estimate, I was able to estimate Eagle Ford and Permian output. The chart below shows this output in kb/d.

  
blog150427/

Read More

North Dakota Bakken February Production

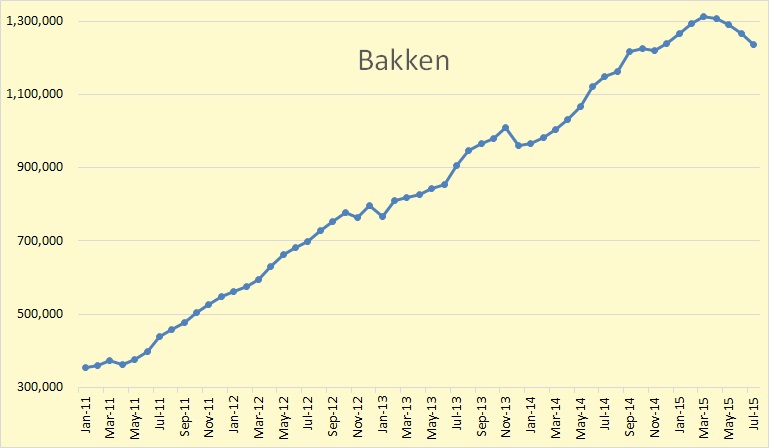
The NDIC Bakken Production Data and the NDIC North Dakota Production Data is in. Production in the Bakken was down 11,941 barrels per day and production in all North Dakota was down 14,104 bpd. The numbers for January were revised slightly. January Bakken was down 35,064 from December and all North Dakota was down 36,331 bpd from December.

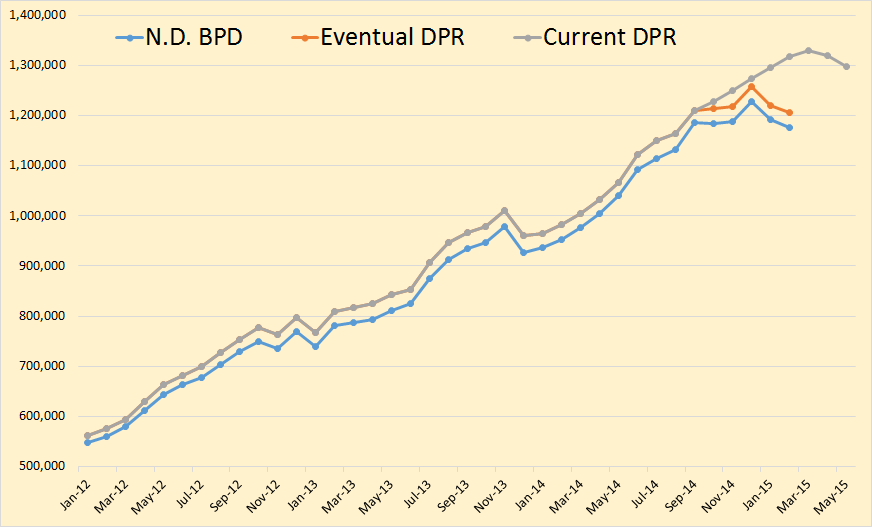
Bakken BPD

As I have pointed out before, the EIA’s Drilling Productivity Report, for some unknown reason, estimates the last six or seven months, when the actual data is available. In the above chart they estimate from October on. This throws their current numbers way off.  The DPR data includes the Montana Bakken therefore their numbers will naturally be higher than the North Dakota data.

Bakken Eventual

Of course the EIA DPR will eventually bring their numbers into what North Dakota is reporting. The above is what the eventual Drilling Productivity Report will look like. (In Orange). Here is the amount the historical DPR is off.

Read More

Bakken, A Tale of Two Counties

North Dakota publishes their Historical Barrels of Oil Production by County which gives county by county production back to 1951. The data here does not include confidential wells but they publish the last couple of months production data that does include confidential wells here: Oil and Gas Production Report. Looking over this data I found something very strange. In October Bakken production was down by 1,598 barrels per day and all North Dakota was down by 5,4054 barrels per day.

All data is in barrels per day with the last data point October 2014.

McKenzieMcKenzie County was up 19,609 barrels per day or 4.88 percent. In October McKenzie was up even more than it was in September when the Bakken was up 52.5 thousand barrels per day.

Mountrail

Mountrail Countywas down 18,728 barrels per day or 6.42 percent. There is  more on this story below.

Dunn

Dunn County was down 3,527 barrels per day or 1.83 percent.
Read More

More on Bakken Production, Choke Theory

The US Petroleum Supply Monthly just came out with production data for every state and territory. US supply was up 168,000 bpd to 8,864,000 bpd in September. The biggest gainers were North Dakota, up 53,000 bpd to 1,185,000 bpd and Alaska up 79,000 to 477,000 bpd. Alaska  was way down in both July and August and are just recovering from that.  There was only one big loser, New Mexico, down 18,000 bpd. Texas was up only 9,000 barrels per day which was surprising. The Gulf of Mexico was down 3,000 bpd.

The Choke theory and why I ain’t buying it.

North Dakota publishes a Daily Activity Report Index of all permits and other well activity in the Bakken as well as the rest of North Dakota. In this report is a list of all producing wells completed as well as wells released from confidential (tight hole) status. Wells usually stay on this list from a few days to a few months, but the average is only a few weeks.

I have collected this data from October 2013 to present and found some startling results. But some have said this data means nothing, that wells are usually choked off by the driller so therefore we can gain nothing from the data. But looking at the individual wells that just doesn’t make any sense. No, I agree that the driller chokes but that he would not gradually choke more according to increasing well number.

Below I have posted the first 24 hour data for all 122 wells reported by North Dakota for the first 25 days of November. The first 24 hour production ranges from over 3000 barrels of oil per day to a low of only 10 barrels of oil per day. Barrels of water range from a high of 6663  bwpd to a low of 48 bwpd. And the percent water cut ranges form a high of 94.15% water to a low of 12.75% water.

It just seems incredible to me to claim that these numbers are meaningless. Throughout all the almost 14 months of data I have gathered there are lots of very large producing wells and a lot of small producing wells. The point is as the well number increases the number of very large producing wells seems to decrease while the number of small producing wells seems to increase. And I just don’t believe this is due to the many drillers, after checking their well number, decides what size choke to apply.

Bakken NovemberBakken November 2Bakken November 3

Just below the list of all wells I have averaged the production according to well number. The sample however is not large enough to really mean a lot. The number of wells in the sample are: Below 26000, 11 wells  – 26000s 35 wellw – 27000s 54 wells – 28000s 23 wells.
Read More