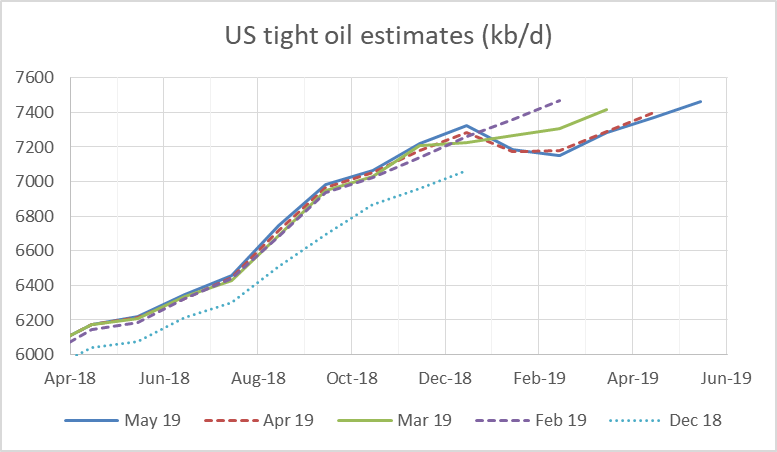
New tight oil estimates were recently released by the EIA. The chart below compares estimates from Dec 2018 to May 2019, where the Dec 2018 estimate is that estimate with the most recent month estimated being Dec 2018 and likewise the May 2019 estimate has May 2019 as the most recent month estimated. The May 2019 estimate is fairly close to the April 2019 estimate with a slight downward revision of the April 2019 estimate from 7399 kb/d to 7368 kb/d, March 2019 was also revised lower by 10 kb/d from 7292 kb/d to 7282 kb/d. For May 2019 the most recent estimate is 7462 kb/d and if past history repeats this estimate may be revised lower next month.
Tag: Light Tight Oil
Oil Shock Model Scenarios
Many different oil shock model scenarios have been presented over time at Peak Oil Barrel. Information on the Oil Shock Model, originally developed by Paul Pukite can be found in Mathematical Geoenergy. The future is unknown, so future extraction rates from conventional (excludes tight oil and extra heavy oil) oil producing reserves are unknown. Also not known are future oil prices which will affect the amount of tight oil and extra heavy oil that is ultimately produced.
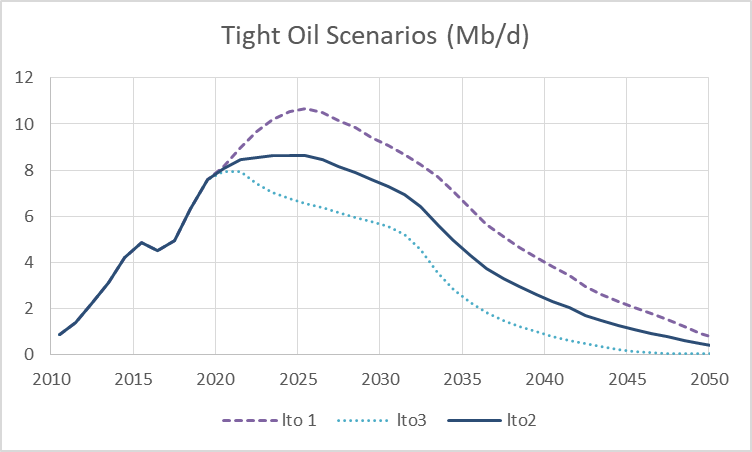
For tight oil I have created three scenarios corresponding to a low, medium and high oil price scenario. Likewise I have created three scenarios for extra heavy oil which correspond to the same low to high price scenarios used for the tight oil scenarios.
The mean estimates by the United States Geological Survey (USGS) for technically recoverable resources in tight oil plays combined with reasonable economic assumptions and data gathered from www.shaleprofile.com are used to model tight oil output. The EIA’s AEO 2018 reference oil price scenario is used for the high oil price case and the low scenario uses the AEO reference price case up to the date when it reaches $70/b in 2017$ and assumes oil prices remain at $70/b for all future dates. The medium oil price scenario is the average of the low and high price cases.
US Light Tight Oil (LTO) Update
by Dennis Coyne
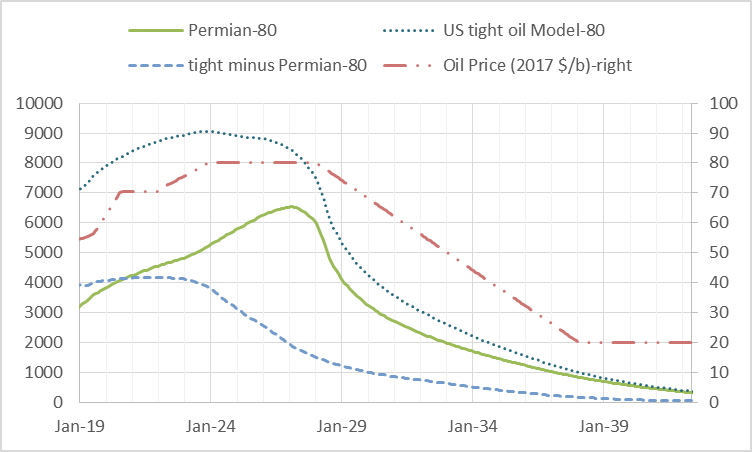
I have updated my scenarios for US LTO output, based on both EIA tight oil output data and average well profile data from Enno Peters’ shaleprofile.com. I have also created a scenario for the Niobrara shale oil play and for “other US LTO” which excludes the Permian Basin LTO, Eagle Ford, North Dakota Bakken/Three Forks, and the Niobrara.
Open Thread Petroleum, March 28, 2018
This is NOT a non-petroleum open thread, see post below for those comments.
Comments on oil and natural gas output should be in this thread, thank you.
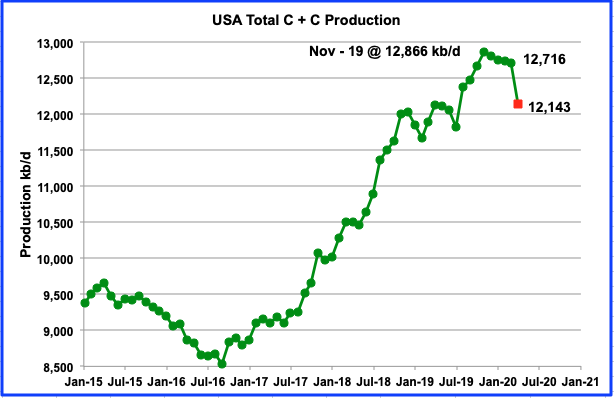
US Crude plus Condensate and Tight Oil, Jan 2018 Update
From Dec 2016 to Dec 2017 US Tight oil output has increased by 975 kb/d based on US tight oil output data from the EIA.
For the entire US we only have EIA monthly output estimates through Oct 2017. Over the Dec 2016 to Oct 2017 period US output has increased by 866 kb/d and the OLS trend has a slope of 821 kb/d.
Note that the 866 kb/d increase in US output over 10 months would be a 1040 kb/d increase over a 12 month period.
Most of the increase in US output has been from increased LTO output. The forecasts by several agencies (EIA, IEA, and OPEC) of more than a 1000 kb/d increase in US output in 2018 may assume that the recently increased oil price level will lead to increased investment in the oil sector.
Much of the increase in LTO output has been in the Permian basin and several factors may slow down the recent rapid growth. Among these are limited fracking crews, inadequate pipeline capacity for natural gas, which will limit output as flaring limits are reached, and potential water shortages.
Longer term the various LTO plays will run out of space to drill more wells in the tier one areas (the so-called sweet-spots) and this will limit the rate of increase within 2 or 3 years. It is likely that the Eagle Ford is close to this point, the Bakken might reach that point by 2019, and the Permian basin perhaps by 2021.
For US C+C output, I expect about a 600+/-100 kb/d increase in 2018.