OPEC’s Production and Outlook

The latest OPEC Monthly Oil Market Report is out with all the OPEC crude only production numbers for January 2015. There were very little revisions in the December numbers this month.

OPEC 12

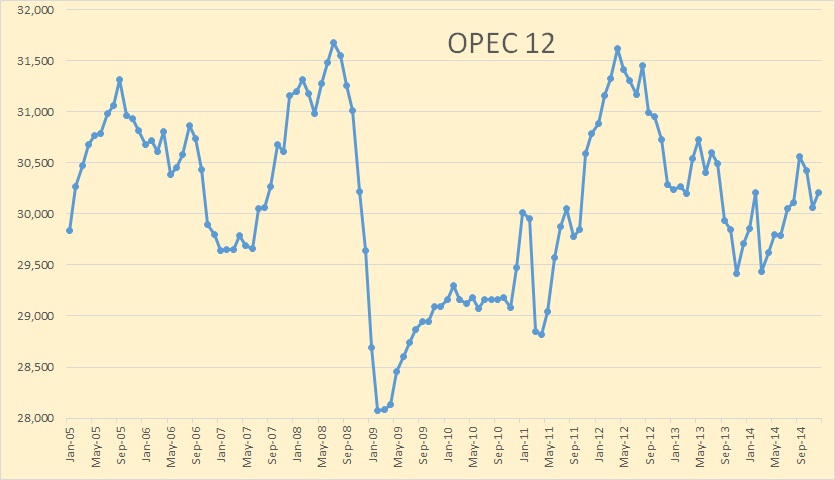
Total OPEC production of crude only was down 53,000 barrels per day in January to 30,153,000 barrels per day of crude only.

Algeria

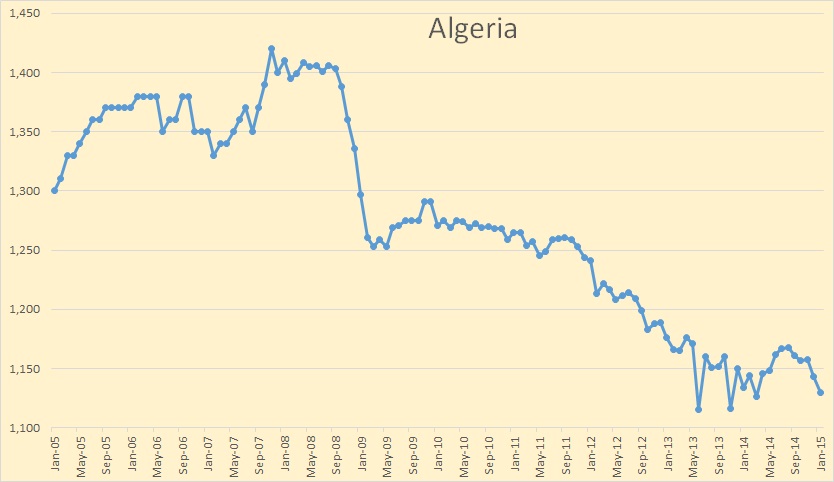
Algerian production has leveled out in the last year and a half but down slightly the last couple of months. January production slipped 13,000 bpd to 1,130,000 bpd.

Read More

Why we are at Peak Oil Right Now

In this life nothing is certain. Therefore I am not declaring, absolutely, that we are at peak oil, only that it is a near certainty. But I am putting my reputation on the line in making the claim that the period, September 2014 through August 2015 will be the year of Peak Oil. Below are my reasons for making this claim.

First of all, Peak Oil is not a theory. The claim that Peak Oil is a theory is more than a little absurd. Fossil hydrocarbons were created from buried alga millions of years ago and they are finite in quantity. And as long as we keep extracting them in the millions of barrels per day, it is only common sense that one day we will reach a point where their extraction starts to decline. In fact most countries where oil is extracted are already in decline. So obviously if individual countries can experience peak oil then the world as a whole can also experience peak oil.

All charts below are in thousand barrels per day of Crude + Condensate with the last data point September 2014.
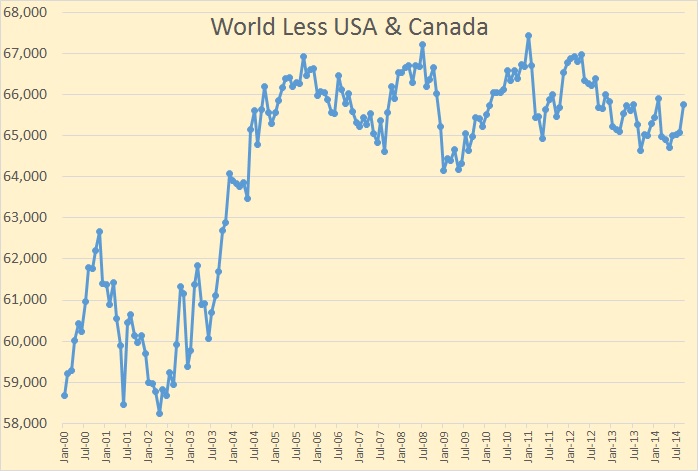
World Less USA & Canada

First I want to deal with the portion of the world that reached peak oil about four years ago, in January 2011. That is everywhere else in the world except the US and Canada. I am not saying that every country outside the US and Canada has reached peak oil, but combined they have reached peak oil

The world outside the United States and Canada has been on a bumpy plateau for ten years now and now, even with that last September 2014 surge, is still 1,670,000 barrels below the peak of January 2011. However only a few countries is responsible for this plateau.

The bumpy plateau actually began back in 2005 where the peak was in July. Since them, outside the USA and Canada, there have been 15 countries with production increases and 21 countries with production declines. Here is a look at the 15 winners outside the US and Canada.

Winners

Dealing with the winners one at a time:

Read More
OPEC Crude Oil Production, What’s Next?

The latest OPEC Monthly Oil Market Report is out with OPEC production data for. The data is “Crude Only” and does not reflect condensate production.

Also the charts, except for Libya, are not zero based. I chose to amplify the change rather than the total.

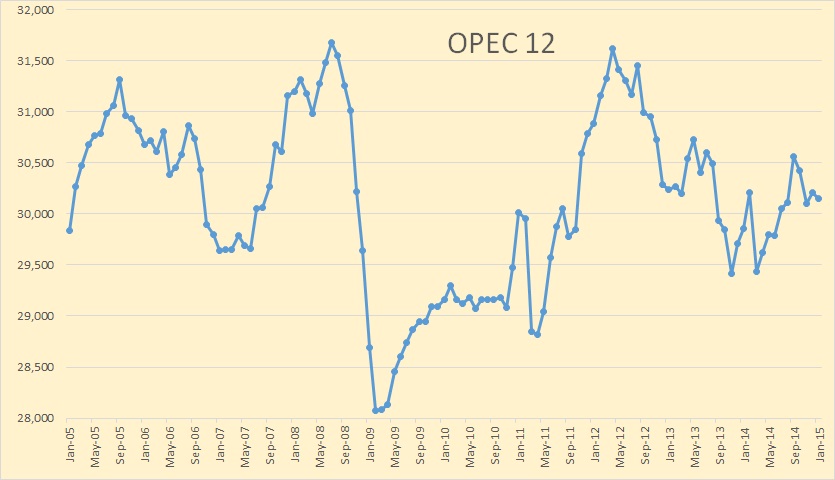
All Data is in thousand barrels per day with the last data point December 2014.

OPEC 12

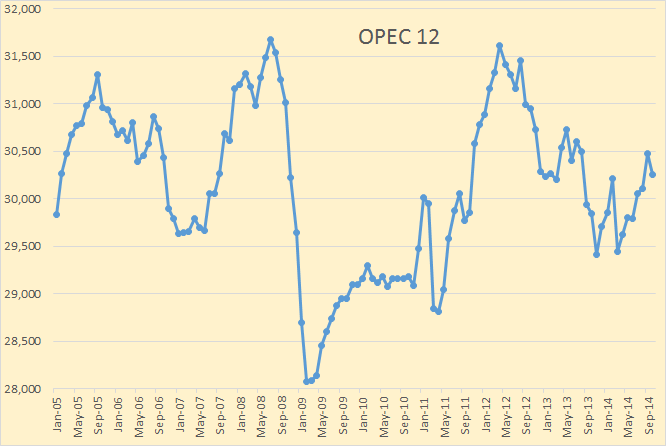
OPEC 12 production has averaged slightly above or below 30 million barrels per day for about two years now and there is little chance it will go anywhere very fast. But what is obvious from the above chart is there has been no surge in OPEC oil production. OPEC’s December production f 30,204,000 barrels per day is still more than 1.4 million barrels per day below the peaks of 2008 and 2012.

Algeria

 Algeria is struggling to keep production relatively flat. 

Angola

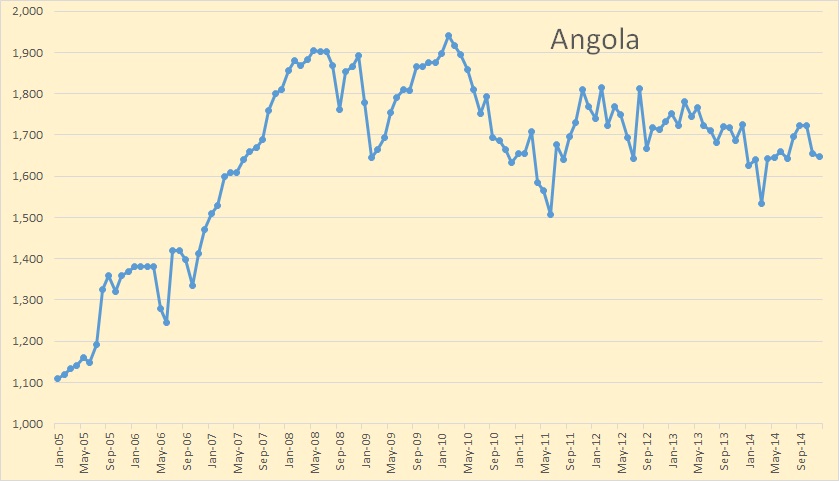
Angola is holding its own… so far.

Read More

OPEC MOMR October Production Data

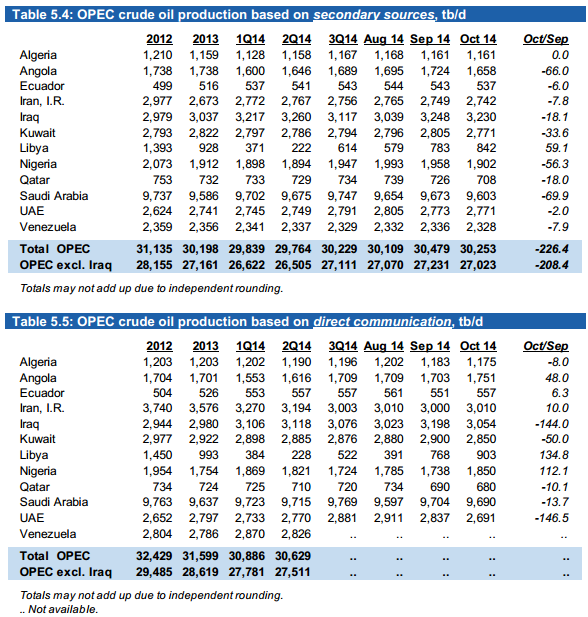
OPEC just published their November Monthly Oil Market Report which contains crude only production data for all OPEC nations. The only big surprise was that everyone had declining production except Libya and Algeria, that is according to “secondary sources”.

OPEC Secondary Sources

I find it interesting that Venezuela has, for the last several months, refused to give OPEC their production data.

All charts below are in the charts below are in thousand barrels per day with the last data point October 2014 and is based on OPEC’s “secondary sources”. I have decided to post all OPEC charts in this post.

OPEC 12

OPEC production declined 226,000 bpd. September production was revised only slightly, up 5,000 bpd.

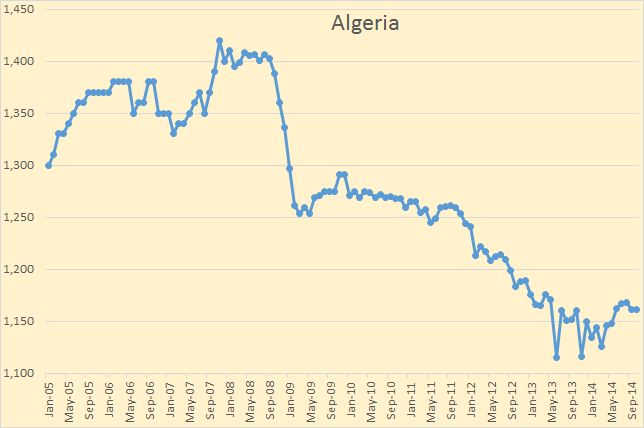
Algeria

Algeria has stopped their decline, temporally at least.

Read More

OPEC Update and news from Iraq

The new OPEC Monthly Oil Market Report just came out with their Crude Only production numbers for May. All data in the OPEC charts are in thousands barrels per day.

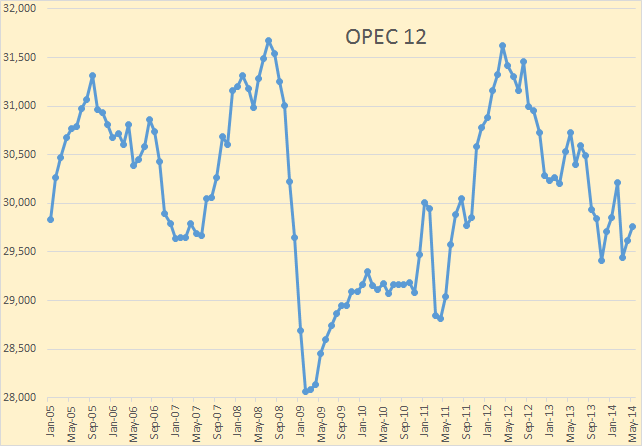
OPEC 12

There was very little in production changes and no surprises in the May data. Total OPEC production was up 142,000 barrels per day and that was after the April numbers had been revised up by 29,000 bpd.

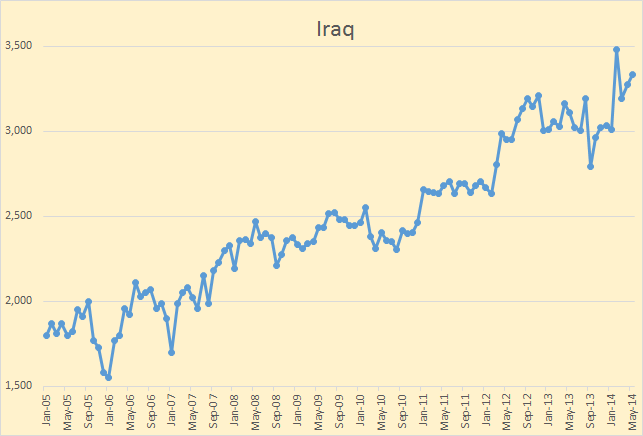
Iraq

Everyone is concerned about Iraq. Iraq’s April numbers were revised down by 22,000 bpd and May production was up 18,000 above that revised number. Iraqi production stood at 3,331,000 bpd in May but I expect that number will change in June and most definitely in July.
Read More