Eagle Ford Update

efchart/

Figure 1

 This was also posted at Peak Oil Climate and Sustainability

It has been a while since I have updated my estimate of actual output from the Eagle Ford.

Kevin Carter (KC at Peak Oil Barrel) graciously offered help pulling together data for the 39 fields which make up the Eagle Ford play (see this page at the RRC of TX, spreadsheet download here .)
Kevin has strong programming skills in Visual Basic for Applications (VBA) and has made the job of gathering the Eagle Ford data considerably easier.  Thank you Kevin!

My previous estimates only included the Eagleville fields (Eagle Ford 1 and Eagle Ford 2 and the inactive Eagle Ford and Eagle Ford Sour fields), Briscoe Ranch, Sugarkane, Dewitt, Gates Ranch, Hawkville, and Eagle Ridge fields.  Together these 10 fields produce about 99% of Eagle Ford C+C output so these previous estimates are not bad, this new estimate includes all Eagle Ford output reported by the RRC from June 1993 to January 2014.

Note that from June 1993 to Dec 2006 C+C monthly output from the Eagle Ford play was 12 b/d or less, which is why the chart starts at Jan 2007.

An Excel spreadsheet with the data can be downloaded here .  More below the fold.
Read More

The EIA’s Drilling Productivity Report, Is Productivity Really Improving?

The EIA just published their latest Drilling Productivity Report. They kept their very linear increase for all LTO plays except for the Bakken. Strangely they updated their Bakken data right up through January according to the data they apparently received from North Dakota.

DPR Bakken

The last data point is February for the North Dakota data and May for the DPR data.

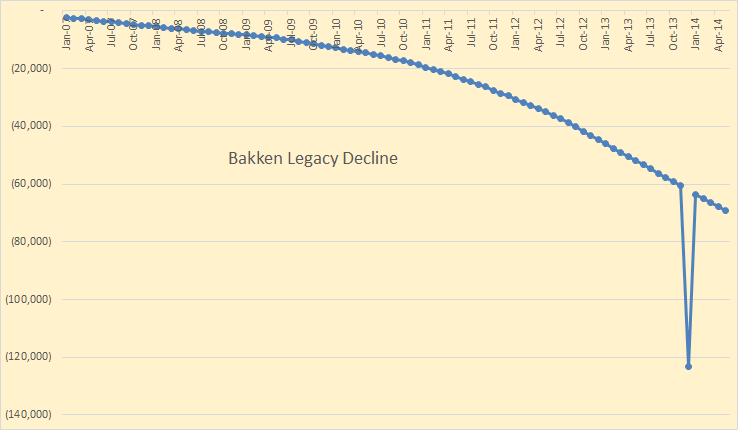
But the EIA posted some strange Legacy Decline numbers for the Bakken;

Bakken Decline Chart

Now this just doesn’t make any sense. The legacy decline is supposed to be the number of barrels per day all the wells in the combined declined. That number should increase, but gradually as new production comes on line. That is the more production the greater the decline. They have the decline rate at 60,553 bp/d in November, jumping to 123,248 in December, then falling back to 63,459 in January. That is impossible! The decline, in barrels per day, increases as production increases. But if production decreases then the number of barrels per day that declines must decrease, not increase.

Read More

Bakken Update February Production Numbers

The latest Update on Bakken and North Dakota LTO production is out.
ND Monthly Bakken Oil Production Statistics (Bakken Only)
ND Monthly Oil Production Statistics (All North Dakota)

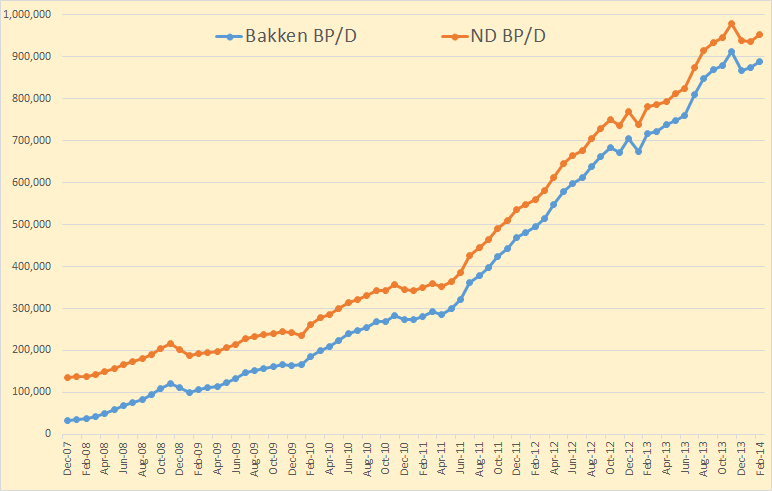
Bakken Barrels Per Day

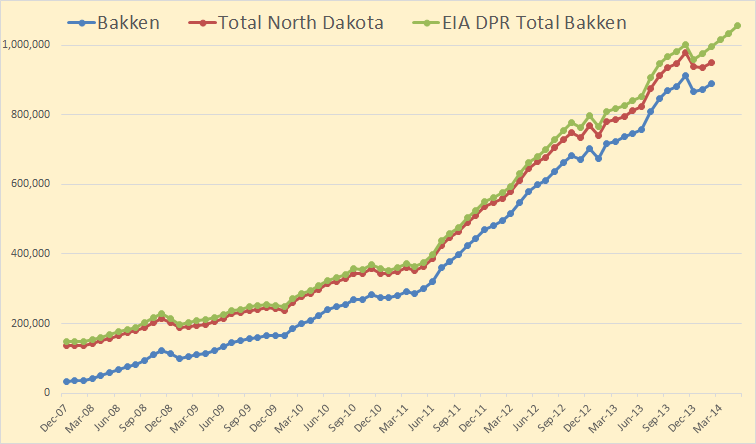
Bakken production in February was 888,398 barrels per day and all North Dakota February production was 951,350 barrels per day. Some revisions were made in the past production numbers. Only the last three months were significant however. Listed below are the actual production changes, per month, for the last three months:

Month         Bakken       North Dakota
Dec 13      -45,528        -40,284
Jan 14         6,542           -2,218
Feb 14       16,643          16,224

The Director’s Cut for this has not been published yet. I will update this post when it has been.  There were 119 additional wells in the Bakken and 79 in all North Dakota. That means a lot of North Dakota Wells were shut down.

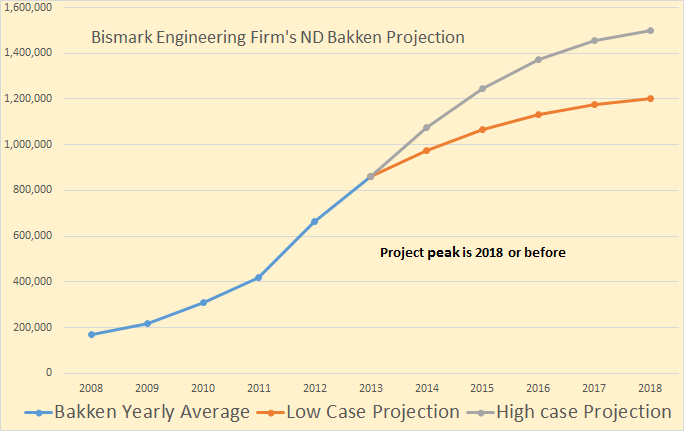
A Bismark engineering firm has calculated the probable Bakken Peak.
Competition from Texas, winter expected to limit ND oil production

MINOT, N.D. – North Dakota oil production, which is poised to break the 1 million barrels per day benchmark, will peak at 1.2 million to 1.5 million barrels per day over the next five years, limited by winter weather and competition from Texas, a Bismarck engineering firm said this week.

I have charted that prediction below. The figures are the average yearly production.

Bakken Engineering Firm

Read More

Texas RRC Crude and Condensate Data, Is Eagle Ford Peaking?

This page Texas Oil and Gas Production was last updated on February 18. However the data on this page has been updated. And the January production has been updated also: Oil and Gas Production Data Query then check “Lease”, “Both”, Statewide and then punch in the appropriate dates. Then when the next page comes up click on “Monthly Totals”. This brings up the updated monthly totals for Crude, Casinghead Gas, Gas Well Gas and Condensate.

There were revisions going back to July 2010 but only 2013 had any major revisions though there were some 2012 revisions also as the chart below shows.

Texas Revisions

The earlier revisions were smaller and there were some of them that were negative. That is the figures were revised downward.

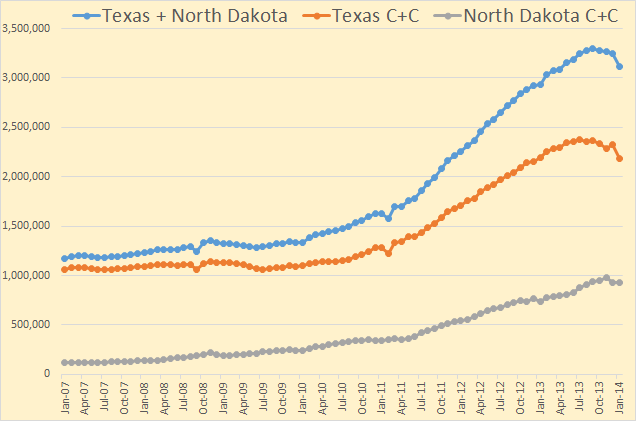
This chart compares Texas with North Dakota. This is all Texas not just Eagle Ford. The last data point for all is January 2014.

Texas + North Dakota

Though there is a lot of conventional production in Texas, the increase is nevertheless about all tight oil. And these two states produce perhaps 95% of all tight oil produced in the United States. And that is about 2  million barrels so far if the Texas RRC is close.

Read More

The EIA’s Drilling Productivity Report, Ghana and China

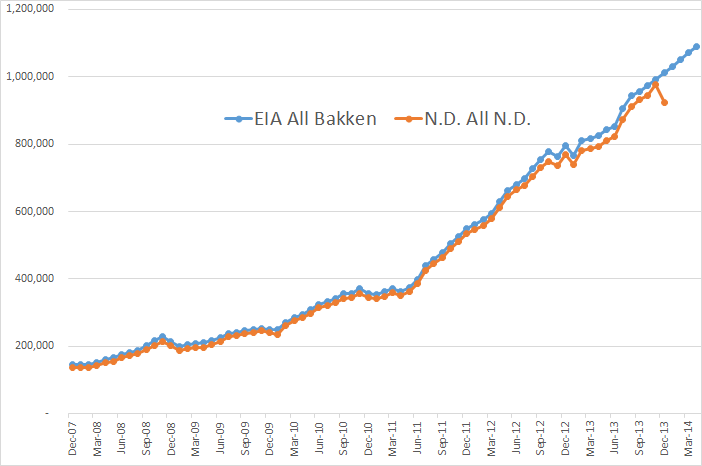
The EIA’s latest Drilling Productivity Report has been published. I found some strange things in the report. For the Bakken, their data does not jive with that posted by North Dakota. I have plotted the two together. The North Dakota includes all North Dakota but not the Montana part of the Bakken. The EIA data includes all the Bakken but not the non-Bakken part of North Dakota. Almost a wash but not quite. Montana produces slightly more than the non-Bakken part of North Dakota, but not very much. Anyway…

EIA New Bakken Report

I thought for sure that the EIA would hear that Bakken Production was down about 50,000 barrels per day in December. But Nooooo… they have the Bakken up by over 20,000 barrels per day in December, a difference of 70,000 bp/d. But up until the last two or three months they follow the North Dakota data pretty close so we can hope they update their data in a few months.

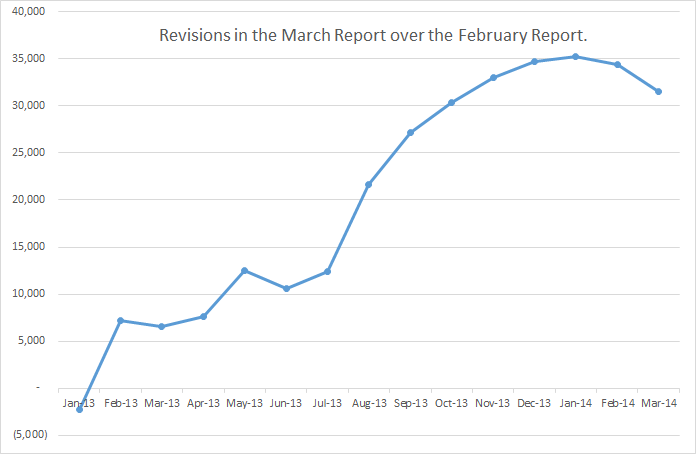
However all LTO production was revised upward in this last report. The chart below is the barrels per day that all tight oil was revised upward.

April Revisions

Doesn’t the strange shape of that chart raise suspicions? December production was revised upward by 34,672 bp/d when it actually should have been revised downward by perhaps twice that amount. January production was revised upward by 35,243 barrels per day. I doubt very much that this was the actual case.

Read More