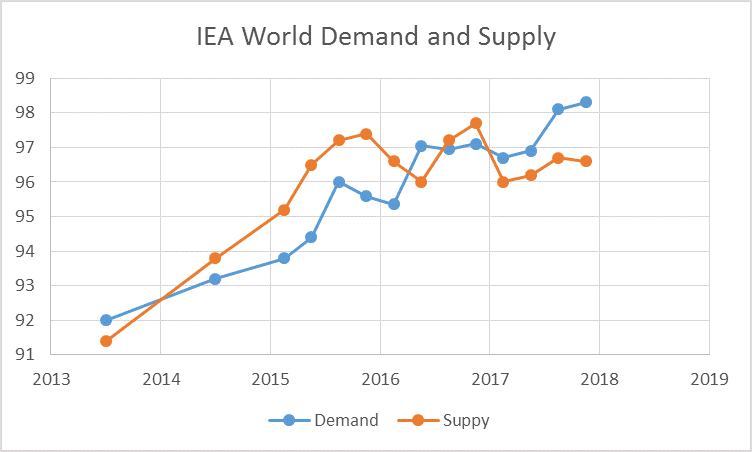
The IEA released highlights for the December Oil Market report in mid December. I have used information from the November report and assumed OPEC crude output will be 32.7 Mb/d and non OPEC output will be 500 kb/d below the November report supply estimate. I have also used the demand estimates from the December highlights. Read More
Tag: crude oil
OPEC Monthly Oil Market Report August 2016
OPEC released its Monthly Oil Market Report on August 10, 2016, I have pulled some items of interest from the report.
World Oil Demand
World oil demand growth in 2016 is expected to average 1.22 mb/d, some 30 tb/d higher than last month. For 2017, world oil demand is forecast to grow by 1.15 mb/d, unchanged from the previous report. While the OECD will contribute positively to oil demand growth adding some 0.10 mb/d, the bulk of the growth in 2017 will originate from the non-OECD with 1.05 mb/d.
World Oil Supply
Non-OPEC oil supply is expected to contract by 0.79 mb/d in 2016, following an upward revision of 90 tb/d since the previous report, driven by higher-than-expected output in 2Q16 in the US and UK. In 2017, non-OPEC supply is expected to decline by 0.15 mb/d, following a downward revision of 40 tb/d. OPEC NGL production is forecast to grow by 0.16 mb/d and 0.15 mb/d in 2016 and 2017, respectively. In July, OPEC production increased by 46 tb/d to average 33.11 mb/d, according to secondary sources.
Balance of Supply and Demand
Demand for OPEC crude in 2016 is estimated at 31.9 mb/d, unchanged from last report and 1.9 mb/d higher than in the previous year. In 2017, demand for OPEC crude is forecast at 33.0 mb/d, in line with the previous report and 1.2 mb/d higher than in 2016. Read More
Texas Oil and Natural Gas- June 2016
Dean has shared his estimates for Texas Oil and Natural Gas output. Texas (TX) C+C output was revised lower by -10, -17, -22, -18, and -52 kb/d for Nov 2015 through March 2016 respectively. Output in April 2016 increased by 27 kb/d from the revised March 2016 estimate to 3511 kb/d. The EIA estimate for March 2016 is 3276 kb/d, and Dean’s revised estimate is 3484 kb/d, 208 kb/d more than the EIA estimate.
World Crude plus Condensate Decline Rate
There is concern that World C+C may decline steeply after the peak, I believe those concerns are over blown. There is always the possibility that there could be a severe recession due to high debt levels, high oil prices or potentially due to both problems in combination. War and environmental damage due to overpopulation are also potential problems which may lead to a crisis.
If none of these problems arises in the near term (say for the next ten years), and demand for oil is high enough to keep annual average oil prices above $75/b from 2018 to 2025, then the average annual decline rate of oil (C+C) output will remain under 2%.
For simplicity in the analysis that follows, I assume the peak in C+C output is 2015 and that output will decline at a relatively steady rate from 2015 to 2025. This in unlikely to be the case in practice and the actual path of future world output is unknown, the intention is to determine a likely trend line for World C+C output. Using quarterly C+C output data from the EIA, I constructed the charts that follow.
Data is from the International Energy Statistics page at the EIA website.
The “Big 14” oil producers from 2002 to 2015 are (in order from largest to smallest): Russia, Saudi Arabia, United States, China, Iran, Mexico, Canada, UAE, Venezuela, Kuwait, Iraq, Nigeria, Norway, and Brazil. The Rest of the World (ROW) is all other oil producers besides the “Big 14”.
All charts below (except the natural log charts) are in kb/d.