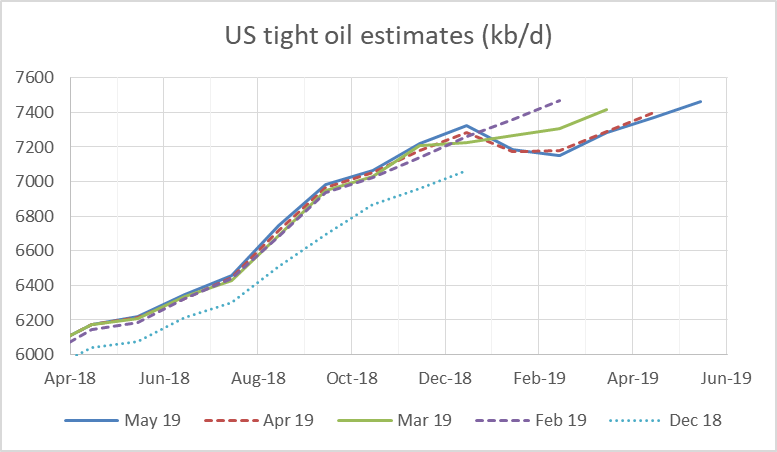
New tight oil estimates were recently released by the EIA. The chart below compares estimates from Dec 2018 to May 2019, where the Dec 2018 estimate is that estimate with the most recent month estimated being Dec 2018 and likewise the May 2019 estimate has May 2019 as the most recent month estimated. The May 2019 estimate is fairly close to the April 2019 estimate with a slight downward revision of the April 2019 estimate from 7399 kb/d to 7368 kb/d, March 2019 was also revised lower by 10 kb/d from 7292 kb/d to 7282 kb/d. For May 2019 the most recent estimate is 7462 kb/d and if past history repeats this estimate may be revised lower next month.
Tag: crude oil
GoM Reserves and Production Update, 1H2018
A Guest Post by George Kaplan
Crude and Condensate Reserves
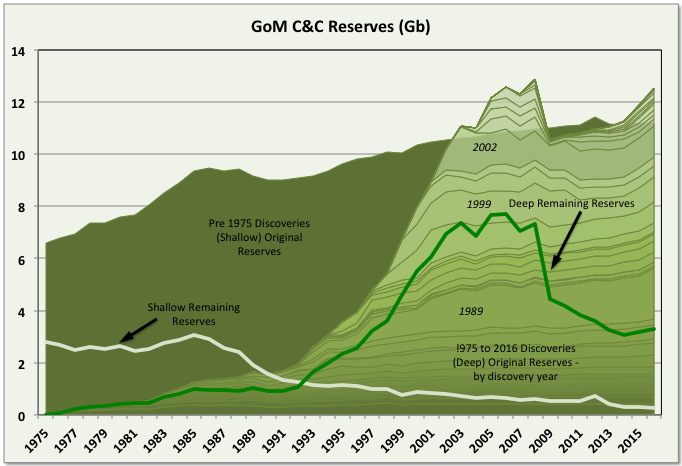
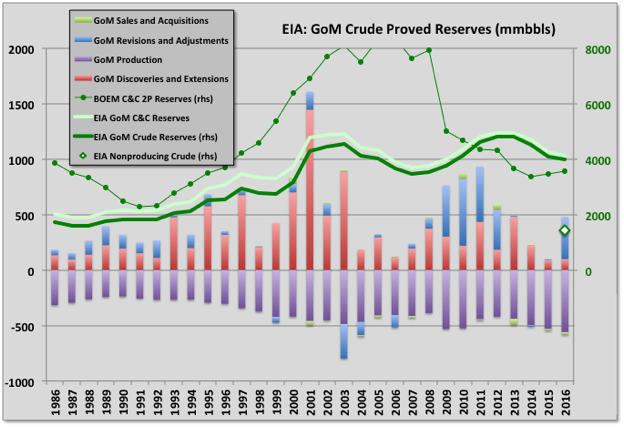
BOEM remaining C&C reserve estimates for GoM increased by 649 mmbbls for 2016 (i.e. to 31st December 2016). This was 112% reserve replacement and followed a similar growth of 618 mmbbls (111% reserve replacement) for 2015. The BOEM reserve calculation method appears to give highly conservative estimates. The increasing reserves followed several years, from 2006, of less than 100% reserve replacement, and actually negative numbers in 2006 and 2008. Current total original reserves (i.e. ultimate recovery) are a new high beating 2006 values, though deep water numbers are still below that year with the main growth appearing to be coming from: 1) older fields that were downgraded because of changes in SPE rules in 2007 (i.e. that reserves could only be booked if there were clear plans for their development within five years); and 2) newer discoveries, mostly smaller fields that are developed through tie-backs to existing hubs. These newer fields often do not get shown as new discoveries because BOEM records production and reserves against leases and each lease is recorded against a single field, even if there are deposits of different depth, age, geology and significant spacial separation within in it.
Current oil reserves are 3.569 Gb, which is 15% of the estimated original reserve (aka ultimate recovery). BOEM give the reserves as 2P (i.e. proven and probable) but they look very conservative and are actually lower than the EIA numbers, shown below, given for proven only and based on the operators own numbers, although the two are converging. The historical reserve histories look closer to how 1P (proven) numbers often appear, for example with some fields maintaining near constant R/P numbers, some showing large early drops that then come back over time, and some numbers being suspiciously low on fields obviously not near run out production rates (e.g. Mad Dog and Son of Bluto 2). I think the reserve calculations methods are fairly basic, given the amount of work required they couldn’t be much else, and use volumetric methods (i.e. reservoir area, depth, porosity, recovery factor) and previous decline data (I don’t now if the operators give them additional data such as well pressures).
Reserve Evolution History
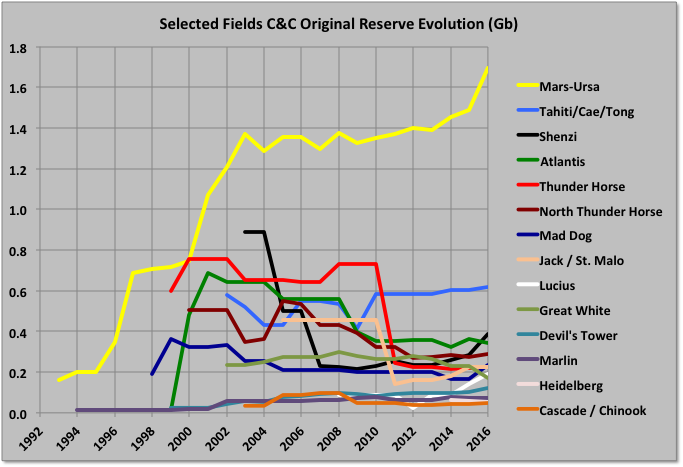
The Mars-Ursa fields have big original reserves, which have shown continuous growth. Other, large deep-water fields have mostly shown negative revisions from original reserve estimates, some quite large, though some of that is due to development timing (e.g. Mad Dog II reserves, when added, will likely recover all the earlier drop, and more). Shenzi has grown recently, and Atlantis will next year, both from new near field discoveries.
World Energy 2018-2050: World Energy Annual Report (Part 1)
Guest Post by
Dr. Minqi Li, Professor
Department of Economics, University of Utah
E-mail: minqi.li@economics.utah.edu
June 2018
This is Part 1 of the World Energy Annual Report in 2018. This author has developed world energy annual reports that have been posted at Peak Oil Barrel since 2014. The purpose of this Annual Report is to provide updated analysis of the current development of world energy production and consumption, consider possible scenarios of world energy supply over the 21st century, and evaluate their implications for global economic growth and climate change. This year’s Annual Report includes multiple parts:
Part 1 World Energy 2018-2050
Part 2 World Oil 2018-2050
Part 3 World Natural Gas 2018-2050
Part 4 World Coal 2018-2050
Part 5 Global Carbon Dioxide Emissions and Climate Change 2018-2100
Part 1 summarizes the general findings of this year’s World Energy Annual Report. Given the currently available information, world oil production is projected to peak in the early 2020s, world natural gas production is projected to peak in the 2030s, and world coal production is projected to peak in the late 2020s. Wind and solar power is projected to grow rapidly and account for about one-third of the world energy supply by the mid-21st century. Despite the rapid expansion of renewable energies, global energy supply and economic growth are expected to decelerate over the coming decades. By the mid-21st century, the energy-constrained global economic growth rates may not be sufficient to ensure economic and political stability for the existing world system. Although world carbon dioxide emissions are projected to peak before 2030, cumulative carbon dioxide emissions over the 21st century will be sufficient to result in global warming by more than two degrees Celsius relative to the pre-industrial time (assuming there will be no large-scale carbon sequestration programs).
Read More
GoM: First Quarter 2018, Production Summary
A Guest Post by George Kaplan
Crude and Condensate
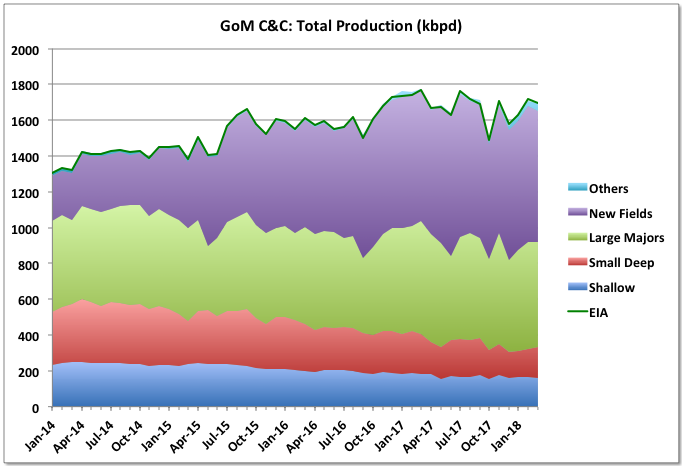
BOEM has March 2018 production at 1696 kbpd, which is down 1% month-on-month and 4% year-on-year (March 2017 was the peak production month for GoM so far). EIA numbers were very similar, although last month’s were higher and haven’t been revised yet – typically EIA numbers end up almost exactly corresponding to the BOEM reported total qualified lease production, whereas BOEM can be a little higher, maybe including test wells or non-qualified leases.
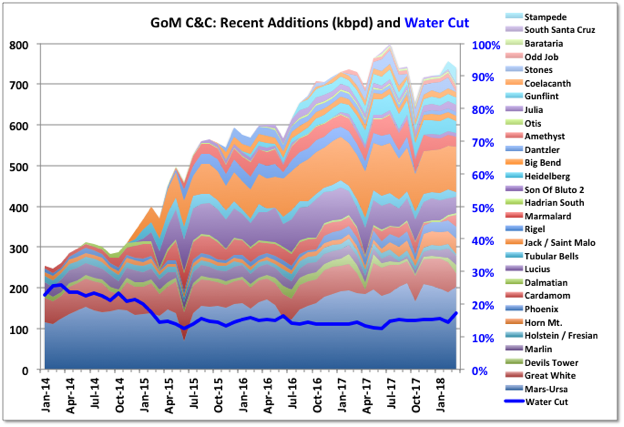
The major new project, Stampede, started in January, has no reported production numbers yet. BOEM and EIA estimate non-reported values and then retrospectively adjust their reports when actual numbers are available. I don’t know how they estimate new production but Stampede could produce around 60 kbpd with current plans, though likely a lot less initially as only one of two leases has been ramping up. I’ve assumed 20 and 40 kbpd for February and March respectively, which still might be high. Even allowing for that, and assuming other late numbers are the same as the previous month, since December EIA and BOEM both have estimates about 30 to 40 kbpd higher than the reported lease and well production numbers (which always match closely) would suggest. Usually the difference is no more than ten. It is unlikely that the other late numbers, of which there are few, and none for all four months, will show such large, sudden and unexplained increases so either I’m missing something (maybe a lease not yet included in the numbers, but also not reported as starting up) or there could be some future downward adjustments.
Rigel and Otis are still off-line following the failure at a subsea manifold last October and are taking out about 22 kbpd plus some gas (Otis is a small gas field). Great White, Stones (for the full month) and Caesar/Tonga all had noticeable downtime in March taking about 90 kbpd off-stream.
UK Offshore Production, 2017 Summary and Projections
A Guest Post by George Kaplan
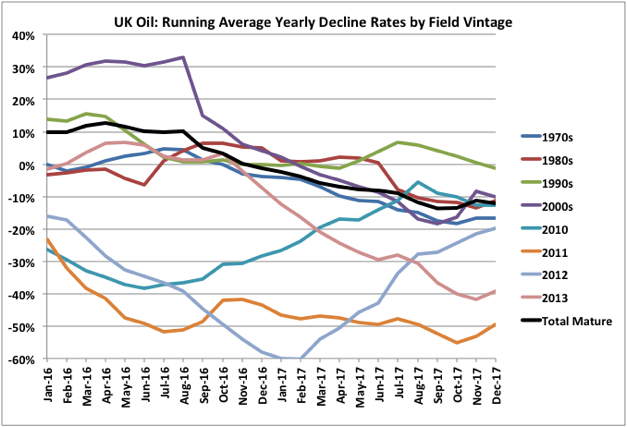
2017 trends for UK offshore production were disrupted by the stoppage in the Forties pipeline in December, which took several hundred thousand barrels of oil equivalent per day off line. Overall average oil production for the year dropped 61 kbpd (6.4%) and natural gas (including NGPLs) barely changed with an 800 boed drop. With the Forties issue exit rates don’t mean anything, but the running average oil production was on an upward trend in the second half of the year, which will continue through 2018, barring further major outages, while natural gas was noticeably declining and might struggle to maintain 2017s rate this year.
2016 reserve numbers fell for both oil and gas with few discoveries and some negative adjustments. Oil and gas production will decline from 2018, with accelerated falls from sometime in the mid-2020s without major new discoveries (which may include onshore shale gas, but that is not covered here).
UK C&C
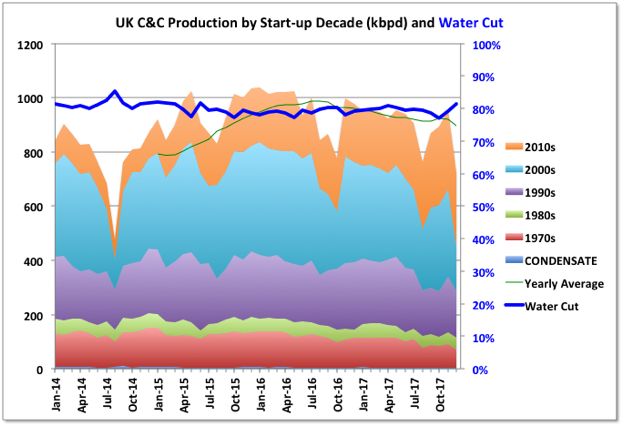
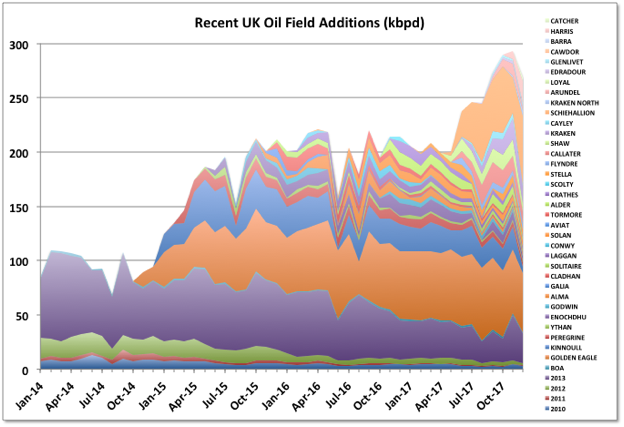
Through 2015 and 2016 a lot of smaller, short cycle developments came on line as a result of the boom from the high price years from 2011. Now larger projects started in those years are ramping up. The largest is the Glen Lyon FPSO, which is part of a revamp of two mature fields: Scheihallion and Loyal. Additionally at the end of 2017 Kraken, Catcher (including Burgman and Varadero fields) and WIDP (for fields Harris and Barra) were started and will continue to ramp up through early 2018. Clair Ridge was commissioned in late 2017, it has dry trees and a single platform drilling rig; production will ramp up as the wells are completed (they may need to complete production/injection pairs before being able to produce from each block, which may slow things down a bit). Statoil’s heavy oil field, Mariner with nameplate 55 kbpd, will also start up in 2018, after some delays. The Captain field has started trials of polymer injection, which is intended to ramp up through 2021, and, if successful, will maintain current production rates at around 25 to 30 kbpd.
The availability from some of the larger, mature producers seems to be increasingly impacted by unplanned outages, possibly just due to chance or their age, but maybe also impacted by cost cutting in response to the price drop in 2015. Apart from the Forties pipeline issue, in January the Chevron-operated Erskine field was taken offline by a wax pipeline blockage while pigging, there have been a couple of instances of fields being partially evacuated because of water quality issues, and the Ninian platform was evacuated ahead of a major storm because of doubts over its structural integrity.