A Guest Post by Dr. Minqi Li, Professor
Department of Economics, University of Utah
E-mail: minqi.li@economics.utah.edu
September 2018
This is Part 4 of the World Energy Annual Report in 2018. This part of the Annual Report provides updated analysis of world coal production and consumption, evaluates the future prospect of world coal supply and considers the implications of peak coal production for global economic growth.
This report uses Hubbert linearization to evaluate a region’s ultimately recoverable coal resources where a Hubbert linear trend can be meaningfully established, that is, where a clear downward trend of the annual production to cumulative production ratios can be identified and has been established for at least several years. Otherwise, this report uses alternative sources to establish a region’s ultimately recoverable coal resources, such as official reserves, official projections, or estimates made by energy research institutions.
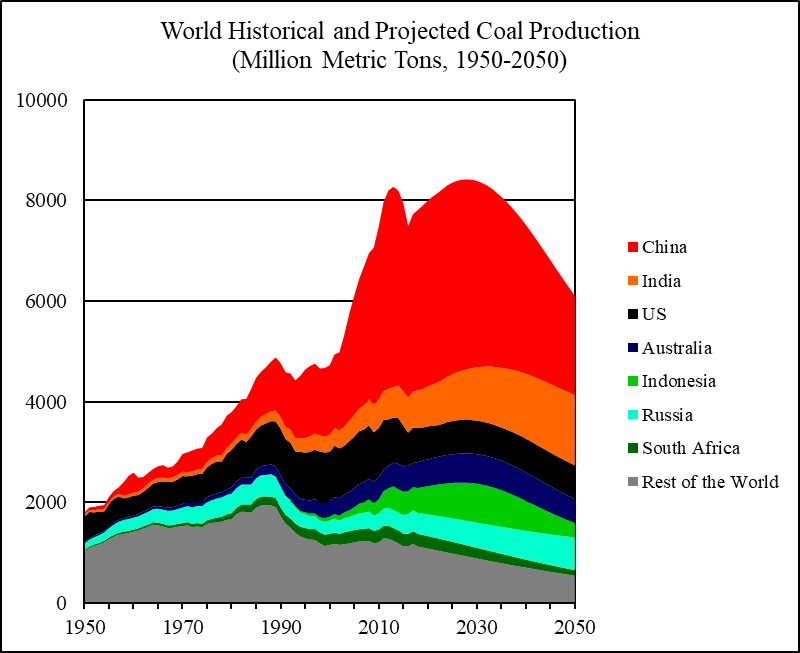
Figure 14 World Historical and Projected Coal Production, 1950-2050
Figures are placed at the end of each section. Read More
