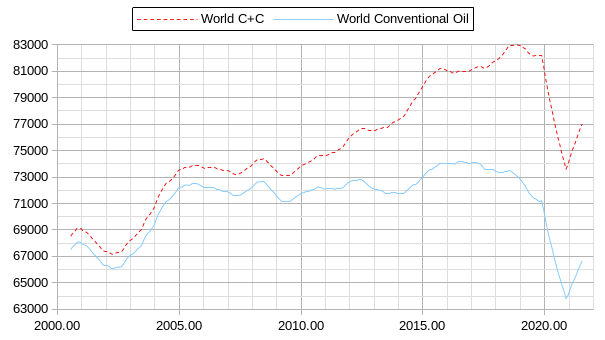
World Conventional Oil output peaked at a centered twelve month average (CTMA) of 74193 kb/d in July 2016. This peak is unlikely to be surpassed in the future. I do not include an estimate of unconventional oil produced in Venezuela as this data is difficult to find. In the chart below, I compare World C+C output to World conventional oil, which I define in this post as World C+C minus the sum of US tight oil and Canadian oil sands. The units for most charts (figures 11 and 12 are exceptions) will be kb/d on vertical axes. Data for oil output in all charts that follow will be the centered twelve month average output. Data is from the EIA’s International Energy Statistics.
Read MoreTag: Canada
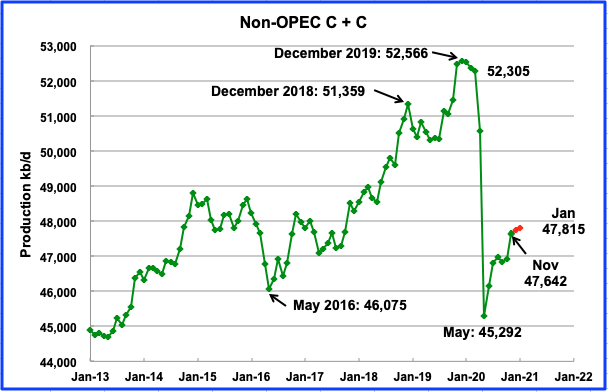
November Non-OPEC Oil Production Jumps
A post by Ovi at peakoilbarrel
Below are a number of oil (C + C ) production charts for Non-OPEC countries created from data provided by the EIAʼs International Energy Statistics and updated to November 2020. Information from other sources such as OPEC, the STEO and country specific sites such as Russia and Norway is used to provide a short term outlook for future output and direction for a few countries and the world.
This November post will primarily update the charts from the October report that was posted late on Saturday, February 20. The comments in the October post were up to date as of February 19 and so will be largely copied over to this post and updated where appropriate.
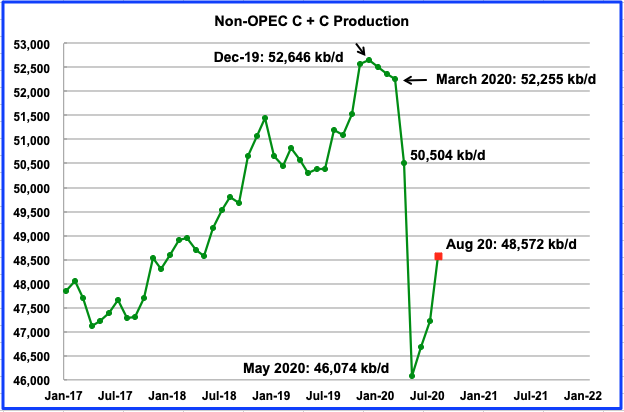
Read MoreNon-OPEC Oil Production Collapses in April
A post by Ovi at peakoilbarrel
Below are a number of oil (C + C ) production charts for Non-OPEC countries created from data provided by the EIA’s International Energy Statistics and updated to April 2020. Information from other sources such as the OPEC and country specific sites is used to provide a short term outlook for future output and direction.
Read MoreOPEC July 2020 Production Charts
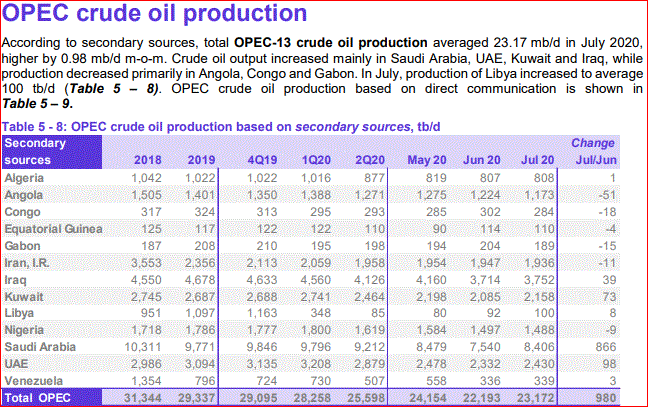
All OPEC data below is from the August OPEC Monthly Oil Market Report. The data is through July 2020 and is in thousand barrels per day.
OPEC crude only was up almost one million barrels per day in July.
The lions share of the increase in OPEC production came Saudi Arabia. Iraq, Kuwait, and the UAE accounted for the rest.
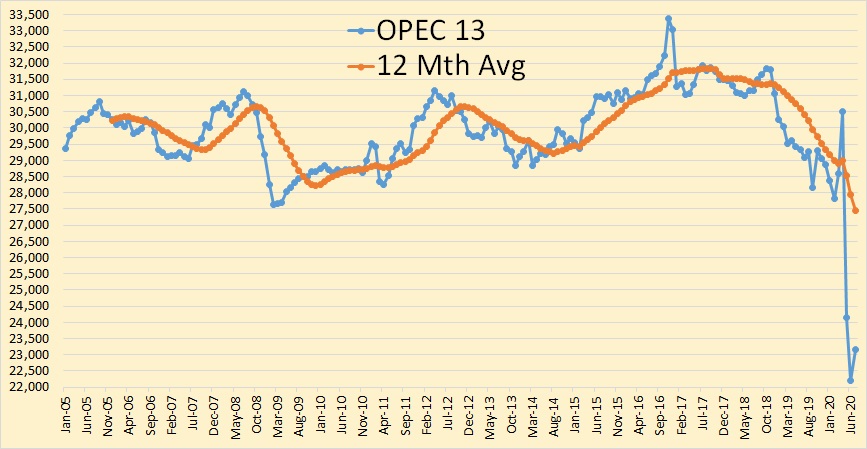
Read MoreOPEC December 2019 Oil Production Data
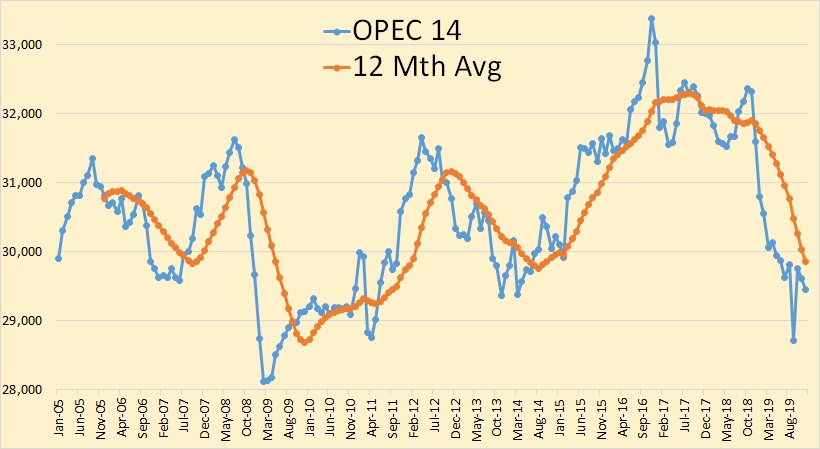
All OPEC data for the charts below are from the OPEC Monthly Oil Market Report https://momr.opec.org/pdf-download/
OPEC crude oil production continued to slide in December.
Read More